* Corresponding author: Tel: 02) 3277-4239, Fax: 02) 3277-3275, E-mail: [email protected]
─
─ 153 ──
생물보전지수 (Index of Biological Integrity) 및 서식지 평가지수 (Qualitative Habitat Evaluation Index) 를 이용한
평창강의 수환경 평가
안 광 국*∙정 승 현∙최 신 석
(*이화여자대학교 환경학과, 서울시 서대문구 120-750, 충남대학교 생물학과, 대전시 유성구 305-764)
An Evaluation on Health Conditions of Pyong-Chang River using the Index of Biological Integrity (IBI) and Qualitative Habitat Evaluation Index (QHEI). An , Kwang-Guk*, Seung-Hyun Jung and Shin-Sok Choi (*Department of Environmental Science and Engineering, Ewha Womans University, Dept. of Biology college of Natural Science, Chungnam National University)
We evaluated the health condition of Pyong-- Chang river, the tributary of Han-- River, using the Index of Biological Integrity (IBI) and Qualitative Habitat Evalua- tion Index (QHEI) during September 1999~~August 2000. The annual mean of IBI, which was estimated using eleven metrics, was 49 (range: 45~~51) and the mean of QHEI, which was estimated using seven parameters, was 88 (range: 76~~94) during the study. The river health, based on the IBI criteria of Karr (1981), ranged from
“excellent” to “good” conditions, while based on the habitat criteria of Plafkin et al.
(1989), it ranged from “pristine” (comparable to reference) to “supporting” condi- tions. Values of IBI showed slight differences between upstream and downstream sites and QHEI values varied weakly depending on characteristics of variables.
Regression analyses showed that annual values of QHEI had no functional relations with stream order (p = 1.82; n = 8) but showed some decreases near slight point-- sources. This result indicates that conditions of physical habitat did not change highly with increases of the stream order. According to analyses of feed guilds, relative abundance of insectivores, omnivores and carnivores was 85.1%, 3.5% 0.3%, respectively. Also, relative abundance of sensitive and tolerant species was 75% and 4.6%, respectively, while exotic and morphological anomalies were not found in the river. These outcomes indicate that health condition of fish, based on the trophic conditions of U.S. EPA (1993), was excellent in the river. Regression analyses of IBI values against the QHEI showed that the variation of habitat conditions accounted 57% for the variation of the Index of Biological Integrity (p⁄⁄0.05; R2 = 0.57; n = 7).
Overall data of IBI and QHEI suggest that the river health in the present is in optimal conditions but may be degradated by acceleration of chemical inputs and physical--habitat disturbance.
Key words : Biological integrity, IBI, Habitat, River health, Feed guild
서 론
지난30여년 동안 국내 하천에서 생물을 이용한 다각 적 수질평가가 수행되어 왔다. 평가에 이용된 주요 생물 군은 어류, 수서곤충 및 조류로 대별된다(송 등, 1995;
정, 1995; 변 등, 1996; 최 등, 1997). 어류의 경우 군집 분 석 평가 기법(양 등, 1994; 양 등, 1997; 최 등, 1997; 김 등, 1998, 최 등, 1999) 및 어류 지표종(송 등, 1995; 변 등, 1996; 성 등, 1997)을 이용하였으며, 다양도, 우점도 및 균등도 지수를 이용하여 안정적, 비 안정적 혹은 오 염에 의한 영향 유무가 있는 군집 등으로서 구분하여 하 천의 생태적 특성 및 건강도를 평가하였다. 수서곤충을 이용한 수 환경 평가에는 종들의 서식지 특이성을 기초 로 한 배(1993), 배 등(1992), 김 등(1995), 윤 등(1999) 의 연구가 있고, 조류를 이용한 수 환경 평가 방법은 정 (1995), 신(1996), 김 등(1996), 조 등(1998)에 의해 활발 히 연구가 진행되어 왔다.
국내에서 다른 측면의 수 환경 평가 기법으로는 수질 항목 분석 및 측정에 의한 평가로서 화학물질(독성물질, 영양염류, 유기물 등)의 시공간적 동태분석이 빈번히 수 행되어 왔다. 예를 들어, 허 등(1995)은 총인, 총질소 및 엽록소-a의 농도분포를 이용하여, 윤 등(1999)은 영양 염류 용출 및 외부인자 영향에 의거하여, 신 등(2000)은 부영양화에 따른 수질오염의 특성 차원에서, 김 등
(1995)은 독성물질의 유입현황에 의거하여 수 환경의
변화 추이를 평가하였다. 그러나 최근 정부 보고서(환경 부, 1987)에 따르면 이런 다양한 화학물질에 의한 오염 이 없는 상태일지라도 서식지 파괴(골재 채취) 및 단순 화 현상(주로 모래 하상구조)은 산란장 감소 및 먹이연 쇄 과정의 변경으로 인해 특정 종 및 생물군집의 감소 현상을 가져오고 있는 실정이다.
최근 미 환경청(US EPA)에서는 수 환경 평가를 위한 도구로서 어류를 이용한 생물지표도(biological criteria) 를 도입하고 있다(U.S. EPA, 1988; Van Putten, 1989;
Barbour et al., 1999). Karr (1981)는 하천 어류군을 이용 한 Index of Biological Integrity (IBI)의 개념을 최초로 1980년대 초에 도입하였고, 최근 어류 대신 조류(Algae) 및 수서 무척추동물을 이용한 변형된 다각적 기법이 소 개되고 있다. 어류를 이용하는 IBI 평가 기법은 다변수 를 이용한 하천평가 기법으로서 하천에 서식하는 생물 의 건강도, 수질에 민감성의 여부 및 영양단계(trophic structure) 등의 개념을 반영하는 기법으로 널리 알려져 있다. 따라서, 본 IBI 기법은 질적 감소를 보이는 하천복
원 작업과정에서 도달하고자 하는 목표 설정시 기본적 인 도구로서 이용될 수 있어서 미국외에 프랑스 (Oberdorff and Hughes, 1992; Oberdorff and Porcher, 1994), 기니아(Huguency et al., 1996), 나미비아(Hocutte et al., 1994), 인도(Ganasan and Hughes, 1998), 베네주 엘라(Gutierrez, 1994), 호주(Harres, 1995), 일본 (Kozumi and Matsumiya, 1997) 등에서 널리 적용되고 있는 실정이다. 하천 수 환경평가의 중요성을 인지한 미 환경청에서는 하천 평가의 핵심적인 접근방식으로서 2001년에 “신속한 생물평가 조서” (Rapid Bioassement Protocol, RBP)를 제시하고 있다(Barbour et al., 1999).
현재 국내의 경우 기존 생물을 이용한 평가는 주로 군집 혹은 특정 개체군의 한 두가지 특성(종수, 개체수, 지시종)만을 고려한 단편적인 사례가 주류를 이루고 있 다. 또한 전통적인 생물 평가 기법의 경우, 동일 조사지 점의 연구라 할지라도 연구자마다 조사 방법의 차이에 따른 변이가 커서 비교 평가가 어려웠던 것이 사실이다. 물리적인 서식지 평가 역시 기존의 방법은 정성적 평가 에 그쳐 공간적(지점별, 하천별, 수계별) 혹은 시간적(월 별, 계절별, 연별) 비교가 용이하지 않았다. 본 연구에서 는 최근 미 환경청의 Barbour et al. (1999)이 제시하고 있는IBI 평가 기법을 국내의 생태학적 특성에 맞게 메 트릭을 개발하여 수계 건강도를 판정하고 정량적 서식 지평가 기법(QHEI)의 도입을 통한 하천의 물리적인 건 강도를 평가하는데 목적이 있다.
조 사 방 법
1. 조사대상 지역 및 시기
본 IBI 산정 및 서식지 평가를 위해 강원도 평창군 소 재 평창강을 대상으로1999년 9월부터 2000년 8월까지 예비조사 및 본조사를 실시하였다. 조사지점의 선정은 하천 서식지 평가법(U.S. EPA 1983; Bartholow, 1989;
Plafkin et al., 1989)에 의거하여 다음과 같이 8개 조사 지점을 선정하였다(Fig. 1).
St. 1 : 강원도 평창군 평창읍 도돈리 도돈교(4차 하천) St. 2 : 강원도 평창군 방림면 방림1리(4차 하천) St. 3 : 강원도 평창군 방림면 계촌1리(3차 하천) St. 4 : 강원도 평창군 대화면 개수리 개수교(3차 하천) St. 5 : 강원도 평창군 봉평면 면온리 스키장하부(1차 하
천)
St. 6 : 강원도 평창군 봉평면 면온리 등메초등학교 상부 (2차 하천)
St. 7 : 강원도 평창군 봉평면 창동리 봉평교(2차 하천) St. 8 : 강원도 평창군 용평면 속사2리(2차 하천)
2. 조사내용 및 방법
1) 어류 조사
상기 기술된 8개 조사지점에서 어류 채집을 실시하였 으며, 모든 조사지점에서 투망(망목 5×5 mm), 족대(망 목 2×2 mm)를 사용하였다. 채집거리(distance sampled) 및 소요시간은 Wading Method (Ohio EPA, 1989)에서 제시된 방법을 따랐다. 각 조사 지점에서 채집거리는 200 m 구간으로서 조사구획 내의 여울(riff le), 소(pool) 및 미약한 흐름(run)이 있는 곳을 포함하였으며(Barbour et al., 1999), 채집 소요시간은 60분으로 한정하였다 (Ohio EPA, 1989). 채집된 어류는 Uchida (1939), 정 (1977), 김(1988), 최 등(1990), 김과 강(1993)에 의거하 여 동정 및 분류한 후 하천에 방류하였고, 분류가 모호 한 종은 10% 포르말린에 고정하여 실험실에 운반하였다.
2) 서식지 평가
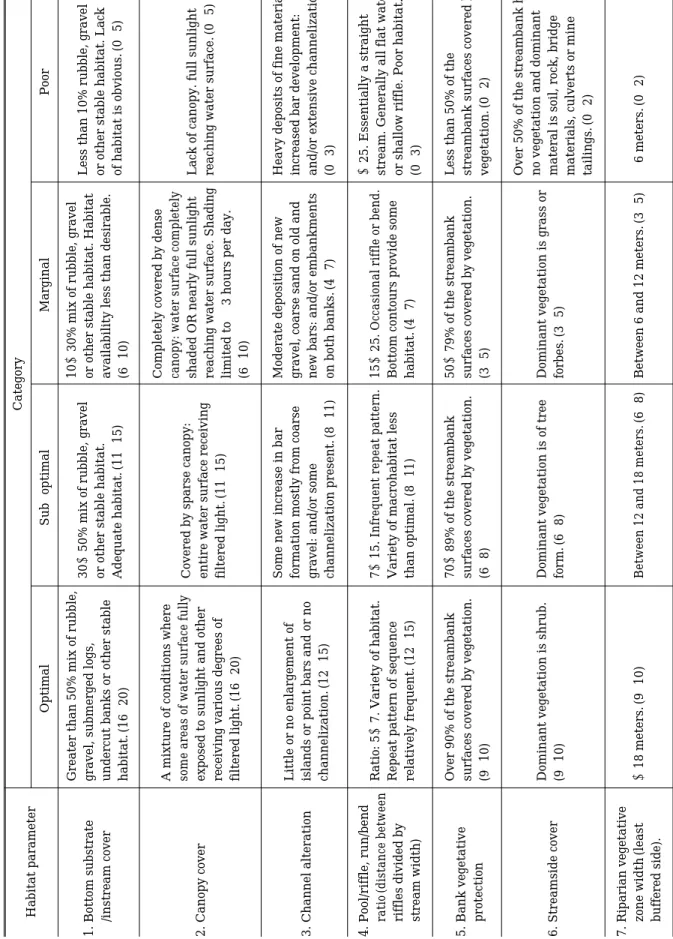
평창강의 서식지 분석은 Plaf kin et al. (1989)에 의해 도입된 질적 서식지 평가법(Qualitative Habitat Eval-
uation Index, QHEI)를 이용하였다. 변수의 선정은 하천 평가에 널리 인용되어온 U.S. EPA (1983), Hamilton and Bergersen (1984), Lafferty (1987), Bartholow (1989) 등의 방법에 의거하였으며, 전체 12개 항목 중에서 평창강의 환경에 적용 가능한 7개 항목을 선택하여 적용하였다 (Table 1). 각 변수는 최적상태(optimal), 보통상태(sub- optimal), 미진한 상태(marginal) 및 나쁜상태(poor)로 구분되었고, 각 등급에 대한 기준은 U.S. EPA (1993)에 의거하였다. 서식지 평가는7개 변수로부터 얻어진 합을 이용하여 하천의 건강도를 평가하였다. 즉, 미 환경청에 서 제시한 바처럼 “대조군과 유사한 서식지상태” (com- parable to reference; 점수: ¤90), 적절한 서식지 상태 (supporting; 75~89)”, 부분적으로 파괴된 서식지 상태 (partially support; 60~74) 및 파괴된 서식지 상태(non -support; ⁄59)로 대별하여 서식지 건강도를 평가하였 다.
3) 생물보전지수(IBI) 산정
본 조사에서는 IBI값을 산정하기 위해 Karr (1981)가 제시한 12개 메트릭 중 한국의 지역 및 어류 생태학적 특성에 맞게 수정한11개 메트릭을 이용하였다. 종 풍부 도 및 구성 성분(species richness and composition), 영 양단계 구조(trophic structure), 개체수 풍부도 및 상태 (individual abundance and condition)로 대별된 각 메트 릭에 대한 “5”, “3”, “1”의 점수분류(scoring category) 및 기준 선정은 하천 차수(Stream order) 및 지리적 특성에 따라 군집 구조가 변하기 때문에 국내의 평가에서 변형 후 적용하였다. 각 어류에 대한 서식지 분류(habitat guild)는 본 조사에서 이용된 메트릭 특성을 위해 여울 저서성종(riffle benthic species) 및 상류역의 수층종 (water column species in the headwaters)으로 구분하였 으며, 식성 및 서식지 특성은 김과 강(1993), 송과 권 (1993), 김(1995), 최(1994), 교육부(1997) 및 최(1998)에 의거하여 분류하였다. 본 연구 조사에서 사용된 각 메트 릭에 대한 특성 및 내용은 다음과 같다(Table 2).
(1) 어종 풍부도 및 구성(species richness and composition)
(메트릭 1): 총 토착종 수(total number of native f ish species) : 본 항목의 최대 종 풍부도 선은 Fig. 2A와 같 으며, 5차 하천을 기준으로 할 때 “5”, “3” 및 “1”의 점수 분류는 각각15~22, 7~14, 0~6종으로 구분되었다.
(메트릭 2): 여울 저서성종 수(number of riffle benthic species) : Karr (1981)가 제시한 “number of darter species” 혹은 “number of cottidae”는 국내의 실정에는 Fig. 1. Map showing the sampling sites of Pyong-Chang
River.
Table 1.Qualitative Habitat Evaluation Index(QHEI) in Pyong-Chang River. The numbers in the parentheses indicate the ranges of each category. Habitat parameterCategory OptimalSub-optimalMarginalPoor Greater than 50% mix of rubble, 30~50% mix of rubble, gravel 10~30% mix of rubble, gravel Less than 10% rubble, gravel 1. Bottom substrate gravel, submerged logs, or other stable habitat. or other stable habitat. Habitat or other stable habitat. Lack /instream coverundercut banks or other stable Adequate habitat.(11-15)availability less than desirable. of habitat is obvious.(0-5) habitat.(16-20)(6-10) A mixture of conditions where Completely covered by dense some areas of water surface fullyCovered by sparse canopy: canopy: water surface completely 2. Canopy coverexposed to sunlight and otherentire water surface receiving shaded OR nearly full sunlightLack of canopy. full sunlight receiving various degrees offiltered light.(11-15)reaching water surface. Shadingreaching water surface.(0-5) filtered light.(16-20)limited to ⁄3 hours per day. (6-10) Little or no enlargement of Some new increase in bar Moderate deposition of new Heavy deposits of fine material 3. Channel alterationislands or point bars and or noformation mostly from coarse gravel, coarse sand on old and increased bar development: channelization.(12-15) gravel: and/or some new bars: and/or embankmentsand/or extensive channelization. channelization present.(8-11)on both banks.(4-7)(0-3) 4. Pool/riffle, run/bend Ratio: 5~7. Variety of habitat.7~15. Infrequent repeat pattern.15~25. Occasional riffle or bend.¤25. Essentially a straight ratio(distance between Repeat pattern of sequence Variety of macrohabitat lessBottom contours provide some stream. Generally all flat water riffles divided by relatively frequent.(12-15)than optimal.(8-11)habitat.(4-7)or shallow riffle. Poor habitat. stream width) (0-3) 5. Bank vegetative Over 90% of the streambank 70~89% of the streambank 50~79% of the streambank Less than 50% of the protectionsurfaces covered by vegetation.surfaces covered by vegetation.surfaces covered by vegetation.streambank surfaces covered by (9-10)(6-8)(3-5) vegetation.(0-2) Over 50% of the streambank has no vegetation and dominant 6. Streamside coverDominant vegetation is shrub.Dominant vegetation is of treeDominant vegetation is grass or materal is soil, rock, bridge (9-10) form.(6-8) forbes.(3-5) materials, culverts or mine tailings.(0-2) 7. Riparian vegetative zone width(least ¤18 meters.(9-10)Between 12 and 18 meters.(6-8)Between 6 and 12 meters.(3-5)⁄6 meters.(0-2) buffered side).
적절하지 않아 Harris (1995)가 제시한 항목으로 대치하 여 적용하였으며, Fig. 2B에서 제시한 바와 같이 5차 하 천을 기준으로 할 때 “5”, “3” 및 “1”의 점수 분류는 7~10, 3~6, 0~2종으로 구분되었다.
(메트릭 3): 상류역 수층종 수(number of water colu- mn species) : Karr (1981)는 “sunf ish종 수” 혹은 “소 (pool)거주종 수”를 제시하였으나, 본 조사에서는 Ober- dorff and Hughes (1992)가 제시한 항목으로 대치하였고, Fig. 2C에서와 같이5차 하천을 기준으로 할 때 “5”, “3”
및 “1”의 점수 분류는 8~12, 4~7, 0~3종으로 구분되 었다. 본 평창강 수계에서 채집된 수층종 수는 총 12종 이었다.
(메트릭 4): 민감종 수(number of sensitive species) : U.S. EPA (1993)에 의거하여 내성종(tolerant species),
민감종(sensitive species), 중간종(intermediate species) 으로 구분하였으며, 어종 구분은 최(1994), 교육부(1997) 와 최(1989)의 기존 자료에 의거하였다. 본 조사 항목은 높은 부유물질로 인한 서식지의 하상구조 변경, 유기물 및 독성 물질로 인해 종의 감소가 기대되는 특성을 살 린 요소(Karr, 1981)로서 Fig. 2D와 같이 5차 하천을 기 준으로 “5”, “3” 및 “1”의 점수 분류는 9~14, 5~8, 0~4 종으로 구분되었다. 평창강 수계에서 채집된 민감 어종 은 Zacco temmincki, Acheilognathus signifer, Sarcho- cheilichthys varigatus wakiyae, Pungtungia herzi, Cor- eoleuciscus splendidus 및 Hemibarbus mylodon 등 총 19종이 여기에 해당되었다.
(메트릭 5): 내성종의 개체수 빈도(percent individuals as tolerant species) : 평창강 수계에서 채집된 내성종은 Table 2. Fish fauna and the various guilds of trophic level, tolerance and habitats in Pyong-Chang River.
Categories Sampling locations
Species Feed Tolerance Habitat
1 2 3 4 5 6 7 8 Total
guilds guilds guilds
Zacco platypus H T WC 10 2 31 6 27 31 17 124
Zacco temmincki I S WC 226 108 322 215 173 197 107 21 1,368
Acheilognathus signifer O S WC 10 3 13
Acheilognathus yamatsutae O I.M WC 19 19
Cyprinus carpio O T rB 1 1
Carassius auratus O T rB 2 2
Sarchocheilichthys varigatus wakiyae I S PB 2 2
Pungtungia herzi I S WC 39 2 16 6 13 36 5 8 125
Pseudopungtungia tenuicorpus H S rB 3 5 8 17 4 13 50
Coreoleuciscus splendidus I S RB 20 47 15 26 5 4 117
Hemibarbus labeo I S WC 1 1
Hemibarbus longirostris I S WC 1 12 23 19 2 3 29 89
Hemibarbus mylodon I S WC 3 2 1 13 8 33 60
Pseudogobio esocinus I I.M PB 1 5 11 6 4 5 14 46
Microphysogobio longidorsalis H S RB 6 18 17 45 4 7 9 24 130
Cobitis rotundicaudata O S RB 3 7 1 1 1 6 19
Iksookimia koreensis I I.M RB 1 3 1 8 13
Pseudobagrus koreanus P I.M PB 1 1 2
Silulus asotus P T PB 1 1
Silulus microdorsalis P S WC 1 2 3
Liobagrus andersoni I S RB 2 3 1 1 1 4 12
Coreoperca herzi I S WC 9 2 1 4 16
Siniperca scherzeri P S PB 2 2
Gobiobotia brevibarba I S RB 4 4
Nemacheilus toni I I.M RB 4 3 6 13 26
Moroco kumkangensis I S WC 8 15 13 355 388
Ladislavia taczanowskii P S RB 1 2 8 11
Moroco oxycephalus O S WC 4 2 6
Total Number of Species 23 16 16 13 10 14 9 9
Total Number of Individuals 364 225 460 372 242 352 206 433 2,654
*H: Herbivore, I: Insectivore, O: Omnivore, P: Piscivore, T: Tolerance, S: Sensitive, I.M: Inter mediate, WC: Water column, RB: Riffle benthic, PB: Pool benthic, rB: Run benthic
Carassius auratus, Cyprinus carpio, Silulus asotus, Za- cco platypus와 같은 수질 저하 및 유기물 오염에 상대 풍부도가 증가하는 종(최, 1989; 최 등, 1990; 김과 강, 1993)을 이용하였다.
(2) 영양단계 구조(trophic composition)
하천 생태계내 군집의 영양단계 역동성 및 에너지 흐 름관계를 평가하는 항목으로서 feed guild는 식충종 (insectivore), 초식종(herbivore), 잡식종(omnivore) 및 육식종(carnivore 또는 piscivore)으로 대별되었다. 각 guild 특성의 정의는 U.S. EPA (1991)를 따랐고, 어종의 각 범주 구분은 최(1994), 교육부(1997)와 최(1989)의 문헌들에 의거하였다.
(메트릭 6): 토착 잡식종의 개체수 빈도(proportion of individuals as native omnivores) : 잡식성종은 동식물을 구분하지 않고 섭식하는 종으로 정의되며(Ohio EPA, 1989), 서식지의 물리∙화학적 질적 하강에 따라 어종의 풍부도는 증가하는 특성을 반영하는 메트릭을 선정하였 다.
(메트릭 7): 토착 식충종의 개체수 빈도(proportion of individuals as native insectivore) : 식충성 종은 주로 수 중 무척추동물을 섭식하는 종으로서(Ohio EPA, 1989), 서식지 파괴 및 수질오염의 질적 하강에 따라 풍부도의 감소를 보이는 메트릭으로서Karr (1981)가 제시한 메트 릭을 이용하였다.
(메트릭 8): 토착 육식종의 개체수 빈도(proportion of individuals as native carnivores) : 본 메트릭은 주로 어 류를 먹이로 하며 최고 상위를 점유하는 어종으로서, 서 식지의 질적 하강에 따라 풍부도가 감소하는 특성을 보 이는 특성을 포함하는 메트릭으로서 Karr (1981)가 제시 한 메트릭을 변경하여 이용하였다(Ohio EPA, 1989).
(3) 개체 풍부도 및 건강도(individual abundance and health)
개체 풍부도 및 건강상태를 판정하는 항목들로서 Karr (1981)가 제시한 “교잡종 개체수 비율(percent of individuals as hybrid species)”은 “도입종의 개체수 빈 도(percent of individuals as exotics)”로 대치하였다.
(메트릭 9): 총 개체수(total number of individuals in samples) : 개체수에 의거한 풍부도를 평가하는 항목으 로(U.S. EPA, 1991) 현지의 본 조사지점에서 채집된 어 류의 개체수는 대조군 조사지점(Reference site)의 결과 를 기초로 한 최대 종 풍부도 선을 이용하여 산정하였 다(Fig. 2E).
(메트릭 10): 도입종 개체수 빈도(proportion of indivi- duals as exotic species) : 환경의 질적 저하에 따라 도입
종의 상대 풍부도는 증가하는 항목으로U.S. EPA (1991) 기준을 적용하였다.
(메트릭 11) 비정상종의 개체수 빈도(proportion of individuals with anormalies) : 어류의 외형적 건강를 반 영하는 항목으로 본 조사에서는 Sanders et al. (1991)의 방법에 따라 기형(Deformity), 피부 진무름(Erosion), 외 상(Lesion) 및 종양(Tumor)의 4부류로 구분하는 외형적 비정상도 판정법을 이용하였다.
(4) 보전지수 등급(integrity class)
각 조사정점의 보전지수 등급은 본 조사에 맞게 변경 된11개 조사항목의 메트릭 값을 합산하여, 하천 건강도 등급을 “Excellent”, “Good”, “Fair”, “Poor” 및 “Very Poor”의 5개 범주로 구분하여 하천을 평가하였다(Karr, 1981).
결과 및 고찰
평창강의 서식지 평가(habitat evaluation)에 따르면, 서식지의 질적 변화는 조사지점 및 이용된 변수의 특성 에 따라 변화하였다. 변수들 중 하상기질(bottom sub- strate) 및 하천 피도(instream cover)에 의거한 평가 (U.S. EPA, 1983)에 따르면 최적상태(optimal condition) 로 부터 최적에 못 미치는 보통 상태(sub-optimal condition)의 범위에 있었다. 수피도(canopy cover)는 조 사지점이 교목 및 관목으로 이루어진 산으로 둘러싸여 모두 최적상태(optimal condition)로 나타났고, 수로 변 경도(channel alteration)는 제2지점 및 7지점을 제외하 고는 최적상태를 유지하였다. 소와 여울의 분포비 (pool/riff le ratio) 및 유로 직선도와 굴곡도비(run/bend ratio)의 평가기준에 따르면, 대개의 조사지점에서 opti- mal 혹은sub-optimal 상태를 보였지만, 제7지점의 경우 미진한 서식지 상태(marginal condition)로서 뚜렷한 질 적 감소를 보였다. 이런 서식지 질적 하강은 소 및 여울 의 분포도(pool/riff le), 유로 직선도 및 굴곡도(run/bend) 에 있어서15~25%로서 미약한 서식지 특성의 반영 때 문으로 사료되었다. 이와 같은 결과는 북미 및 유럽의 온 대권 1, 2차 하천들과 유사한 결과를 보였다(Hamilton and Bergersen, 1984; Lafferty, 1987; Bartholow, 1989).
제방 식생 보호도(bank vegetative protection)는 모든 정점에서 optimal 혹은 sub-optimal 상태에 있었다. 제 방 가장자리를 덮고 있는 천변 피도(streamside cover) 는 제4지점을 제외한 모든 조사지점에서 marginal 상태 를 보였으며, 이는 하천제방이 홍수 등의 영향으로 식생 분포가 열세했기 때문으로 사료되었다. 제방을 덮고있는
식생 폭(riparian vegetative zone width)에 의거할 때 제3, 6지점은 제방 식생이 6~12 m 이하로서 marginal 상태를 보인 반면, 그 밖의 지점들은 최적 상태(opimal) 로 평가되었다(Table 3). 상기 모든 변수들의 합으로부 터 얻어진 총체적인 서식지 평가에 따르면 U.S. EPA (1993)의 기준에 의거하여 제1, 4, 5 및 8지점들은 오염 이 전혀 없는 맑은 계류와 비유할만한 최적상태의 서식 지 조건인 “Comparable to reference”로 판정되었고, 그 밖의 지점들(제2, 3, 6, 7지점)은 생물서식을 적당히 지탱 할 만한 “Supporting”상태를 보였다.
평창강에서 모든 조사정점에서 얻은 종 목록, 서식지, 내성도 및 영양도에 대한 길드는 Table 2와 같다. 본 조 사 기간동안 총 종 수는 하천차수에 따라 증가하는 경 향을 보였다(Fig. 5A). 물질순환 관계를 나타내는 Feed guild 중 식충종(insectivores)은 채집된 총 어종의 85.1%를 차지하였으며, 이는 각 지점별로 유사한 수치 (상대 풍부도 범위: 93.5~80.9)를 보였다. Fig. 5B에서와 같이 하천 차수에 따른 식충종의 비율은 하천 차수에 따른 별다른 차이를 보이지 않았고 2차수 하천인 8지점 에서 가장 높은 수치를 보였다. 전체 지점에 의거한 잡 식종(omnivores)의 평균 상대 풍부도는 4% (상대 풍부 도 범위: 11.6~0.2)를 차지하였고, 전체 지점중 제6지점 에서 12%로 가장 높게 나타났다(Fig. 5C). 이와 같은 결 과는 식충종의 상대 빈도와 비교해 볼 때 이는 Feed guild 입장에서 하천 건강도가 잘 유지됨을 시사하였다. 육식종(carnivores)은 총 2,654개체 중에서 8개체가 채 집되어 0.3%로서 빈약함을 보였다. 민감종(sensitive species)은 전체75%를 나타냈고, 지점8에서 가장 높은 수치(89%)를 보였다(Fig. 5D). 한편 전 조사지점에서 도 입종(exotics species) 및 비정상종(anomalies species)의 개체는 채집되지 않았다. 이런 결과는 U.S. EPA (1993)
의 어종 조성도, 영양구조도 및 외부형태에 근거할 때 본 수역내 어류군은 높은 건강도를 유지하는 것으로 사 료되었다.
본 조사기간 동안11개 메트릭을 이용하여 산정돤 평 균 IBI값은49 (범위: 51~49)로서Good~Excellent 범위 에 있었고, 평균 QHEI 값은 88 (범위: 94~76)였다. U.S.
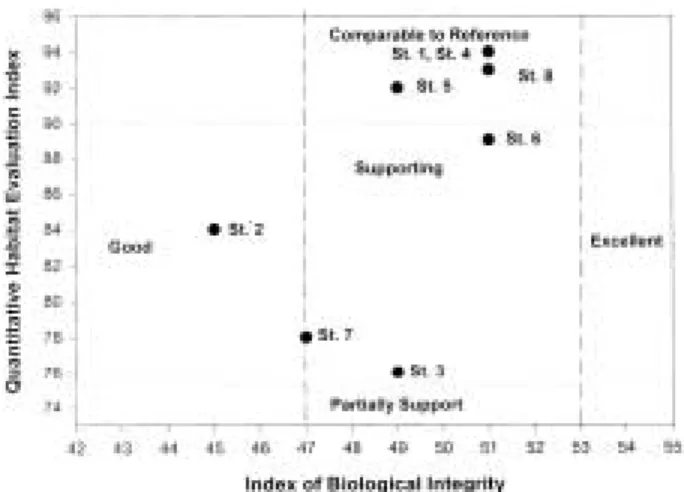
EPA (1993), Karr (1981) 및 Plafkin et al. (1989)의 분류 기준에 의거할 때 본 조사 수계는 최적상태(“compara- ble to reference”) 혹은 적정 서식지 상태(“supporting”) 를 유지하고 있었다(Fig. 3). 지점별 평균값에 근거한
QHEI 값과 하천차수 사이에는 유의한 상관관계를 보이
지 않았다(p = 1.82, n = 8; Fig. 4A). 이러한 결과는 하천 크기가 증가해도 점 오염원(독성물질 및 유기물)의 부재 로 인하여 서식지에는 큰 변화를 주지 않는다는 사실을 제시하는 바이다. 계산된 IBI 값에 따르면, 제2지점 및 7 지점은 “Good” 상태로 판명되었고, 그 외 나머지 지점들 (제1, 3, 4, 5, 6 및8지점)은 “Excellent~Good” 범위에 있 었다(Table 4). 특히 제1지점에서 어류의 분포특성, 영양 구조 및 오염의 민감도 등의 메트릭에 근거한 IBI 값은 51로서 최적상태를 유지하는 것으로 판명되었고, QHEI 의 최대값과 일치하였다. 제1지점에서 이러한 최적조건 은 오대산, 계방산, 가리왕산, 백덕산을 경계로 한 집수역 내의 물이 이곳을 통과하여 유량이 풍부하고, 여울 및 소와 같은 다양한 하상구조때문으로 사료되었다. 반면, 제2지점에서 IBI 값은 45로서 본 조사지점들 중 최저값 을 보였는데, 이는 인근 취락지로부터 일부 생활 하수의 유입으로 인한 내성종 수의 증가 및 수층종 수의 감소 가 총 메트릭 값의 감소를 가져온 것으로 분석되었다. 제3지점의 경우 다른 지점에 비해 다소 낮은 QHEI 값 을 보이지만 IBI 값은 다른 지점과 유사하였다. 특히 제 7지점에서 QHEI 값은 IBI 값과 함께 낮은 값을 보였는 Table 3. Qualitative Habitat Evaluation Index (QHEI) at eight sampling sites in Pyong-Chang River.
Habitat parameter Sampling locations
St. 1 St. 2 St. 3 St. 4 St. 5 St. 6 St. 7 St. 8
1. Bottom substrate 20 18 19 20 18 20 15 20
2. Canopy cover 20 20 20 18 20 20 20 20
3. Channel alteration 15 7 15 15 15 15 11 15
4. Pool/riff le, run/bend ratio (distance
between riff les divided by 14 14 14 14 14 14 7 14
stream width)
5. Bank vegetative protection 10 10 8 9 10 10 10 9
6. Streamside cover 5 5 5 9 5 5 5 5
7. Riparian vegetative zone width
(least buffered side) 10 10 5 9 10 5 10 10
Total score 94 84 76 94 92 89 78 93
데 이는 인위적인 건설, 서식지 단순화 현상 및 미약하 나마 생활 하수에 의한 영향으로 판단되었다. 이러한 특 성은 내성종 비율(8.2%)의 증가를 가져왔다(Fig. 5E).
본 연구에 따르면 평창강 수계에서 종 풍부도는 하천 차수에 따라 증가하였다(Fig. 5A). 이런 결과는 하천의 크기가 증가해도 점 오염원 및 비 점 오염원의 영향이 미약함을 의미하며 본 조사 수계는 비교적 보전이 잘 되어 있다는 것을 의미하였다. Fig. 3에서 제시하는 바와 같이 QHEI와 IBI 값 사이에는 정상관계로 보였고, IBI
값은 서식지 질이 향상되면서 증가되는 경향을 보였다 (R2= 0.57; p⁄0.05; n = 7; Fig. 4B). 이런 결과는 북미에서 Plafkin et al. (1989)이 제시한 바와 같이 서식지의 물리 적 상태가 IBI에 직접적으로 영향을 나타내고 있음을 나타냈다.
U.S. EPA (1993)의 보고에 따르면, 하천차수가 증가할 수록 혹은 하류로 갈수록 하천 오염원 증가에 의해 IBI 값이 낮아지는 것은 일반적이다. 이전의 IBI에 의거해 평가된 금호강(염 등, 2000)의 보고에 따르면, 하천차수 Fig. 2. Maximum species-richness line for total number of fish species (A), the number riffle benthic species (B), the number of water column species (C), the number of sensitive species (D) and total number of individuals (E) against the stream order in Pyong-Chang River.
의 증가에 따라 IBI 값의 감소는 명확했다. 그러나, 평창 강에서 IBI 값은 상, 하류 사이에 큰 차이를 보이지 않 았다. 대부분 조사지점에서 높은 IBI 값의 결과는 본 연 구에서 수행된 서식지 평가지수로서도 설명이 가능하다. 본 조사기간동안 평균 QHEI 값은 88로서, U.S. EPA (1993) 기준에 의거할 때 “Supporting”상태로서, 수중생 물의 서식에 적합한 상태를 보였다. 이것은 평창강의 경 우 다양한 하상구조, 계곡주변의 교목 및 관목의 풍부한 식생, 적당한 광 조건 등으로 1차 생산력 지지에 의한 결과로 사료되었다. 또한, QHEI 값과 하천차수 사이의 유의하지 않은 상관관계(p = 1.8; n = 7)는 하천의 크기가 증가해서 하류로 내려가도 점 오염원의 영향이 미약함 을 의미하였다. 이런 결과는 상, 하류사이의 IBI 값에 큰
차이를 가져오지 않았다.
외국의 사례를 보면Hugueny et al. (1996)은 아프리카 기니아 지역의 하천을 조사하였는데 하류로 갈수록 보 Fig. 3. Relationships of the index of biological integrity
(IBI) and the quantitative habitat evaluation in- dex (QHEI).
Fig. 4. Regression analyses of qualitative habitat evalua- tion index (QHEI) against stream order (A) and the index of biological integrity (IBI) against the QHEI. Each data point indicates annual mean by site (B) in Pyong-Chang River. The dot-lines indi- cate a 95% conf idence interval.
Table 4. Index of Biological Integrity (IBI) at eight sampling sites in Pyong-Chang River.
Parameter Sampling locations
1 2 3 4 5 6 7 8
1. Total number of native f ish species 5 5 5 5 5 5 5 5
2. Number of riff le benthic species 3 5 5 5 5 5 3 5
3. Number of water column species 5 3 5 5 5 5 5 5
4. Number of sensitive species 5 5 5 5 5 5 5 5
5. Proportion of individuals as tolerant species 5 3 3 5 3 5 3 5
6. Proportion of individuals as omnivores 5 5 5 5 5 5 5 5
7. Proportion of individuals as native insectivores 5 5 5 5 5 5 5 5
8. Proportion of individuals as native carnivores 3 1 1 1 1 1 1 1
9. Total number of individuals 5 3 5 5 5 5 5 5
10. Proportion of individuals as exotics 5 5 5 5 5 5 5 5
11. Proportion of individuals with disease, tumors,
f in damage and other anomalies 5 5 5 5 5 5 5 5
Total 51 45 49 51 49 51 47 51
크사이트 처리공장에 의한 오염원의 증가로 인하여 IBI 값이 낮아졌다. 또한Oberdorff et al. (1992)이 연구한 프 랑스의 Seine Basin의 경우에서도 하류로 갈수록 산업 화, 댐, 수로화에 의한 교란의 증가로 인하여 IBI 값이 낮게 나왔다. 이와 같이 하류로 갈수록 수질 및 서식지 의 감소로 인하여 IBI 값이 낮아짐을 알 수 있지만 본 조사지역인 평창강의 경우에서는 점 오염원 및 비점 오 염원의 영향이 미약하여 다른 지역의 조사와는 뚜렷하 게 다른 결과를 나타냈다. 그러나 본 조사에서 IBI 값이 낮은 조사지점은 미약하나마 주변의 인위적 활동에 의
한 교란의 결과임이 확인되었다. 총체적으로 평창강 조 사에서 얻은IBI 값과QHEI 값에 따르면 현재까지 평창 강은 하천의 건강도를 잘 유지하고 있음을 확인하였다.
본 평가에서 얻어진 결과는 비록 수계가 다른 이전의 조사 결과와도 비교가 가능하다. 즉 시공간적인 수 환경 의 차이에도 불구하고, 환경의 정량화를 통한 비교 분석 이 가능하다. 급격히 악화되고 있는 한국의 수 환경 상 황에서 본 연구 기법은 현재 하천 상태의 진단 및 과거 결과에 대한 비교 분석이 가능하다는 점에서 수 환경 평가시 하천 건강도를 나타내는 척도로서 이용될 수 있 Fig. 5. Total number of species (A), % insectivores as individuals (B), % omnivores as individuals (C), % sensitive species
(D) and % tolerant individuals (E) in samples against stream orders in Pyong-Chang River
을 것으로 사료된다.
적 요
본 연구에서는 1999년 9월에서 2000년 8월 기간동안 생물 보전지수(Index of Biological Integrity, IBI) 및 질 적 서식지 평가 지수(Qualitative Habitat Evaluation Index, QHEI)를 이용하여 한강수계의 상류에 위치하는 평창강의 건강도를 평가하였다. 조사 결과, 11개 메트릭 을 이용한 평균 IBI 값은 49 (범위: 51~45)로서 Karr (1981)가 제시한 기준에 의거할 때 하천 건강도(Stream Health)는 Good~Excellent 상태 사이에 있었고, 평균 QHEI 값은 88 (범위: 94~76)로서 물리적 서식지측면에 서의 건강도는 최적상태(Comparable to reference) 혹은 생물의 서식에는 적합한 상태(Supporting)를 보였다. 지 점별 IBI 값의 비교에 따르면 상, 하류사이에 미약한 차 이를 보인 반면, 각 조사지점의 QHEI 값은 이용된 변수 특성에 따른 변이를 보였다. 1차 회귀분석 결과에 따르 면, QHEI 값은 하천차수(Stream order)와 유의한 관계 가 없었다(p = 1.8; n = 7). 이러한 결과는 하천차수가 증 가해도 점 오염원의 부재로 인해 서식지에는 큰 변화가 없었기 때문으로 사료되었다. Feed guild 분석에 따르면, 식충성 어류(Insectivore)의 상대 풍부도는 전체 어종의 85.1%를, 잡식성 어류(Omnivore) 및 육식성 어류(Car- nivore)는 각각 전체 어종의 3.5% 및 0.3%를 차지하였 다. 내성도의 경우, 서식지 파괴 및 오염에 쉽게 감소되 는 민감종의 상대 빈도는 75.0%, 내성종은 4.6%로서 뚜 렷한 차이를 보였으며, 도입종(exotics species) 및 비정 상종(anomalies species)의 개체는 채집되지 않았다. 또 한 회귀분석 결과, 지점별 평균IBI값의 변이는QHEI값 의 변화에 의해 57%까지 설명되었다(R2 = 0.57, p⁄0.05, n = 7). 본 조사에서 산정된 개개 메트릭 특성, IBI 값 및 QHEI값의 상호관계에 따르면, 평창강의 현재 수 환경 은 생물 서식에 적절한 상태에서 최적 상태의 범위에 있음이 분명하나, 오염 및 물리적 서식지가 파괴될 경우 감소될 수 있음을 시사하였다.
인 용 문 헌
교육부. 1997. 한국동식물도감. 제37권 동물편(담수어류).
김익수, 강종언. 1993. 원색 한국 어류도감. 아카데미서적. 김범철, 허우명, 황길순. 1995. 도암호의 부영양화 실태. 육수
지28(2): 233-251.
김병만, 이충렬. 1998. 만경강 수계에 서식하는 어류군집에 관
한 연구. 육수지31(3): 191-203.
김준태, 박유라, 조현실, 부성민, 1996. 금강 수계에서 식물플 랑크톤의 군집 구조. 한국육수학회지 29(3): 187-195.
김종선, 함순아, 나철호. 1995. 수서곤충을 이용한 탐진강 수 계의 수질평가. 환생지 13(2): 225-230.
변화근, 최재석, 최준길. 1996. 양양남대천의 어류상과 소하성 어류의 분포 특성. 육수지 29(3): 159-166.
배경석, 박성배. 1992. 한강 중∙하류 지천생태계의 저서성 무 척추동물군집 및 환경요인과의 관계. 육수지 25(1): 41- 57.
배경석. 1993. 곡릉천에서 미소서식지에 따른 저서성 대형무 척추동물의 군집구조와 생태학적 동태. 육수지 26(3):
263-280.
성치남, 백근식, 최지혁, 조현욱, 김종홍. 1997. 주암호 지천의 수질과 어류군집. 육수지30(2): 107-118.
신윤근. 1996. 섬강 상류의 식물플랑크톤상 연구. 육수지 29(3): 143-157.
신재기, 조주래, 황순진, 조경제. 2000. 경안천~팔당호의 부영 양화와 수질오염 특성. 육수지33(4): 387-394.
송호복, 권오길, 전상호, 김취중, 조규송. 1995. 횡성 섬강 상류 의 어류상. 육수지28(2): 225-232.
양홍준, 채병수. 1994. 대도시 주변 하천수계의 수질환경과 육 수생물학적 연구-금호강수계 의 어류상과 어류군집구조. 육수지27(2): 177-188.
양홍준, 채병수, 황수옥. 1997. 임하댐유역의 어류상과 어류군 집구조. 육수지30(2): 145-154.
염동혁, 안광국, 홍영표, 이성규. 2000. 어류군집을 이용한 금 호강의 생물보전지수(Index of Biological Integrity, IBI) 평가. 환생지18(2): 215-226.
윤인길, 김영진, 김성한, 김준현, 권오섭. 1999. 서낙동강 저서 층의 영양염 용출과 환경요인의 영향. 육수지32(1): 1-7.
윤병진, 전태수. 1999. 수영강지류인 석대천에서 깔따구류(파 리목) 군집에 대한 오염의 영향. 육수지32(1): 24-34.
정문기. 1977. 한국어도보. 일지사.
조경제, 신재기, 곽승국, 이옥희. 1998. 담수산Stephanodiscus 속 규조류의 오염지표성 평가. 육수지31(3): 204-210.
최기철, 전상린, 김익수, 손영목. 1990. 원색 한국 담수어 도감. 향문사
최기철. 한국의 민물고기. 서문당. 최기철. 한국의 민물고기 백가지. 현암사.
최신석, 송호복, 황수옥. 1997. 대청호의 어류군집. 육수지 30(2): 155-166.
최준길, 변화근. 1999. 한강 하류역의 어류군집. 육수지32(1):
49-57.
최준길, 변화근, 석형근. 2000. 원주천의 어류군집 동태. 육수 지33(3): 274-281.
허우명, 김범철, 황길순, 최광순, 박원규. 1995. 낙동강 수계의 인, 질소 및 Chl. a농도 분포. 육수지28(2): 175-181.
환경부. 1987. 자연생태계 전국조사 1987 제2차 년도( I ): 담
수어류/수서곤충. pp. 450.
Barbour, M.T., J. Gerritsen, B.D. Snyder, and J.B.
Stribling. 1999. Rapid Bioassessment Protocols for Use in Streams and Wadeable Rivers: Periphyton, Benthic Macroinvertebrates and Fish, Second Edition. EPA 841-B-99-002. U.S. Environmental Protection Agen- cy; Off ice of Water; Washington, D.C.
Bartholow, J.M. 1989. Stream temperature investigations:
field and analytical methods. Instream f low informa- tion pater 13. Biological Report 89 (17). Fish and Wild- life Service, U.S. Department of the Interior, Washin- ton, D.C., USA.
Fausch, K.D., J.R. Karr, and P.R. Yant. 1984. Regional application of an index of biotic integrity based on stream f ish communities. Transactions of the American Fisheries Society 113: 39-55.
Fore, L.S. and J.R. Karr. 1994. Statistical properties of an index of biological integrity used to evaluate water resources. Can. J. Fish. Aqwat. Sci. 51: 1077-1087.
Ganasan, V. and R.M. Hughes. 1998. Application of index of biological integrity (IBI) to fish assemblages of the rivers Khan and Kshipra (Madhya Pradesh). Fresh- water Biology, 40(2), India
Gorman, O.T. and J.R. Karr. 1978. Habitat structure and stream f ish communities. Ecology 59: 507-515.
Gutierrez, M.A.R. 1994. Utilizacion de la Ictiofauna como Indicadora de la Integridad Biotica de los Rios Guachey Guanare, Estado Portuguesa, Venezuela, pp. 1-40. M.
Sc. thesis, Universidad Nacional Experimental de los Llanos Occidentales “Ezequiel Zamora”, Guanare, Venezuela.
Hamilton, K. and E.P. Bergersen. 1984. Methods to esti- mate aquatic habitat variables. Environmental evalua- tion project N. DPTS-35-9. pp. 1-30. Bureau of Recla- mation, denver Federal Center, Denver, CO. USA.
Harris, J.H. 1995. The use of f ish in ecological assess- ments. Australian Journal of Ecology 20: 65-80.
Hocutt, C.H., P.N. Johnson, C. Hay, and B.J. VanZyl. 1994.
Biological basis of water quality assessment: the Ka- vango River, Namibia, Reviews Hydrobiologie Tropical 27: 361-384.
Hugueny, B., S. Camara, B. Samoura, and M. Magassouba.
1996. Applying an index of biotic integrity based on f ish assemblages in a West African river. Hydrobiologia 331: 71-78.
Karr, J.R. 1981. Assessment of biotic integrity using f ish communites. Fishieries 6: 21-27.
Karr, J.R., K.D. Fausch, P.L. Angermeier, P.R. Yant, and I.J. Schlosser. 1986. Assessing biological integrity in
running waters: A method and its rationale. Illinois Natural History Survey, Special Publication 5, pp. 28.
Karr, J.R. 1991. Biological integrity: A long-neglected aspect of water resource management. Ecological Applications 1: 66-84.
Karr, J.R. 1999. Defining and measuring river health.
Freshwater Biology 41: 221-234.
Karr, J.R. 2000. Health, integrity, and biological assess- ment: The importance of measuring whole things.
Ecolgical integrity: Integrating Environment, Conser- vation, and Health. Washington, DC: Island Press, pp.
209-226.
Koizumi, N. and Y. Matsumiya. 1997. Assessment of stream fish habitat on index of biotic integrity. 수산해 양연구61(2): 144-156.
Lafferty, B. 1987. A procedure for evaluating buffer strips for stream temperature protection under the Forest Practices Act. pp. 70-77. In: Managing Oregon’s ripari- an zone for for timber, f ish and wildlife. Technical Bulletin No. 514. National Council for Air and Stream Improvement, New York, N.Y., USA.
Leonard, P.M. and D.J. Orth. 1986. Application and testing of an index of biotic integrity in small, coolwater stre- ams. Transactions of the American Fisheries Society 115: 401-414.
Lyons, J., S. Navarro-Perez, P.A. Cochran. 1995. Index of biotic integrity based on f ish assemblages for the con- servation of streams and rivers in West-Central Mexi- co. Conservation Biology 9(3): 569-584.
Lyons, J. and L. Wang. 1996. Development and Validation of an index of biotic integrity for coldwater streams in Wisconsin. American Journal of Fisheries Management 16: 241-256.
Oberdorff, T. and R.M. Hughes. 1992. Modification of an index of biotic integrity based on f ish assemblages to characterize rivers of the Seine Basin, France. Hydro- biologia 228: 117-130.
Oberdorff, T. and J.P. Porcher. 1994. An index of biotic integrity to assess biological impacts of salmonid farm eff luents on receiving waters. Aquaculture 119: 219- 235.
Ohio EPA. 1989. Biological criteria for the protection of aquatic life. Vol. III, Standardized biological field asse- ssment of Ohio surface waters. Division of Water Qua- lity Monitoring and Assessment, Surface Water Sec- tion, Columbus. OH.
Plafkin, J.L., M.T. Barbour, K.D. Porter, S.K. Gross, and R.M. Hughes. 1989. Rapid assessment protocols for use in streams and rivers: binthic macroinvertebrats and
fish, EPA/444/4-89-001, Office of Water Regulations and Standards, U.S. EPA, Washington, DC, USA.
Sanders, R.E., R.J. Miltner, C.O. Yoder, and E.T. Rankin.
1999. The use of external deformities, erosion, lesions and tumors (DELT anormalies) in f ish assemblages for characterizing aquatic resources: A case study of seven Ohio streams. In Assessing the sustainability and bio- logical integrity of water resources using fish communi- ties (TP Simon ed). CRC Press LLC.
Steedman, R.J. 1988. Modification and assessment of an index of biotic integrity to quantify stream quality in Southern Ontario. Can. J. Fish. Aqwat. Sci. 45: 492- 501.
Shields, F.D., Jr., S.S. Knight, and C.M. Cooper. 1995. Use of the index of biotic integrity to assess physical habitat degradation in warmwater streams. Hydrobiologia 312:
191-208.
U.S. EPA. 1983. Technical support manual: waterbody surveys and assessment for conducting use attaina- bility analyss. Office of Water Regulations and Stan- dards, U.S. EPA, Washington, D.C., USA.
U.S. EPA. 1988. WQS draft framework for the water quality program. Draft 11-8-88. Office of Water, U.S.
EPA, Washinton, D.C., USA.
U.S. EPA. 1991. Technical support document for water quality-based toxic control. EPA 505-2-90-001. U.S.
EPA, Office of Water, Washington, D.C., USA.
U.S. EPA. 1993. Fish field and laboratory methods for evaluation the biological integrity of surface waters.
EPA 600-R-92-111. Enviornmental Monitoring sys- tems Laboratory-cincinnati office of Modeling, Moni- toring systems and quality assurance Off ice of Rese- arch Development, U.S. EPA, Cincinnati, Ohio 45268.
Van Putten, M. 1989. Issues in applying water quality criteria. Water quality standards for the 21st century.
Office of Water, United States Environmental Protec- tion Agency, Washington, D.C. USA, pp. 175-177.
Wang, L., J. Lyons, P. Kanehl, and R. Gatti. 1997. Inf luen- ces of watershed land use on habitat quality and biotic integrity in Wisconsin streams. Fisheries 22(6): 6-12.
(Received 13 Jul. 2001, Manuscript accepted 25 Aug. 2001)