Received: February 21, 2020 Revised: April 30, 2020 Accepted: June 7, 2020
OPEN ACCESS
HORTICULTURAL SCIENCE and TECHNOLOGY 38(4):429-439, 2020
URL: http://www.hst-j.org pISSN : 1226-8763 eISSN : 2465-8588
This is an Open Access article distributed under the terms of the Creative Commons Attribution Non-Commercial License which permits unrestricted non-commercial use, distribution, and reproduction in any medium, provided the original work is properly cited.
Copyrightⓒ2020 Korean Society for Horticultural Science.
This experiment was funded by Natural science project of scientific research plan of universities in Xinjiang Uygur Autonomous Region ‘Study on the relationship between carbohydrate assimilation and distribution and leaf fruit ratio of walnut’ (XJEDU2019Y016).
Comprehensive Decision-Making for the Leaf-to-Fruit Ratio and Estimation of Economic Output Value of Walnut Trees Based on Statistical Analyses
Cuifang Zhang, Cunde Pan*, Hong Chen, and Shiwei Wang
College of Forestry and Horticulture, Xinjiang Agricultural University & Key Laboratory of Forestry Ecology and Industry Technology in Arid Region, Education Department of Xinjiang, No.311 Nongdadong Rd., Urumqi, 830052, Xinjiang, P. R. China
*Corresponding author: [email protected]
Abstract
This study examined the Juglans regia ‘Xinxin2’ walnut variety using combined field control experiments with laboratory chemical analyses and analyzed the effects of the relationships among net photosynthetic rate (Pn), specific mass transfer rate (SMTR), nut dry mass (NDM), and nut yield per girdled fruit-bearing shoot (Yield) on the leaf-to-fruit ratio (LFR). We used comprehensive decision-making based on mathematical programming to determine the optimal LFR for this walnut variety in the peak fruiting stage. The optimal LFR was calculated as the comprehensive expected value of the linear combination among the equations for the effects of LFR on the Pn, SMTR, NDM, and Yield and was determined to be 2.02. Compared with walnut plants without LFR adjustment, the walnut plants with LFR adjustment using 2.02 as the minimum threshold had a 19.52% lower nut yield, a higher nut quality (Special Class, Class I, and Class II accounted for 100% of the nut yield per 670 m2), and a 36.22% higher economic output value per 670 m2. This study indicates that improving fruit quality to produce Grade I and II nuts will increase economic output, although the total yield will decrease when managing efficient LFR in nut production.
Additional key words: artificial manipulation, regression analysis, residual analysis, source-sink relationship
Introduction
The production efficiency of fruit trees is determined by their assimilation, transport, and utilization of carbohydrates (Lenz, 1979). Furthermore, fruit tree yield and fruit quality are dependent on the interactions between its sources and sinks (Peng et al., 2012). The regulation of source-sink relationships, usually the leaf-to-fruit ratio (LFR), essentially involves regulating the equilibrium between vegetative growth and reproductive growth by controlling the partitioning of carbohydrates (Lakso and Flore, 2003). Some studies have shown that an excessively high fruit load may decrease the sugar content of fruits, the growth and viability of the root system, the maturity of new shoots, and the germination rate in the second year (Lou, 2005). However, excessive fruit thinning leads to excessive sprouting and overgrowth of summer shoots, aggravates the contradiction in nutrient partitioning between
shoots and fruits, increases the tendency for fruit shedding, and eventually causes a decline in fruit tree yields (Li, 2008).
Therefore, to achieve high-yield and high-quality production in fruit trees, it is necessary to determine a reasonable load for fruit trees. In addition, it is important to determine what types of source-sink relationships can accelerate the assimilation, transport, and utilization of carbohydrates to the greatest extent and what relationships can improve the yield of fruit trees and fruit quality.
Previous studies on source-sink relationships have mainly focused on their effects on aspects such as the photosynthetic characteristics of leaves (Iglesias et al., 2002; Urban et al., 2004; Bustan et al., 2011, 2016; Bobeica et al., 2015;
Moscatello et al., 2017) and fruit quality (Famiani et al., 2000; Guo et al., 2009; Haouari et al., 2013). Current reasonable loads for certain tree varieties are based on what happens during cultivation and management, which lacks a scientific basis with rigorous quantification.
Therefore, this study examined the Juglans regia ‘Xinxin2’ walnut variety using artificial LFR manipulation to analyze the net photosynthetic rate (Pn) of leaves, the specific mass transfer rate (SMTR) of carbohydrates in the carpopodium, the nut dry mass (NDM), and the nut yield of girdled fruit-bearing shoots with different LFRs. A comprehensive decision- making method using linear mathematical programming was applied to determine the optimal LFR threshold for J. regia
‘Xinxin2’ during the peak fruiting stage.
Materials and Methods
Experimental Site and Plant Materials
This study was carried out in a walnut orchard located in Southern Xinjiang, China (41°11'06.31"-41°12'47.74"N, 79°12'12.76"-79°13'57.87"E; 1,394 masl). The experimental site has a mild, arid climate with a mean annual temperature of 9.4°C and an average rainfall of 91.5 mm. Uniform 10-year-old walnut trees (Juglans regia L. ‘Xinxin2’) planted at a distance of 5 m × 6 m in the east-west direction were used in this study.
Sink-Source Manipulation
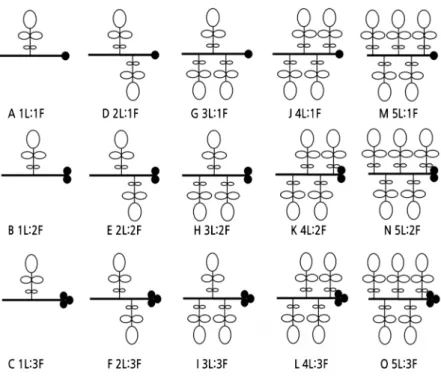
After fruit set, defoliation, girdling, and defruiting were performed on 150 sun-exposed shoots with fully expanded leaves and developing fruit in the south of 10 trees. Fifteen shoots were treated with 15 LFRs (1L:1F, 1L:2F, 1L:3F, 2L:1F, 2L:2F, 2L:3F, 3L:1F, 3L:2F, 3L:3F, 4L:1F, 4L:2F, 4L:3F, 5L:1F, 5L:2F, 5L:3F) per tree (Fig. 1). Three single-tree replications per ratio were selected for determination of carbohydrate assimilation rate. The remaining seven trees were sampled to measure the carbohydrate transport rate and utilization.
Determination of Net Photosynthetic Rate (Pn)
Pn was used to express carbohydrate assimilation rate. During growing seasons, Pn was measured between 11:00 and 13:00 per day, 7 d, 22 d, 52 d, 82 d, and 107 d after LFR regulation (30 d, 45 d, 75 d, 105 d, 130 d after full bloom of female flowers). Two fully developed leaves per LFR close to the fruit were placed in the leaf chamber to measure Pn (µmol CO2/m2·s-1) using a portable photosynthesis system (LI-6400XT, LI-COR, USA).
Fig. 1. Different leaf-to-fruit ratio manipulations on the girdled shoots of J. regia ‘Xinxin2’ walnut.
Determination of Specific Mass Transfer Rate (SMTR)
SMTR was used to express carbohydrate transport rate. The carpopodium per LFR was sampled on 7 d and 107 d after LFR regulation and dipped into fixation solution [70% (φ) ethanol:formaldehyde:glacial acetic acid = 90:5:5] to prepare the paraffin sections. The carpopodium samples were embedded in paraffin and sliced following the protocol of Willey (1971). The section cutting, examination and measurements, and photographing were performed using a rotary microtome (Leica Microsystems RM2265) and a digital camera (DFC495) with image recording, and AutoCAD 2014 was used to process the photos to calculate the phloem area (PA). The procedures were performed in triplicate for each LFR treatment, and five fields of view were observed for each repeat.
Reference was made to the calculation methods for SMTR in Li Hesheng’s “Modern Plant Physiology” (2012).
× ×
(1)
where SMTR is measured in g·cm-2·h-1, M1 is the mass of dried fruit measured at 7 d after LFR regulation (g), M2 is the mass of dried fruit measured at 107 d after LFR regulation (g), PA is the average of the cross-sectional area of carpopodium phloem between the two measurements (cm2), and T is the time interval between the two measurements (d).
Determination of Nut Dry Mass (NDM)
At the mature stage, five fruits on the girdled shoots per LFR were peeled off the green skin, dehydrated in an electric thermostatic air-drying oven (DHG–9240A) at 105°C for 30 min, and then dried at 70°C to a constant weight to measure the nut dry mass (NDM).
Regression Analysis
We performed a positive square root transformation on carpopodium SMTR (Sqrt SMTR). Linear functions (y = ax + b), quadratic functions (y = ax2 + bx + c), and cubic functions (y = ax3 + bx2 + cx + d) were then employed to establish the regression equations of the LFR effects, whereby the LFR represented the independent variable (x) and the Pn mean at 45, 70, 90, 110, and 130 d after walnut flowering, Sqrt SMTR, and NDM represented the dependent variables (y).
Residual Analysis
To test whether the effect regression equations constructed using the statistical method above were accurate, the χ2 test, Durbin-Watson (DW) test, and Levene¢s (W) test were performed on the residuals of the regression equations (eij = yij – ŷij) to test their normal distribution, independence, and homogeneity of variance. If the residuals of a regression equation passed the residual normal distribution, independence (without first-order autocorrelation), and homogeneity of variance tests, the hypothesized regression equation was determined to be accurate.
Regression Analysis and Residual Analysis of Yield Effect of LFR
Based on the effect of effective LFR on NDM, the yield effect relationship of nuts per plant based on LFR was designed:
Yi = Ai × Wi × Ni × 450 (2)
where Yi denotes the nut yield of the girdled shoots with an LFR of i (g); Ai denotes the percentage of girdled shoots with an LFR of i among the total number of shoots (%); Wi denotes NDMi, obtained by substituting the LFRi into the regression equation between LFR and NDM (g); Ni denotes the actual number of fruits on the girdled shoots when the LFR is i; and 450 denotes the average number of shoots on a single walnut tree based on a survey of 60 walnut trees aged 12a in a natural state.
The Yield calculated by the above equation was first transformed into LngammaYield, whereby the LFR represented the independent variable (x) and LngammaYield represented the dependent variables (y) and refer to the above methods to establish regression relationship and carry out residual analysis.
Establishing and Solving the LFR Comprehensive Decision-Making Objective Function
To determine the optimal LFR of girdled walnut shoots and maximize its comprehensive expected value for Pn, SMTR, NDM, and Yield effects, the linear combination of the Pn, SMTR, NDM, and Yield effect relationships for J. regia
‘Xinxin2’ LFR served as the objective function. The maximum solutions reached by the single expected values for LFR effects on Pn, SMTR, NDM, and Yield were set as the constraints. The maximum solutions reached by the single expected values for LFR effects on Pn, SMTR, NDM, and Yield and the maximum solution reached by the comprehensive expected value (objective function) were then substituted back into the four effect relationships, respectively, to test the validity of the solutions sought by the objective function under the constraints and to determine the optimal LFR.
Comprehensive Decision-Making for the Optimal LFR
Based on the effect relationships between the LFR of girdled shoots and walnut NDM, we estimated the nut yield and economic output value per unit area (670 m2), adjusted by the different LFRs, to determine the optimal walnut LFR.
Results
Regression Equations of LFR Effects on Pn, SMTR, and NDM
The results of regression analysis showed that the regression relationship between Pn/SMTR/NDM and LFR could be reflected by linear functions (y = ax + b), quadratic functions (y = ax2 + bx + c), and cubic functions (y = ax3 + bx2 + cx + d). However, the degrees of fit (R2) of the effect relationships established using the cubic function were the highest, at
Table 1. Regression relationship between leaf-to-fruit ratio and Pn, SMTR, and NDW of J. regia ‘Xinxin2’ walnut Dependent variablez Functional relationship Fitting degree (R2) Regression relationship
Pn
Linear function 0.163Pn = 0.590LFR + 10.485
Quadratic function 0.733 Pn = -0.791LFR2 + 4.608LFR + 7.066
Cubic function 0.735 Pn = 0.040LFR3 - 1.097LFR2 + 5.231LFR + 6.758
Sqrt SMRT
Linear function 0.192 Sqrt SMRT = 0.092LFR + 1.349
Quadratic function 0.569 Sqrt SMRT = -0.093 LFR2 + 0.563LFR + 0.948
Cubic function 0.713Sqrt SMRT = 0.048LFR3 - 0.462LFR2 + 1.314LFR + 0.578
NDM
Linear function 0.883NDM = 1.961LFR + 6.984
Quadratic function 0.918 NDM = -0.279LFR2 + 3.379LFR + 5.777
Cubic function 0.922 NDM = 0.073LFR3 - 0.842LFR2 + 4.525LFR + 5.211
zPn represents net photosynthetic rate; SMRT represents specific mass transfer rate; NDM represents the nut dry mass.
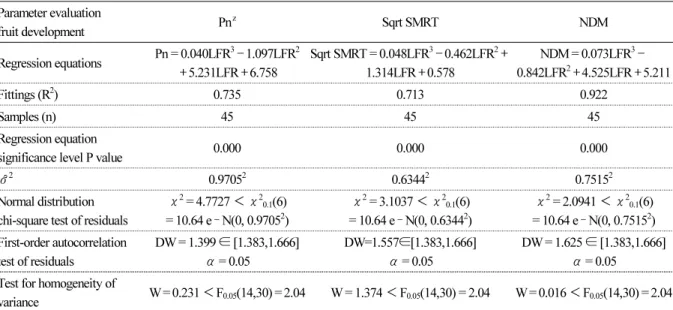
Table 2. Residual test of the regression relationship between leaf fruit ratio and Pn, SMTR, and NDW of J. regia ‘Xinxin2’
walnut
Parameter evaluation
fruit development Pnz Sqrt SMRT NDM
Regression equations Pn = 0.040LFR3-1.097LFR2
+5.231LFR+6.758
Sqrt SMRT = 0.048LFR3-0.462LFR2+ 1.314LFR+0.578
NDM = 0.073LFR3- 0.842LFR2+4.525LFR+5.211
Fittings (R2) 0.735 0.713 0.922
Samples (n) 45 45 45
Regression equation
significance level P value 0.000 0.000 0.000
σ̂2 0.97052 0.63442 0.75152
Normal distribution
chi-square test of residuals χ2 = 4.7727 < χ20.1(6)
= 10.64 e ‑ N(0, 0.97052) χ2 = 3.1037 < χ20.1(6)
= 10.64 e ‑ N(0, 0.63442) χ2 = 2.0941 < χ20.1(6)
= 10.64 e ‑ N(0, 0.75152) First-order autocorrelation
test of residuals
DW = 1.399 ∈ [1.383,1.666]
α = 0.05
DW=1.557∈[1.383,1.666]
α = 0.05
DW = 1.625 ∈ [1.383,1.666]
α = 0.05 Test for homogeneity of
variance W = 0.231 < F0.05(14,30) = 2.04 W = 1.374 < F0.05(14,30) = 2.04 W = 0.016 < F0.05(14,30) = 2.04
zPn represents net photosynthetic rate; SMRT represents specific mass transfer rate; NDM represents the nut dry mass.
0.735, 0.713, and 0.922, respectively, which indicated that the cubic equation could more accurately reflect the relationship between Pn/SMTR/NDM and LFR (Table 1).
Residual Analysis for the Regression Equations of LFR Effects on Pn, SMTR, and NDM
We analyzed the residuals eij (i = 1, 2, 3, ……, 15; j = 1, 2, and 3) of the effect equation established with LFR as the independent variable (x) and Pn, SMTR, and NDM as the dependent variables (y) (Table 2). The results showed that the χ2 values of the normal distribution χ2 test for the residuals of the regression equations regarding the LFR effects on Pn, SMTR, and NDM were 4.7727, 3.1037, and 2.0941, respectively. These values were all smaller than χ20.1(6) = 10.64, which suggested that the residuals eij were subject to a normal distribution, i.e., e ‑ N (0, 0.97052), e ‑ N (0, 0.63442), and e ‑ N (0, 0.75152), respectively. When the sample size was 45, the number of variables was 3, and the significance level was α = 0.05, the DW values of the residual independence Durbin-Watson (DW) test were 1.399, 1.557, and 1.625, respectively. These values were all within the range of [1.383,1.666], suggesting that the residuals were mutually independent without first-order autocorrelation. The W values of the residual homogeneity of variance Levene¢s (W) test were 0.231, 1.374, and 0.016, respectively. These values were all smaller than F0.05(14,30) = 2.04, which suggested that the residual variance was not significant and showed homogeneity of variance. The test results indicated that the effects of LFR on Pn, SMTR, and NDM could be accurately determined using the cubic function relationship.
Residual Analysis for the Regression Equations of LFR Effects on Yield
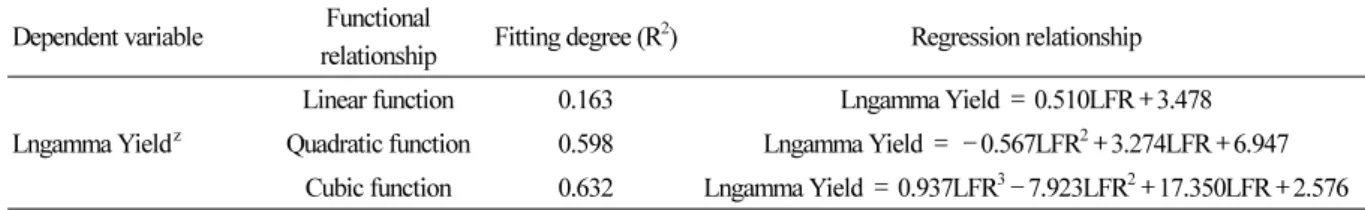
The regression analysis revealed that the degrees of fit (R2) of the effect relationships established using the cubic function for the effects of LFR on Lngamma Yield were the highest, at 0.632 (Table 3). Residual analysis results (Table 4)
Table 3. Regression relationship between leaf-to-fruit ratio and Lngamma Yield of J. regia ‘Xinxin2’ walnut (n = 45) Dependent variable Functional
relationship Fitting degree (R2) Regression relationship
Lngamma Yieldz
Linear function 0.163Lngamma Yield = 0.510LFR+3.478
Quadratic function 0.598 Lngamma Yield = -0.567LFR2+3.274LFR+6.947 Cubic function 0.632 Lngamma Yield = 0.937LFR3-7.923LFR2+17.350LFR+2.576
zYield represents nut yield of a single tree.
Table 4. Residual test of the regression relationship between leaf fruit ratio and Lngamma Yield of J. regia ‘Xinxin2’ walnut Parameter evaluation fruit development Lngamma Yieldz
Regression equations Lngamma Yield = 0.937LFR3-7.923LFR2+17.350LFR+2.576
Fittings (R2) 0.632
Samples (n) 45
Regression equation significance level p value 0.021
σ̂2 5.91782
Normal distribution chi-square test of residuals χ2 = 7.6349 < χ20.1(6) = 10.64 e ‑ N(0, 5.91782) First-order autocorrelation test of residuals DW = 1.624 ∈ [1.383,1.666] α = 0.05
Test for homogeneity of variance W = 1.07 < F0.05(14,30) = 2.04
zYield represents nut yield of a single tree.
showed that the residuals of the regression relationship between LFR and Lngamma Yield effect were distributed normally, independent of each other, and showed homogeneity of variance.
Establishing and Solving the Objective Function of Comprehensive Decision-Making for LFR To determine the optimal LFR of the girdled walnut shoot and maximize the comprehensive expected value of its effects on Pn, SMTR, NDM, and Yield, the linear combination of the equations with respect to the LFR effects on Pn, SMTR, NDM, and Yield served as the objective function:
Max: Z = 1.098LFR3-10.324LFR2 + 28.420LFR + 15.123 (3)
The maximum solutions reached by single expected values for the effects of LFR on Pn, SMTR, NDM, and Yield (Table 5) were used as the constraints for the objective function: 1.50 ≤ LFR ≤ 5 and the solution given by programming was LFR = 2.02.
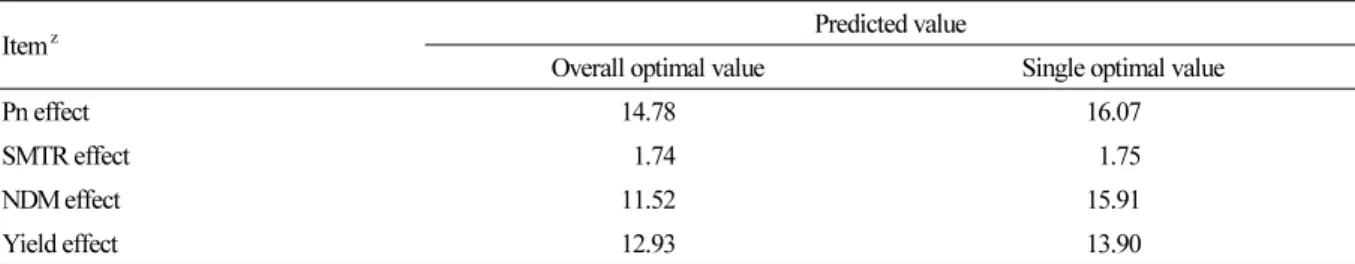
Validity Test of Comprehensive Optimal LFR
The maximum solutions reached by the single expected values of the LFR effects on Pn, SMTR, NDM, and Yield (Table 5) (LFR = 3.35, LFR = 2.13, LFR = 5.00, and LFR = 1.5) and the maximum solution (LFR = 2.02) reached by the comprehensive expected value (objective function) were substituted back into the four effect regression equations,
Table 5. Optimal LFR of single-effect regression equation of J. regia ‘Xinxin2’ walnut
Itemz Single optimal LFR
Effect regression equation of net photosynthesis rate
Pn = 0.040LFR3-1.097LFR2+5.231LFR+6.758 3.35
Effect regression equation of specific mass transport rate
Sqrt SMRT = 0.048LFR3-0.462LFR2+1.314LFR+0.578 2.13
Effect regression equation of nut dry weight
NDM = 0.073LFR3-0.842LFR2+4.525LFR+5.211 5.00
Effect regression equation of nut yield of single tree
Lngamma Yield = 0.937LFR3-7.923LFR2+17.350LFR+2.576 1.50
zPn represents net photosynthetic rate; SMRT represents specific mass transfer rate; NDM represents the nut dry mass; Yield represents nut yield of a single tree.
Table 6. Validity test of optimum leaf-to-fruit ratio of J. regia ‘Xinxin2’ walnut
Itemz Predicted value
Overall optimal value Single optimal value
Pn effect 14.78 16.07
SMTR effect 1.74 1.75
NDM effect 11.52 15.91
Yield effect 12.9313.90
zPn represents net photosynthetic rate; SMRT represents specific mass transfer rate; NDM represents the nut dry mass; Yield represents nut yield of a single tree.
respectively. When LFR = 2.02, the predicted values of the different indicators were within the allowable range and not significantly different from the single optimal values (Table 6), which suggested that the solution given by the objective function and the constraints was valid.
Estimation of Walnut Yield and the Economic Output Value per Unit Area Based on LFR An equation for walnut yield per unit area of girdled shoots under different LFRs was designed:
Yi = Ai × Wi × Ni × 450 × 22 (4)
where Yi, Ai, Wi, and Ni were the same as the above formula, and 22 denotes the number of walnut trees per unit area (670 m2) at a row spacing of 5 × 6 m.
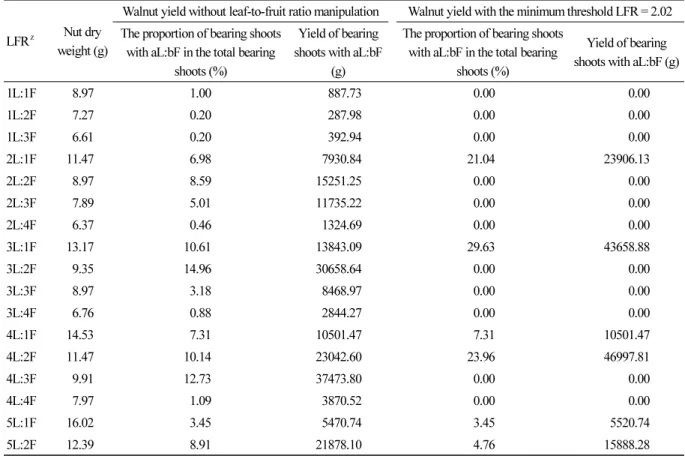
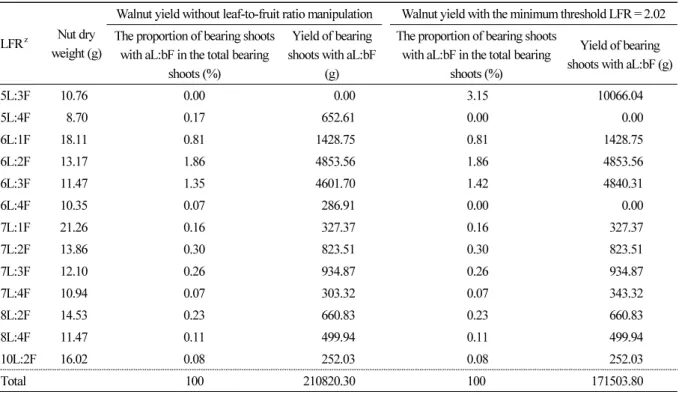
In terms of nut yield, we calculated the nut yield without leaf-to-fruit ratio manipulation according to the formula (4) above, and the nut yield of all the bearing shoots in a natural state was 210.82 kg. We also calculated the nut yield with the minimum threshold LFR = 2.02. We put LFR ≥ 2 into the formula (4) to calculate the nut yield, and tried to adjust LFR
< 2 to 2 by removing the fruit. If the LFR could not be adjusted, it would not be put into the formula (4). Finally, we got the nut yield when the minimum threshold LFR = 2.02 was 171.50 kg. Compared with the nut yield per unit area of walnut trees with unadjusted LFRs, the nut mass per unit area adjusted by the minimum LFR threshold (LFR = 2.02) declined by 19.52% (Table 7).
Table 7. Prediction of nut yield per unit area of walnut based on leaf-to-fruit ratio of J. regia ‘Xinxin2’ walnut
LFRz Nut dry weight (g)
Walnut yield without leaf-to-fruit ratio manipulation Walnut yield with the minimum threshold LFR = 2.02 The proportion of bearing shoots
with aL:bF in the total bearing shoots (%)
Yield of bearing shoots with aL:bF
(g)
The proportion of bearing shoots with aL:bF in the total bearing
shoots (%)
Yield of bearing shoots with aL:bF (g)
1L:1F 8.97 1.00 887.73 0.00 0.00
1L:2F 7.27 0.20 287.98 0.00 0.00
1L:3F 6.61 0.20 392.94 0.00 0.00
2L:1F 11.47 6.98 7930.84 21.04 23906.13
2L:2F 8.97 8.59 15251.25 0.00 0.00
2L:3F 7.89 5.01 11735.22 0.00 0.00
2L:4F 6.37 0.46 1324.69 0.00 0.00
3L:1F 13.17 10.61 13843.09 29.63 43658.88
3L:2F 9.35 14.96 30658.64 0.00 0.00
3L:3F 8.97 3.18 8468.97 0.00 0.00
3L:4F 6.76 0.88 2844.27 0.00 0.00
4L:1F 14.53 7.31 10501.47 7.31 10501.47
4L:2F 11.47 10.14 23042.60 23.96 46997.81
4L:3F 9.91 12.73 37473.80 0.00 0.00
4L:4F 7.97 1.09 3870.52 0.00 0.00
5L:1F 16.02 3.45 5470.74 3.45 5520.74
5L:2F 12.39 8.91 21878.10 4.76 15888.28
In terms of nut quality, we graded the walnuts with unadjusted LFR according to the classification standards of the national Walnut Quality Grades (GB/T20398—2006). For the total nut mass per unit area, the mass of Grade III nuts (nut mass ≤ 10 g) accounted for 39.46%, the mass of Grade II nuts (10 g < nut mass ≤ 12 g) accounted for 36.45%, and the mass of Grade I nuts (nut mass > 12 g) accounted for 24.09%. We also graded the nuts of walnut trees with the minimum threshold LFR = 2.02, and in the total nut mass per unit area, the mass of Grade III nuts accounted for 0%, the mass of Grade II nuts accounted for 50.52%, and the mass of Grade I nuts accounted for 49.48% (Table 8).
In the terms of economic benefits, based on a market survey, the purchase price of Grade III nuts was 1.56 $·kg-1 , the purchase price of Grade II nuts was 2.26 $·kg-1, the purchase price of Special Grade and Grade I nuts was 3.11 $·kg-1, and the labor cost adjusted based on the LFRs of 22 walnut trees was 42.40 $ (21.20 $/person/d× 2 d). Compared with the economic output value per unit area of walnut trees with an unadjusted LFR, the economic output value per unit area of walnut trees adjusted by the minimum LFR threshold (LFR = 2.02) increased by 36.22% (Table 8).
Table 7. Prediction of nut yield per unit area of walnut based on leaf-to-fruit ratio of J. regia ‘Xinxin2’ walnut (Continued)
LFRz Nut dry weight (g)
Walnut yield without leaf-to-fruit ratio manipulation Walnut yield with the minimum threshold LFR = 2.02 The proportion of bearing shoots
with aL:bF in the total bearing shoots (%)
Yield of bearing shoots with aL:bF
(g)
The proportion of bearing shoots with aL:bF in the total bearing
shoots (%)
Yield of bearing shoots with aL:bF (g)
5L:3F 10.76 0.00 0.00 3.15 10066.04
5L:4F 8.70 0.17 652.61 0.00 0.00
6L:1F 18.11 0.81 1428.75 0.81 1428.75
6L:2F 13.17 1.86 4853.56 1.86 4853.56
6L:3F 11.47 1.35 4601.70 1.42 4840.31
6L:4F 10.35 0.07 286.91 0.00 0.00
7L:1F 21.26 0.16 327.37 0.16 327.37
7L:2F 13.86 0.30 823.51 0.30 823.51
7L:3F 12.10 0.26 934.87 0.26 934.87
7L:4F 10.94 0.07 303.32 0.07 343.32
8L:2F 14.53 0.23 660.83 0.23 660.83
8L:4F 11.47 0.11 499.94 0.11 499.94
10L:2F 16.02 0.08 252.03 0.08 252.03
Total 100 210820.30 100 171503.80
zLFR represents leaf-to-fruit ratio.
Table 8. Economic output value prediction of walnut unit area based on leaf and fruit ratio of J. regia ‘Xinxin2’ walnut Forecast index Walnut without leaf-to-fruit ratio manipulation Walnut with the minimum threshold LFR = 2.02
Yield per unit area (kg) 210.82 171.50
Nut quality of Grade Ⅰ (kg) 50.79 84.85
Nut quality of Grade Ⅱ (kg) 76.84 86.65
Nut quality of Grade Ⅲ (kg) 83.19 0.00
Economic output value ($) 307.45 461.21
Labor cast ($) 0.00 42.40
Discussion
Assimilation and partitioning of carbohydrates play decisive roles in the growth and development of fruit trees and the formation of their economic yield (Li et al., 2007). The production efficiency of fruit trees as solar energy collectors depends on their receipt and transformation of light energy and their subsequent transport, storage, and utilization of carbohydrates (David, 1985). To increase the yield of fruit trees, this series of processes must be accelerated to the greatest extent during the cultivation and management of the trees. Carbohydrate partitioning is influenced by the supply capacity of the sources, the competitive capacity of the sinks, and the carbohydrate transport capacity of the phloem. In the cultivation and management practices of fruit trees, fruit growers may attempt to adjust the equilibrium of carbohydrate partitioning between vegetative growth and reproductive growth in fruit trees by artificially manipulating their source-sink relationships to guarantee fruit tree yields and fruit quality (Tuo, 2015). Therefore, it is necessary to determine an LFR range that is suitable for the growth and development of fruit trees based on the characteristics of carbohydrate assimilation and partitioning (transport and utilization) in walnut trees.
Our results demonstrated that an LFR of 2.02 in girdled fruit-bearing shoots resulted in high levels of leaf Pn, pedicel SMTR, NDM, and Yield. Therefore, the assimilation of carbohydrates in leaves, the transport of carbohydrates in the phloem of the pedicel, and the utilization of carbohydrates in sink fruits all reached high levels under an LFR of 2.02. In contrast, the carbohydrates reached high levels in only one or two of the three processes of assimilation, transport, and utilization under the other LFRs. Hence, the optimal LFR that can promote the assimilation and partitioning of carbohydrates in walnut trees was determined to be 2.02.
In our study, the optimal LFR was obtained by determining the regression equations with respect to the effects of LFR on Pn, SMTR, NDM, and Yield, followed by their linear combination. Previous studies mainly focused on the relationship between LFR and photosynthesis and fruit quality but rarely on how to determine the optimal LFR, and the determination of the optimal LFR was mainly based on the fruit quality. Determining the optimal LFR in this study was based on the assimilation, transport, and utilization of carbohydrates and is thus not only a more scientifically reasonable method of calculating the LFR, but is also expected to better reflect the essential role of LFR in regulating the yield of fruit trees and fruit quality.
Our results also showed that by performing the LFR adjustment of walnut trees using the maximum solution of the optimal LFR reached by the comprehensive expected value (LFR = 2.02) as the minimum criterion, and following the principle of retaining the leaves and removing the fruits, the yield per unit area was 19.52% lower than LFR unadjusted walnut trees (i.e., using the minimum LFR = 2.02), but the fruit quality was improved. The mass of nuts classified as Special Grade, Grade I, and Grade II accounted for 100% of the total nut yield per unit area, and the economic output value per unit area increased by 36.22%. This study indicates that improving fruit quality to produce Grade I and II nuts will increase economic output but decrease total yield in managing efficient LFR in nut production.
Literature Cited
Bobeica N, Poni S, Hibert G, Renaud C, Gomès E, Delrot S, Dai Z (2015) Differential response of sugar, organic acids and anthocyanins to source-sink modulation in Cabernt Sauvignon and Sangiovese grapevines. Fron Plant Sci 6:382. doi:10.3389/fpls.2015.00382 Bustan A, Avni A, Lavee I, Zipori I (2011) Role of carbohydrate reserves in yield production of intensively cultivated oil olive (Olea europaea
L.) trees. Tree Physiol 485:546-554. doi:10.1093/treephys/tpr036
Bustan A, Dag A, Yermiyahu U, Erel R, Presnov E, Agam N, Kool D, Lwema J, Zipori K, et al. (2016) Fruit load governs transpiration of olive trees. Tree Physiol 36:380-391. doi:10.1093/treephys/tpv138
David ER (1985) Walnut orchard management. Division of Agriculture and Natural Resources University of California, Oakland, CA, USA, p 112
Famiani F, Proietti P, Palliotti A, Ferranti F, Antognozzi E (2000) Effects of leaf to fruit ratios on fruit growth in chestnut. Sci Hortic 85:145-152. doi:10.1016/s0304-4238(99)00132-6
Guo HX, Cheng LL, Lakso A, Goffinet M (2009) Effects of nitrogen supply on source-sink balance and fruit size of ‘Gala’ apple trees. J Am Soc Hortic Sci 134:126-133. doi:10.21273/JASHS.134.1.126
Haouari A, Marie-Christine VL, Steppe K, Mariem FB, Braham M, Chaieb M (2013) Fruit thinning affects photosynthetic activity, carbohydrate levels, and shoot and fruit development of olive trees grown under semiarid conditions. Funct Plant Biol 40:1179-1186.
doi:10.1071/FP13094
Iglesias DJ, Ignacio L, Francisco RT, Manuel T (2002) Regulation of photosynthesis through source: sink imbalance in citrus is mediated by carbohydrate content in leaves. Physiol Plant 116:563-572. doi:10.1034/j.1399-3054.2002.1160416.x
Lakso AN, Flore JA (2003) Concise encyclopedia of temperate tree fruit. Food Products Press, New York, USA, pp 21-30
Lenz F (1979) Sink-source relationships in fruit trees. In TK Scott (ed). Plant Regulation and World Agriculture. Springer, Boston, MA, USA, pp 141-153. doi:10.1007/978-1-4684-3512-2_9
LI HS (2012) Modern plant physiology. Higher Education Press, Beijing, China, p 242
Li WD, Duan W, Fan PG. Yan TS, LI HS (2007) Photosynthesis in response to sink-source activity and in relation to end products and activities of metabolic enzymes in peach trees. Tree Physiol 27:1307-1318. doi:10.1093/treephys/27.9.1307
Li XH (2008) Effect of different leaf fruit ratio on the growth and development of fragrant pear. XinjiangAgricReclamTechnol4:27-28.
Lou HP (2005) Effects of fruit loads on grape quality and vegetative growth. JLiaoningAgricColl7:31-32
Moscatello S, Proietti S, Augusti A, Scartazza A, Walker RP, Famiani F, Battistelli A (2017) Late summer photosynthesis and storage carbohydrates in walnut (Juglans regia L.): Feed-back and feed-forward effects. Plant Physiol Biochem 118:618-626. doi:10.1016 /j.plaphy.2017.07.025
Peng LL, Jiang WB, Han J (2012) Effects of source-sink relationship change on yield and quality in fruit tree. NonwoodForRes30:134-140 Tuo HY (2015) Effect of flower and fruit thinning on fruit size and yield of Kiwifruit. Sichuan Agric Sci Technol 3:31-32
Urban L, Léchaudel M, Lu P (2004) Effect of fruit load and girdling on leaf photosynthesis in Mangifera indica L. J Exp Bot 55:2075-2085.
doi:10.1093/jxb/erh220
Willey RL (1971) Microtechnique, A laboratory guide. Memillan Publishing Co., Inc., NY, USA