Construction of Time - Cost Model for Building Projects in Vietnam
9
0
0
전체 글
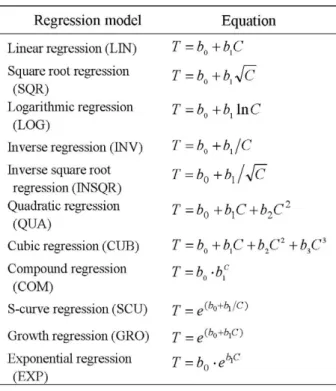
(2)
(3)
(4)
(5)
(6)
(7)
(8)
(9)
수치
+2
관련 문서
This paper investigates the current time management practices for road construction sites and proposes lean construction practices to effectively implement time management..
“Prediction Model of Construction Safety Accidents using Decision Tree Technique.” Journal of the Korea Institute of Building Construction, Korean Institute of
“A Study on the Model for Time-Cost Trade-off by Using Genetic Algorithms.” Journal of Architectural Institute of Korea, 20(8), pp. “A mixed
따라서 본 연구는 건설자재단가 시계열자료를 활용, 미래의 자재단가 예측을 위한 시계열모델을 구축하고 복 잡한 모델 프로세스를 간소화하는 자재별
These are classified into four categorised based on where they stem from as follows; from the organisation (1. Lack of integration of cost and time during project control,
projects in the previous of basic design phase. In order for public institutions to calculate the estimated construction cost, the cost per unit area of public buildings is
Keywords : project management information system, united state construction market, information technology, construction project management, cost reimbursable contract.. 따라서
Keywords : cash flow forecasting model, real-time actual cost for work performed, revenue and expenditure element, work process, construction management system.. 따라서
