Kim YU and Han KH. 1990. Early life history and spawning behavior of the gobiid Fish, Tridentiger trigonocephalus (Gill) reared in the laboratory. Kor J Ichthyol 2, 53-62.
Kim YU, Han KH and Kim BH. 1993. The embryonic and larval development of the Greenling, Hexagrammos otakii Jordan et Starks. Kor J Ichthyol 5, 151-159.
Kwak UH, Jang WK, Han IW and Lee KH. 2017. Analysis in bycatch ratio of shrimp beam trawl in Yeosu coastal area. Bull Inst Fish Tech Chonnam Natl Univ 10, 57-62.
Lee HW. 2001. Species composition of fish collected by trammel net off the coastal waters, Shinsudo, Sacheon.
MS Thesis Pukyong Nat Univ, 1-41.
Lee JC, Kim SY and Ma KH. 2000. Ovarian development and reproductive cycle of the female red tongue sole, Cynoglossus joyneri (Teleostei:Cynoglossidae). J Kor Fish Soc 33, 554-558.
Lee SJ and Go YB. 2003. Development of trunk musculature and fins in the early growth of anchovy, Engraulis japonica. Kor J Ichthyol 15, 45-52.
Lee SK, Seo YI, Kim JI, Kim HY and Choi MS. 2011. Seasonal species composition and fluctuation of fishes by beam trawl in Yeoja Bay. Kor J Ichthyol 206, 206-216.
Lee TW. 1996. Change in species composition of fishes in Cheonsu Bay. 1. Dermersal fish. J Kor Fish Soc 29, 71-83.
Lee TW, Moon HT, Hwang HB, Huh SH and Kim DJ. 2000.
Seasonal variation in species composition of fishes in the eelgrass beds in Angol Bay of southern coast of Korea.
J Kor Fish Soc 33, 439-447.
NIFS (National Institute of Fisheries Science). 2017. Ecology and fishery of coastal major fisheries resources. National institute of fisheries science press, Busan Korea, 1-383.
Oh CW, Kim ST and NA JH. 2009. Variations in species composition, biomass and density in shrimp trawl bycatch across seasons and tidal phases in southern korean waters: Developing a fisheries risk management approach. Fish Aqua Sci 12, 138-151.
Oh CW. 2010. Seasonal bycatch variations in the shrimp beam trawl fishery of coastal Wan-do, Korea. Kor J Fish Aqua Sci 43, 69-77.
Oh YS. 2006. Fluctuation in abundance and species composition of fishes collected by a fish pot and a gill net in the Samchunpo, Korea. MS Thesis Yosu Nat Univ, 1-33.
Okiyama M. 1988. An Atlas of the Early Stage Fishes in Japan.
Tokai Univ Press Tokyo, 1-1154.
Persson L and Diehl S. 1990. Mechanistic individual-based approaches in the population/community ecology of fish.
In annales Zoologici Fennici (pp. 165-182). Finish Zoological Publishing Board, formed by the Finish Academy of Sciences, Societas Scientiarum Fennica, Societas Scientiarum Fennica, Societas Biologica Fennica Vanamo and Societas pro Fauna et Flora Fennica.
Saveliev PA, Balanov AA and Solomatov SF. 2012.
Distribution and some features of the eelpout Lycodes tanakae Jordanet Thompson, 1914 (Perciformes : Zoaecidae) in the Tatar Strait, Sea of Japan. Rus J Mar Bio 38, 279-284.
Shannon CE and Weaver W. 1949. The Mathematical theory of communication Univ Illinois Press, Urbana U.S.A., 1-177.
Slavin JW. 1982. Utilization of shrimp bycatch. In: IDRC (Ed.). Fish bycatch-bonus from the sea. Report of a technical consultation on shrimp bycatch utilization (IDRC-198e). Ottawa Canada, 21-28.
Somerfield PJ. 2008. Identification of the Bray-Curtis similarity index : Comment on Yoshioka (2008). Mar Ecol Prog Ser, 372, 303-306. (DOI:10.3354/meps07841)
Song MY, Kim JI, Kim ST, Lee JH and Lee JB. 2012. Seasonal variation in species composition of catch by a coastal beam trawl in Jinhae Bay and Jinju Bay, Korea. J Kor Soc Fish Tech 48, 428-444.
Seo YI, Joo H, Lee SK, Kim HY, Ko JC, Choi MS, Kim JI and Oh TY. 2010. Maturity and spawning of Marbled sole Pleuronectes yokohamae in the Southern Sea of Korea. Kor J Ichthyol 22, 83-89.
Ustadi, Kim KY and Kim SM. 2005. Purification and identification of a protease inhibitor from glassfish (Liparis tanakai) eggs. J Agric Food Chem 53, 395-420.
Woo HJ. 2007. Characteristics of foraminiferal distributions in surface sediments of Gangjin Bay, Korea. J Paleont Soc Kor 23, 1-13.
Yamada U, Tagawa M, Kishida S and Honjo K. 1986. Fishes of the East China sea and the Yellow Sea, Seikai Reg.
Fish Res Lab Japan, 1-501.
2018. 06. 20 Received 2018. 07. 24 Revised 2018. 08. 01 Accepted
한국 동해 생태계의 어획강도 변화에 따른 자원량 예측 연구
임정현·서영일1*·장창익
부경대학교 해양생산시스템관리학부,
1국립수산과학원 연근해자원과
A study on the forecasting biomass according to the changes in fishing intensity in the Korean waters of the East Sea
Jung-Hyun L
IM, Young-Il S
EO1* and Chang-Ik Z
HANGDepartment of Marine Production System Management, Pukyong National University, Busan 48513, Korea
1
Fisheries Resources Management Division, National Institute of Fisheries Science, Buasn 46083, Korea
Overfishing capacity has become a global issue due to over-exploitation of fisheries resources, which result from excessive fishing intensity since the 1980s. In the case of Korea, the fishing effort has been quantified and used as an quantified index of fishing intensity. Fisheries resources of coastal fisheries in the Korean waters of the East Sea tend to decrease productivity due to deterioration in the quality of ecosystem, which result from the excessive overfishing activities according to the development of fishing gear and engine performance of vessels. In order to manage sustainable and reasonable fisheries resources, it is important to understand the fluctuation of biomass and predict the future biomass. Therefore, in this study, we forecasted biomass in the Korean waters of the East Sea for the next two decades (2017~2036) according to the changes in fishing intensity using four fishing effort scenarios;
,
, 0.5×
and 1.5×
. For forecasting biomass in the Korean waters of the East Sea, parameters such as exploitable carrying capacity (ECC), intrinsic rate of natural increase (r) and catchability (q) estimated by maximum entropy (ME) model was utilized and logistic function was used. In addition, coefficient of variation (CV) by the Jackknife re-sampling method was used for estimation of coefficient of variation about exploitable carrying capacity (CV
ECC). As a result, future biomass can be fluctuated below the B
PYlevel when the current level of fishing effort in 2016 maintains. The results of this study are expected to be utilized as useful data to suggest direction of establishment of fisheries resources management plan for sustainable use of fisheries resources in the future.
Keywords : Forecasting biomass, Fishing intensity, Maximum entropy model, Jackknife re-sampling, Korean waters of the East Sea
서 론
1980년대부터 과도한 어획능력에 의한 수산자원의
남획으로 과잉어획능력은 전세계적으로 이슈가 되었고, 어획능력에 관한 논의는 유엔식량농업기구(Food and
*Corresponding author: [email protected], Tel: +82-51-720-2296, Fax: +82-51-720-2277
www.fishtech.or.kr
<Original Article>
Agriculture Organization of the United Nations, FAO) 수산위원회에서 처음 제기되었다(FAO, 1996). 우리나라 의 경우에는 어획노력량이 어획강도의 정량화된 지표로 사용되고 있다(Kim and Lee, 2008). 우리나라 연근해 어업 의 수산자원은 어로장비 및 선박의 엔진성능 발달에 따른 과도한 남획과 환경오염으로 인한 생태계의 질적 저하로 생산성이 점차 감소하는 추세이다. 우리나라 연근해의 총 어획량은 1970년대부터 급격히 증가하다 1986년 약 173 만톤의 최고 수준에서 점차 감소하기 시작하여 최근 2016년 에는 약 93만톤 수준이다(Appendix 1). 또한 통합생산량 분석법으로 추정된 연도별 자원량의 3개년 이동평균 추 세도 1970년대 중반부터 꾸준히 감소하는 경향을 보였 다(NIFS, 2017).
우리나라 연근해의 단위면적당 어획량은 남해, 서해, 동해순으로 높으며, 동해의 경우 단위면적당 어획량이 우리나라 해역에서 가장 적은 1.13 mt/㎢로 나타났다 (Appendix 2). 해역별 어획량은 최근 5개년(2012~2016년) 의 평균 어획량을 기준으로 남해가 전체 연근해 생산량 의 71%로 가장 큰 비율을 차지하였고, 동해가 17%, 서해가 12% 순이었다. 최근 FAO의 어업통계에 따르면, 전세계 평균 단위면적당 어획량은 0.23 mt/㎢이며, 우리 나라가 속하는 북서태평양의 단위면적당 어획량은 전 세계 해역에서 가장 많은 1.04 mt/㎢를 차지하고 있다 (FAO Statistics).
본 연구의 대상생태계인 동해의 주요 어업을 살펴보 면, 최근 5개년(2012~2016년) 어업별 평균 어획량 비율 의 순위는 근해통발, 동해구중형트롤, 근해채낚기, 연안 자망, 정치망 순이었다(Appendix 3). 어획량 비율이 높 은 상위 5개 어업의 평균 어획량은 동해 전체 어획량의 약 77%를 차지하였으며, 근해통발의 평균 어획량 비율 이 약 22%로 가장 높았다.
동해의 주요 어종 변화를 보면, 최근 5개년(2012~
2016년) 어종별 평균 어획량 비율의 순위는 살오징어, 붉은대게, 청어 순이었다(Appendix 4). 상위 15종의 평 균 어획량은 동해 전체 어획량의 약 89%를 차지하였다.
특히, 살오징어의 평균 어획량 비율이 약 39%로 상당히 높은 값을 나타냈다.
본 연구에서는 한국 동해생태계의 자원이 어획강도의 변화에 따라 얼마나 빨리 회복되는지를 파악하기 위해 4가지의 어획노력량 시나리오를 사용하여 어획강도 변
화에 따른 향후 20년간(2017~2036년)의 한국 동해 생태 계의 자원량을 예측하였다. 이에 따라, 향후 지속가능한 수산자원 이용을 위한 자원관리방안의 수립 방향을 제 시하고자 한다.
재료 및 방법
대상생태계는 Lim et al. (2018)을 참조하여 설정하였고, 분석시에 사용된 동해 연근해어업의 어획량과 어획노력량 자료는 수산통계연보와 국가통계포털(KOSIS, 2017)의 자 료를 사용하였다. 또한 수집된 동해의 어획노력량인 총톤 수 자료는 어로기술의 발달에 의해 향상된 어획효율을 반 영하기 위해 우리나라 어업별 어획성능지수(Lim et al., 2018; NIFS, 2016; Seo et al., 2017)를 사용하여 동해의 총톤수 자료를 표준화시켰다.
어획강도 변화에 따른 자원량을 예측하기 전에 2016년 까지의 한국 동해 생태계의 연도별 자원상태 변동을 파악 하기 위해 Kobe plot을 적용하였다(Nishida et al., 2014).
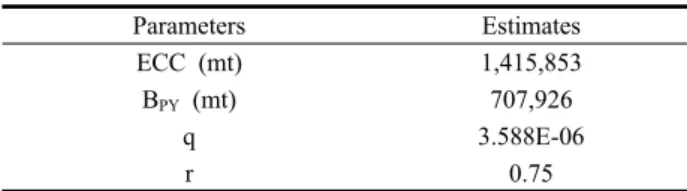
향후 20년(2017~2036년)에 대한 한국 동해 생태계의 자 원량 예측을 위해 통합생산량 분석법 중 확률치로 파라 미터를 추정하여 상대적으로 신뢰성이 높은 최대엔트로 피(Maximum entropy, ME)모델로 추정된 어획대상 환 경수용량(Exploitable carrying capacity, ECC)과 잠재생 산량(Potential yield, PY)을 달성하기 위한 수준의 자원 량(B
PY), 기타 파라미터들을 참조하였다(Table 1).
자원량은 아래의 로지스틱 함수식에 ME 모델로 추정 된 파라미터들을 적용하여 예측하였다.
∙
(1)
여기서,
은
년의 자원량,
는
년의 자 원량, ECC와
은 통합생산량 분석법의 ME모델에
Parameters Estimates ECC (mt) 1,415,853 B
PY(mt) 707,926
q 3.588E-06
r 0.75
Table 1. Parameters estimated by maximum entropy model for
forecasting biomass according to the changes in fishing intensity
in the Korean waters of the East Sea (Lim et al., 2018)
Agriculture Organization of the United Nations, FAO) 수산위원회에서 처음 제기되었다(FAO, 1996). 우리나라 의 경우에는 어획노력량이 어획강도의 정량화된 지표로 사용되고 있다(Kim and Lee, 2008). 우리나라 연근해 어업 의 수산자원은 어로장비 및 선박의 엔진성능 발달에 따른 과도한 남획과 환경오염으로 인한 생태계의 질적 저하로 생산성이 점차 감소하는 추세이다. 우리나라 연근해의 총 어획량은 1970년대부터 급격히 증가하다 1986년 약 173 만톤의 최고 수준에서 점차 감소하기 시작하여 최근 2016년 에는 약 93만톤 수준이다(Appendix 1). 또한 통합생산량 분석법으로 추정된 연도별 자원량의 3개년 이동평균 추 세도 1970년대 중반부터 꾸준히 감소하는 경향을 보였 다(NIFS, 2017).
우리나라 연근해의 단위면적당 어획량은 남해, 서해, 동해순으로 높으며, 동해의 경우 단위면적당 어획량이 우리나라 해역에서 가장 적은 1.13 mt/㎢로 나타났다 (Appendix 2). 해역별 어획량은 최근 5개년(2012~2016년) 의 평균 어획량을 기준으로 남해가 전체 연근해 생산량 의 71%로 가장 큰 비율을 차지하였고, 동해가 17%, 서해가 12% 순이었다. 최근 FAO의 어업통계에 따르면, 전세계 평균 단위면적당 어획량은 0.23 mt/㎢이며, 우리 나라가 속하는 북서태평양의 단위면적당 어획량은 전 세계 해역에서 가장 많은 1.04 mt/㎢를 차지하고 있다 (FAO Statistics).
본 연구의 대상생태계인 동해의 주요 어업을 살펴보 면, 최근 5개년(2012~2016년) 어업별 평균 어획량 비율 의 순위는 근해통발, 동해구중형트롤, 근해채낚기, 연안 자망, 정치망 순이었다(Appendix 3). 어획량 비율이 높 은 상위 5개 어업의 평균 어획량은 동해 전체 어획량의 약 77%를 차지하였으며, 근해통발의 평균 어획량 비율 이 약 22%로 가장 높았다.
동해의 주요 어종 변화를 보면, 최근 5개년(2012~
2016년) 어종별 평균 어획량 비율의 순위는 살오징어, 붉은대게, 청어 순이었다(Appendix 4). 상위 15종의 평 균 어획량은 동해 전체 어획량의 약 89%를 차지하였다.
특히, 살오징어의 평균 어획량 비율이 약 39%로 상당히 높은 값을 나타냈다.
본 연구에서는 한국 동해생태계의 자원이 어획강도의 변화에 따라 얼마나 빨리 회복되는지를 파악하기 위해 4가지의 어획노력량 시나리오를 사용하여 어획강도 변
화에 따른 향후 20년간(2017~2036년)의 한국 동해 생태 계의 자원량을 예측하였다. 이에 따라, 향후 지속가능한 수산자원 이용을 위한 자원관리방안의 수립 방향을 제 시하고자 한다.
재료 및 방법
대상생태계는 Lim et al. (2018)을 참조하여 설정하였고, 분석시에 사용된 동해 연근해어업의 어획량과 어획노력량 자료는 수산통계연보와 국가통계포털(KOSIS, 2017)의 자 료를 사용하였다. 또한 수집된 동해의 어획노력량인 총톤 수 자료는 어로기술의 발달에 의해 향상된 어획효율을 반 영하기 위해 우리나라 어업별 어획성능지수(Lim et al., 2018; NIFS, 2016; Seo et al., 2017)를 사용하여 동해의 총톤수 자료를 표준화시켰다.
어획강도 변화에 따른 자원량을 예측하기 전에 2016년 까지의 한국 동해 생태계의 연도별 자원상태 변동을 파악 하기 위해 Kobe plot을 적용하였다(Nishida et al., 2014).
향후 20년(2017~2036년)에 대한 한국 동해 생태계의 자 원량 예측을 위해 통합생산량 분석법 중 확률치로 파라 미터를 추정하여 상대적으로 신뢰성이 높은 최대엔트로 피(Maximum entropy, ME)모델로 추정된 어획대상 환 경수용량(Exploitable carrying capacity, ECC)과 잠재생 산량(Potential yield, PY)을 달성하기 위한 수준의 자원 량(B
PY), 기타 파라미터들을 참조하였다(Table 1).
자원량은 아래의 로지스틱 함수식에 ME 모델로 추정 된 파라미터들을 적용하여 예측하였다.
∙
(1)
여기서,
은
년의 자원량,
는
년의 자 원량, ECC와
은 통합생산량 분석법의 ME모델에
Parameters Estimates ECC (mt) 1,415,853 B
PY(mt) 707,926
q 3.588E-06
r 0.75
Table 1. Parameters estimated by maximum entropy model for forecasting biomass according to the changes in fishing intensity in the Korean waters of the East Sea (Lim et al., 2018)
의해 추 정 되 는 어 획 대 상 환 경 수 용 량 과 내 적 자 연 증 가 율 이 다 . 는 랜덤변동계수로서 EXCEL에 서
×
∙ 와 같 은 수 식 을 입 력 하 여 계 산 하 였 으 며 , 는 0~1 사이의 난수를 발생시키는 함수이다. 실제로 환경수용량은 일정한 것이 아니라 매년 기후요인 등 환경요인에 의해 변동하기 때문에, 매년 ECC가 ECC에 대한 변동계수
의 범위 안에서 랜덤하게 변한다 는 가정을 설정하고 자원량을 예측하였다.
(2)
여기서,
는
년의 어획량,
는 어획효율계수,
는
년의 어획노력량이다. 본 연구에서는 2016년 어획노력 량
, 잠재생산량 시 어획노력량
, 2016년 어 획노력량(
)에 대하여 ×0.5, ×1.5배의 총 4가지 시나리 오를 설정하여 어획강도 변화에 따른 한국 동해 생태계 의 자원량을 예측하였다.
어획대상 환경수용량에 대한 변동계수(
)를 추 정하기 위해 Jackknife re-sampling 방법을 사용하였다 (Tukey, 1958). 이 방법은 자료에서 얻어진 통계량의 표 본오차를 비모수적으로 평가하는 방법이다. 가장 단순 한 Jackknife법은 주어진 자료에서 자료점을 하나씩 제 거하여 통계량을 계산하는 작업을 반복하여, 얻어진 잭 나이프통계량의 분산과 표준오차를 계산하는 방법이며, 그 과정은 아래의 식과 같다.
(3)
(4)
(5)
(6) 따라서 본 연구에서는 아래의 식 (7)을 적용하여 ECC 의 변동계수(
)를 추정하였다.
(7)
즉, 1966년부터 2016년까지 51개년에 대한 동해의 어 획량과 어획노력량 자료 중에서 1개년의 자료를 1966년 부터 2016년까지 순서대로 하나씩 제외시켜 50개년의 자료를 가지는 표본을 51개 만든다. 다음으로 각 표본을 ME모델에 적용시켜 51개의 추정치를 구한 다음 식 (3)~
식 (7)을 적용시켜 ECC에 대한 변동계수를 구하였다.
추정되는 동해의 ECC 변동계수는 자원량 예측 시 ECC 의 변동 범위로 사용된다.
결 과
Jackknife re-sampling 방법에 의한 동해의 ECC 변동 계수는 0.161로 추정되었으며(Table 2), 이 값을 어획강
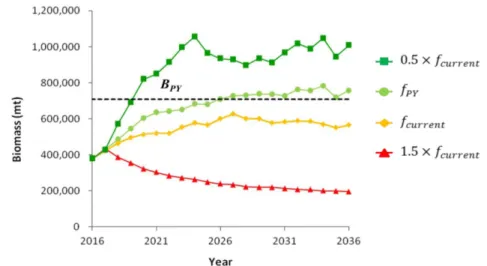
Fig. 1. Forecast results of biomass during the next 2 decades (2017-2036) in the Korean waters of the East Sea according to the
changes in fishing intensity.
도 변화에 따른 한국 동해 생태계의 자원량 예측 시에 ECC의 변동 범위로 사용하였다.
4가지 시나리오의 어획노력량 변화에 따른 향후 20년 (2017-2036년)에 대한 한국 동해생태계의 자원량을 예측 한 결과는 Fig. 1과 같다. 2036년의 자원량은 0.5×f
current, f
PY, f
current, 1.5×f
current시나리오 순으로 자원량이 높았다.
2016년 어획노력량 수준인 f
current를 유지할 경우, 자원량 이 근소하게 높은 수준에서 변동하는 것으로 보이나 , 자원 량이 잠재생산량을 달성하기 위한 수준의 자원량(B
PY)보 다 훨씬 낮은 수준에서 변동하는 것으로 나타났다. 또한 2016년 수준보다 어획강도를 1.5배 높인 1.5×f
current시나 리오에서는 자원량이 크게 감소하는 추세를 보여 B
PY수 준에 훨씬 못 미치는 것으로 나타났다. 반면에, f
PY시나리 오에서는 향후 동해의 자원량이 B
PY수준보다 약간 높은 수준까지 증가하여 변동하는 것으로 나타났으며, 어획강 도를 2016년의 절반수준으로 낮춘 0.5×f
current시나리오에 서는 자원량이 B
PY(707,926톤) 수준을 크게 뛰어넘는 것 으로 나타났다.
고 찰
전세계 육상자원 고갈로 해양자원 확보를 위한 국가 간의 경쟁이 심화되고 있고, 지속적 수산자원 이용을 위한 과학적인 자원 관리에 대한 요구가 증대되고 있는 실정이다. 따라서 지속가능하고 합리적인 수산자원의 관리를 위해서는 자원량의 변동을 파악하고 현재 자원 이 어느 수준에 있는지를 판단하여 미래 자원량을 예측해 서 자원관리를 수행할 필요가 있다. 이에 따라 본 연구에 서는 어획강도 변화에 따른 향후 20년(2017~2036년)에 대한 한국 동해생태계의 자원량을 예측하였다. 현 2016 년 어획노력량 수준(f
current)을 유지할 경우 자원량이 잠재 생산량을 달성하기 위한 수준의 자원량(B
PY) 수준에 훨씬 못 미치는 낮은 수준에서 변동하는 것으로 보아 현 수준 이 남획수준임을 예측할 수 있다. 그러므로 지속적이고 효율적인 자원의 이용으로 잠재생산량(Potential yield, PY) 수준의 어획량을 얻기 위한 동해 생태계의 자원회 복을 위해서는 잠재생산량 시 어획노력량인 f
PY시나리 오에 따라 어획노력량을 f
PY수준까지 감소시켜 자원량 을 B
PY수준으로 증가시켜야 한다. 과학적인 자원상태 평가를 통해 2016년의 38만톤 수준인 동해 자원량의 약 1.9배인 B
PY(71만톤) 수준을 목표자원량으로 설정
Sample ECC estimate (
) Pseudo value of ECC (
) 1 1,479,613 -1,772,133
2 1,439,762 220,387
3 1,546,919 -5,137,434
4 1,362,491 4,083,962
5 1,410,909 1,663,044
6 1,340,147 5,201,161
7 1,445,354 -59,201
8 1,348,953 4,760,821
9 1,378,203 3,298,355
10 1,383,246 3,046,177
11 1,547,790 -5,181,031
12 1,306,289 6,894,017
13 1,478,262 -1,704,596
14 1,354,608 4,478,117
15 1,410,909 1,663,044
16 1,346,851 4,865,931
17 1,392,751 2,570,957
18 1,453,339 -458,463
19 1,415,764 1,420,293
20 1,348,081 4,804,467
21 1,377,569 3,330,044
22 1,413,108 1,553,110
23 1,453,339 -458,463
24 1,385,312 2,942,912
25 1,348,081 4,804,467
26 1,397,193 2,348,833
27 1,398,232 2,296,893
28 1,415,764 1,420,293
29 1,415,764 1,420,293
30 1,365,743 3,921,321
31 1,390,843 2,666,338
32 1,310,721 6,672,429
33 1,452,904 -436,686
34 1,410,909 1,663,044
35 1,341,313 5,142,851
36 1,279,428 8,237,090
37 1,322,381 6,089,429
38 1,470,167 -1,299,845
39 1,410,909 1,663,044
40 1,348,081 4,804,467
41 1,390,739 2,671,549
42 1,477,109 -1,646,965
43 1,362,500 4,083,515
44 1,410,909 1,663,044
45 1,348,081 4,804,467
46 1,348,081 4,804,467
47 1,279,428 8,237,090
48 1,438,040 306,509
49 1,365,471 3,934,944
50 1,410,909 1,663,044
51 1,348,081 4,804,467
Standard error
(S.E.) 407,472
Coefficient of
variation (CV) 0.161
Table 2. Estimates of exploitable carrying capacity (ECC), standard
error (S.E.), and coefficient of variation (CV) by the Jackknife
re-sampling method in the Korean waters of the East Sea
도 변화에 따른 한국 동해 생태계의 자원량 예측 시에 ECC의 변동 범위로 사용하였다.
4가지 시나리오의 어획노력량 변화에 따른 향후 20년 (2017-2036년)에 대한 한국 동해생태계의 자원량을 예측 한 결과는 Fig. 1과 같다. 2036년의 자원량은 0.5×f
current, f
PY, f
current, 1.5×f
current시나리오 순으로 자원량이 높았다.
2016년 어획노력량 수준인 f
current를 유지할 경우, 자원량 이 근소하게 높은 수준에서 변동하는 것으로 보이나 , 자원 량이 잠재생산량을 달성하기 위한 수준의 자원량(B
PY)보 다 훨씬 낮은 수준에서 변동하는 것으로 나타났다. 또한 2016년 수준보다 어획강도를 1.5배 높인 1.5×f
current시나 리오에서는 자원량이 크게 감소하는 추세를 보여 B
PY수 준에 훨씬 못 미치는 것으로 나타났다. 반면에, f
PY시나리 오에서는 향후 동해의 자원량이 B
PY수준보다 약간 높은 수준까지 증가하여 변동하는 것으로 나타났으며, 어획강 도를 2016년의 절반수준으로 낮춘 0.5×f
current시나리오에 서는 자원량이 B
PY(707,926톤) 수준을 크게 뛰어넘는 것 으로 나타났다.
고 찰
전세계 육상자원 고갈로 해양자원 확보를 위한 국가 간의 경쟁이 심화되고 있고, 지속적 수산자원 이용을 위한 과학적인 자원 관리에 대한 요구가 증대되고 있는 실정이다. 따라서 지속가능하고 합리적인 수산자원의 관리를 위해서는 자원량의 변동을 파악하고 현재 자원 이 어느 수준에 있는지를 판단하여 미래 자원량을 예측해 서 자원관리를 수행할 필요가 있다. 이에 따라 본 연구에 서는 어획강도 변화에 따른 향후 20년(2017~2036년)에 대한 한국 동해생태계의 자원량을 예측하였다. 현 2016 년 어획노력량 수준(f
current)을 유지할 경우 자원량이 잠재 생산량을 달성하기 위한 수준의 자원량(B
PY) 수준에 훨씬 못 미치는 낮은 수준에서 변동하는 것으로 보아 현 수준 이 남획수준임을 예측할 수 있다. 그러므로 지속적이고 효율적인 자원의 이용으로 잠재생산량(Potential yield, PY) 수준의 어획량을 얻기 위한 동해 생태계의 자원회 복을 위해서는 잠재생산량 시 어획노력량인 f
PY시나리 오에 따라 어획노력량을 f
PY수준까지 감소시켜 자원량 을 B
PY수준으로 증가시켜야 한다. 과학적인 자원상태 평가를 통해 2016년의 38만톤 수준인 동해 자원량의 약 1.9배인 B
PY(71만톤) 수준을 목표자원량으로 설정
Sample ECC estimate (
) Pseudo value of ECC (
) 1 1,479,613 -1,772,133
2 1,439,762 220,387
3 1,546,919 -5,137,434
4 1,362,491 4,083,962
5 1,410,909 1,663,044
6 1,340,147 5,201,161
7 1,445,354 -59,201
8 1,348,953 4,760,821
9 1,378,203 3,298,355
10 1,383,246 3,046,177
11 1,547,790 -5,181,031
12 1,306,289 6,894,017
13 1,478,262 -1,704,596
14 1,354,608 4,478,117
15 1,410,909 1,663,044
16 1,346,851 4,865,931
17 1,392,751 2,570,957
18 1,453,339 -458,463
19 1,415,764 1,420,293
20 1,348,081 4,804,467
21 1,377,569 3,330,044
22 1,413,108 1,553,110
23 1,453,339 -458,463
24 1,385,312 2,942,912
25 1,348,081 4,804,467
26 1,397,193 2,348,833
27 1,398,232 2,296,893
28 1,415,764 1,420,293
29 1,415,764 1,420,293
30 1,365,743 3,921,321
31 1,390,843 2,666,338
32 1,310,721 6,672,429
33 1,452,904 -436,686
34 1,410,909 1,663,044
35 1,341,313 5,142,851
36 1,279,428 8,237,090
37 1,322,381 6,089,429
38 1,470,167 -1,299,845
39 1,410,909 1,663,044
40 1,348,081 4,804,467
41 1,390,739 2,671,549
42 1,477,109 -1,646,965
43 1,362,500 4,083,515
44 1,410,909 1,663,044
45 1,348,081 4,804,467
46 1,348,081 4,804,467
47 1,279,428 8,237,090
48 1,438,040 306,509
49 1,365,471 3,934,944
50 1,410,909 1,663,044
51 1,348,081 4,804,467
Standard error
(S.E.) 407,472
Coefficient of
variation (CV) 0.161 Table 2. Estimates of exploitable carrying capacity (ECC), standard error (S.E.), and coefficient of variation (CV) by the Jackknife re-sampling method in the Korean waters of the East Sea
하고, 동해 생태계의 자원 회복을 위해 유엔식량농업 기구(FAO), 북태평양해양과학기구(PICES), 국제해양 관리위원회(MSC) 등 수산관련 국제기구와 미국, 호주 등 선진국에서 추진하고 있는 생태계 기반 어업관리를 적극적으로 실시한다면, 2016년의 17만톤 수준인 어획 량을 PY 수준까지 증가시킬 수 있을 것으로 기대된다.
어획강도 시나리오에 따라 자원상태의 변화를 예측하 여 적정 수준의 어획강도와 실현가능한 연근해 생산량 목표를 명확히 설정하고, 체계적인 어획노력량 관리를 위해 정확한 조업정보를 보고할 수 있는 전자조업보고 시스템(Electronic reporting system, ERS)을 구축하여 통합적인 자원관리를 시행해 나간다면 향후 지속가능한 수산자원의 이용이 가능할 것으로 판단된다.
사 사
이 논문은 국립수산과학원 수산시험연구사업 연근해 어업 자원평가 및 관리연구(R2018024)의 지원으로 수 행된 연구입니다.
References