Awareness and perceived necessity of dietary guidelines among urban Koreans by gender*
Kyung Eui Hong1, Hyun Kyung Moon2, Sung Il Cho, Byung Chul Ahn3 and Hyojee Joung1§
1School of Public Health, Seoul National University, Seoul 110-799, Korea
2Department of Food and Nutrition, Dankook University, Seoul 140-714, Korea
3School of Economics and Finance, Yeungnam University, Kyungbuk 712-749, Korea
Received July 16, 2007; Revised August 13, 2007; Accepted September 7, 2007
Abstract
We examined an urban population’s awareness of dietary guidelines to determine whether they perceived them to be necessary, and identified the factors affecting this awareness and perceived necessity. Data were collected via physical examinations and face-to-face interviews. Health indicators were collected from health examinations, and information on individual characteristics, including awareness, perceived necessity, and dietary status were obtained from the interviews. The subjects’ sociodemographic, health and dietary status were examined as potential factors influencing awareness and perceived necessity. Descriptive statistics, contingency tables, and logistic regression modeling were used in the analysis. Low awareness of the dietary guidelines was displayed by the elderly and poorly educated individuals, and those without a spouse. Most people who were not aware of the dietary guidelines thought the guidelines unnecessary. Males with hypertension and lower hemoglobin levels, and females with less education had low awareness. Elderly females with lower bone density had less perceived necessity. Males and females with poor dietary status reported low perceived necessity.
Key Words: Dietary guidelines, awareness, perceived necessity, logistic regression
Introduction11)
In 1992, the World Declaration of Nutrition, which recom- mended the development of national food-based dietary guide- lines, was adopted during the International Conference of Nu- trition in Rome (FAO & WHO, 1996). Since then, about 30 nations have established dietary guidelines (Welsh, 1996), with the goal of improving people’s health, preventing chronic diseases, and reducing medical expenses. In 1995, the Korean Health Industry Development Institute developed the country’s food-based dietary guidelines, ‘Dietary Guidelines for Koreans’, which have since been revised in 2002 (Korea Health Industry Development Institute, 2002).
These guidelines have been a central theme of Korea’s health- promotion activities. Educational programs that target special groups have been more efficient than generic programs in improving the general health of the nation (Achterberg, 1994).
Therefore, to effectively disseminate the guidelines, it was essential to identify target subpopulations with a stronger demand for diet-related information. Before planning or implementing the educational programs, the target groups with the greatest need for overall health improvement should be identified. However,
no studies have been conducted to identify such groups in Korea that need dietary guidelines education.
Reports related to the dietary guidelines and compliance have focused on factors related to food consumption based on the guidelines (Turrell et al., 2002) and the results of that consump- tion (Kant et al., 2000), as well as on consumers’ perceptions regarding the importance of complying with dietary guidelines (Nayga & Capps, 1999). However, no reports have identified the subpopulations requiring more effective dissemination of the dietary guidelines. In addition, limited information was available to identify predictors of both awareness and the perceived necessity of the dietary guidelines. This study analysed subjects’
awareness of the national ‘Dietary Guidelines for Koreans’, and their perception of the need for the guidelines. This information could help health professionals and policy makers in developing educational programs about the guidelines and on how to achieve healthier diets.
In this cross-sectional population-based study, sociodemogra- phic factors were chosen from literary reviews (Ball et al., 2004;
Dynesen et al., 2003; Keenan et al., 1999; Nayga, 1997; Nayga
& Capps, 1999; Turrell et al., 2002, 2003, 2004), and health and dietary factors were selected based on a preliminary survey.
* This study was supported by the Brain Korea 21 Project in 2007 and the grant of the Korea Health 21 R&D Project, Ministry of Health & Welfare, Republic of Korea (No. 03-PJI-PGI-CH12-0002).
§Corresponding Author: Hyojee Joung, Tel. 82-2-740-8865, Fax. 82-2-745-9104, Email. [email protected]
Table 1. Items of questionnaire 1. Eat a variety of vegetables.
2. Eat a variety of seasonal fruits.
3. Eat milk, yogurt, cheese or other dairy products for snacks.
4. Eat meat with fat removed.
5. Eat fried or parched products in a small quantity.
6. Often eat fishes with blue backs.
7. Eat salt-preserved foods such as pickled fish in a small quantity.
8. Use a small quantity of salt or soy sauce when cooking and eating.
9. Drink water from soups or broths in small quantity.
10. Exercise over 30 minutes, 3-4 times a week.
11. Restrict sweet food and drinks.
12. Increase physical activities.
13. Maintain a healthy weight.
14. Avoid drinking as much as possible.
15. When drinking, limit your drinking to 2 glasses if male, 1 glass if female.
16. Do not skip breakfast.
17. Enjoy evening meal with family members.
18. Prepare and/or order foods in adequate amounts.
19. Keep leftovers in a refrigerator and do not leave them for a lengthy time.
20. Maintain a nutritional balance with a menu of a variety of products.
21. Eat vegetables, meat or fish, and beans evenly.
22. Enjoy all three meals on time.
This investigation sought to evaluate the population’s awa- reness of the guidelines and perception of their necessity, and identify the factors affecting awareness and perceived necessity by gender.
Subjects and Methods
Subjects
Five blocks were selected randomly in one district of Seoul, and visitors to a social welfare center in each block recruited as study subjects. Written informed consent was obtained from all of the 345 participants, but only 290 providing complete responses were included in the analysis.
Data collection
Data were collected on five consecutive days in August 2003.
The field survey consisted of interviews and physical examinations. Face-to-face interviews were conducted by trained interviewers using a general questionnaire evaluating sociode- mographic status, dietary status, awareness of the dietary guidelines, and perceived necessity of the guidelines. Physical health examinations were performed by nurses and health center workers under the supervision of a general physician.
Research instruments and measures 1) General questionnaires
The general questionnaires were composed of three parts:
sociodemographic status, including gender, age, education levels, marital status, and monthly income; dietary status; and awareness of the Korean dietary guidelines and perception of their necessity.
2) Sociodemographic status
Age groups were classified as adult (32≤age<65 years) or elderly (≥65 years). Education was divided into lower (<12 years) and higher education levels (≥12 years). Marital status was coded as ‘without a spouse’ or ‘with a spouse’. Monthly household income was grouped into a lower income (<1,000,000 Korean won≑US $1,000) and a higher income group (≥
1,000,000 won).
3) Dietary status
The dietary status of the subjects was examined using a structured questionnaire about the 22 items listed in the Korean dietary guidelines (Korea Health Industry Development Institute, 2002). The items of the questionnaire are as follows: (Table 1).
The five-point Likert scale (‘don’t do it at all’ = a score of 1;
‘don’t do it’ = 2; ‘so-so’ = 3; ‘do it’ = 4; ‘do it very much’
= 5) was used for each item. Two nutritionists examined all of the items for content validity, and the scale’s reliability
(Cronbach’s alpha) was 0.6734. The dietary scores, representing the subjects’ status with the dietary guidelines, were calculated as the sums of the responses for all 22 items; hence, the scores could range from 22 to 110 points. The mean dietary score was 75.09 ± 8.51(SD). Dietary status was grouped into two classes based on quartile score: ‘good’ (score≥70) and ‘poor’ (score
<70).
4) Awareness and perceived necessity of the dietary guidelines Subjects were asked whether they knew that dietary guidelines existed for Koreans and whether they considered the dietary guidelines necessary. In their responses, ‘not necessary’ and
‘so-so’ were considered negative for two reasons: first, the questions related to their own health, so respondents answering
‘so-so’ were assumed to have negative attitudes. Second, only a few negative answers were given.
Physical health examination
The body mass index (BMI), blood pressure, plasma total cholesterol, hemoglobin level, and bone density were assessed as described below.
Body mass index (BMI)
BMI (kg/m2) was calculated and subjects were divided into three groups based on Asian Pacific criteria: underweight (<18.5 kg/m2), normal weight (<23.0 kg/m2), and overweight or obese (≥23 kg/m2).
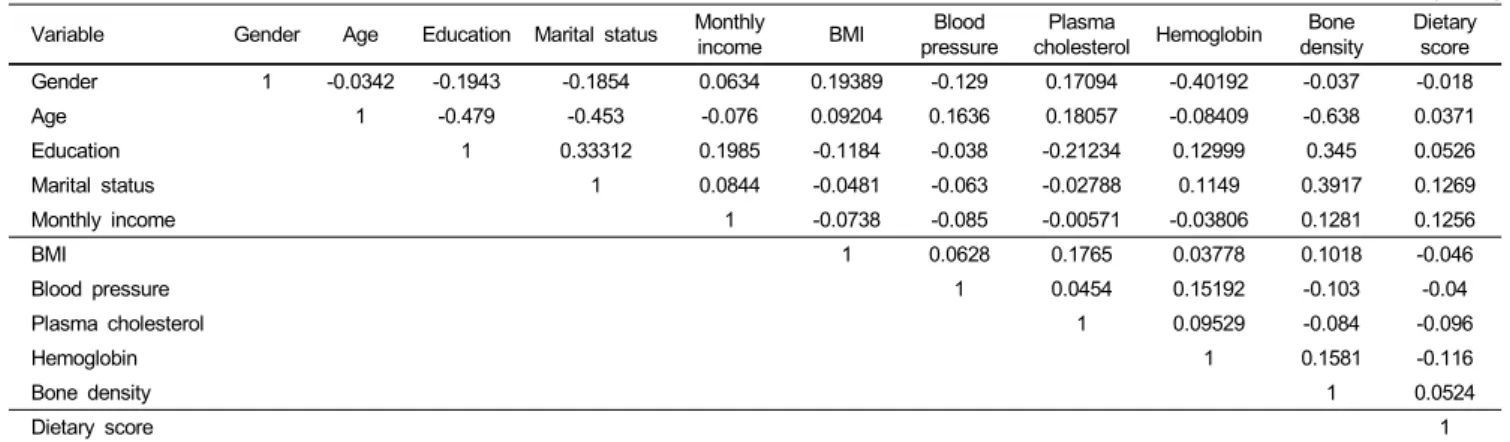
Table 2. Correlation coefficients between variables (n=290) Variable Gender Age Education Marital status Monthly
income BMI Blood
pressure Plasma
cholesterol Hemoglobin Bone
density Dietary score
Gender 1 -0.0342 -0.1943 -0.1854 0.0634 0.19389 -0.129 0.17094 -0.40192 -0.037 -0.018
Age 1 -0.479 -0.453 -0.076 0.09204 0.1636 0.18057 -0.08409 -0.638 0.0371
Education 1 0.33312 0.1985 -0.1184 -0.038 -0.21234 0.12999 0.345 0.0526
Marital status 1 0.0844 -0.0481 -0.063 -0.02788 0.1149 0.3917 0.1269
Monthly income 1 -0.0738 -0.085 -0.00571 -0.03806 0.1281 0.1256
BMI 1 0.0628 0.1765 0.03778 0.1018 -0.046
Blood pressure 1 0.0454 0.15192 -0.103 -0.04
Plasma cholesterol 1 0.09529 -0.084 -0.096
Hemoglobin 1 0.1581 -0.116
Bone density 1 0.0524
Dietary score 1
Blood pressure
Systolic and diastolic blood pressures were measured separately. Subjects were diagnosed as hypertensive with systolic blood pressure ≥140 mmHg or diastolic blood pressure ≥90 mmHg based on WHO criteria.
Plasma total cholesterol and hemoglobin level
Blood was drawn from the subjects after a 12 h fast to measure plasma total cholesterol and hemoglobin levels. Plasma total cholesterol was coded into three groups based on NCEP ATPIII criteria: normal (<200 mg/dl), borderline (<240 mg/dl), and hypercholesterolaemic (≥240 mg/dl). Hemoglobin levels were re-coded into two groups based on WHO criteria: anaemic (<13 g/dl for males, <12 g/dl for females) and normal.
Bone density
The density of the right side calcanei per one unit area was measured using PIXI (Lunar Radiation Crop, Madison, WI).
Bone health status was divided into three groups according to the t-score: normal (>-1), osteopaenic (>-2.5), or osteoporotic (≤-2.5) based on WHO criteria.
Statistical methods
Descriptive statistics were used to analyse the subjects’
sociodemographic, health, and dietary status, and the level of awareness and perceived necessity. The association of awareness and necessity with general characteristics was examined using chi-square tests. Logistic regression analyses were used to identify factors that affected awareness and perceived necessity.
The subjects’ awareness of the dietary guidelines and their perception that the guidelines were necessary were considered dependent variables. For logistic regression, dummy variables were created, in which a positive response was coded as ‘1’ and a negative response was coded as ‘0’.
Independent variables included the subjects’ sociodemographic
indicators, health status, and dietary status. Sociodemographic indicators included gender, age, education, marital status, and monthly income. Health status variables were the BMI, blood pressure, plasma total cholesterol, hemoglobin level, and bone density. Dietary status was represented with the dietary score.
Logistic regression models were as follows:
Logit (Pa) = b1Gender + b2Age + b3Education + b4Marital status + b5Monthly income + b6BMI + b7Blood pressure + b8Pl- asma cholesterol + b9Hemoglobin + b10Bone density + b11
Dietary score.
Logit (Ppn) = b1Gender + b2Age + b3Education + b4Marital status + b5Monthly income + b6BMI + b7Blood pressure + b8Pl- asma cholesterol + b9Hemoglobin + b10Bone density + b11
Dietary score.
[Pa= Probability of the awareness; Ppn= Probability of perc- eived necessity; gender (0 for males, 1 for females); age (conti- nuous variable); education (0 for<12 years, 1 for≥12 years);
marital status (0 = without a spouse, 1 = with a spouse); monthly income level (0 = lower income group, 1 = higher income group);
BMI (continuous variable); blood pressure (0 = normotensive, 1
= hypertensive); plasma cholesterol (continuous variable); hemo- globin (continuous variable); bone density (continuous variable);
dietary score (continuous variable)].
The standardised coefficients were reported to compare the relative influence of each independent variable. The correlation tests detected no degradation from multicollinearity. All of the correlation coefficients were below 0.64 (Table 2).
Results
General characteristics of the subjects
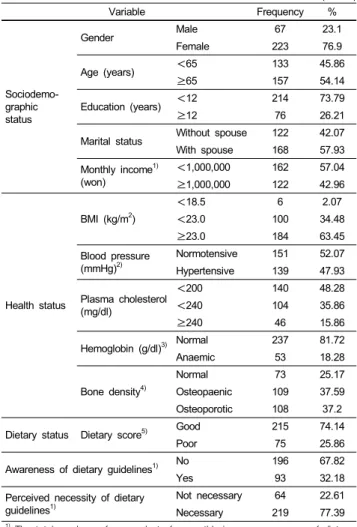
Among the samples, the highest percentages were noted among female, elderly, lower education, with a spouse, and lower income groups (76.9, 54.1, 73.8, 57.9, and 57%, respectively;
Table 3).
With regard to health indicators, the percentage of obesity, normotensive, normal plasma cholesterol (<240 mg/dl &
Table 3. General characteristics of subjects (n=290)
Variable Frequency %
Sociodemo- graphic status
Gender Male 67 23.1
Female 223 76.9
Age (years) <65 133 45.86
≥65 157 54.14
Education (years) <12 214 73.79
≥12 76 26.21
Marital status Without spouse 122 42.07
With spouse 168 57.93
Monthly income1) (won)
<1,000,000 162 57.04
≥1,000,000 122 42.96
Health status
BMI (kg/m2)
<18.5 6 2.07
<23.0 100 34.48
≥23.0 184 63.45
Blood pressure (mmHg)2)
Normotensive 151 52.07 Hypertensive 139 47.93
Plasma cholesterol (mg/dl)
<200 140 48.28
<240 104 35.86
≥240 46 15.86
Hemoglobin (g/dl)3) Normal 237 81.72
Anaemic 53 18.28
Bone density4)
Normal 73 25.17
Osteopaenic 109 37.59
Osteoporotic 108 37.2
Dietary status Dietary score5) Good 215 74.14
Poor 75 25.86
Awareness of dietary guidelines1) No 196 67.82
Yes 93 32.18
Perceived necessity of dietary guidelines1)
Not necessary 64 22.61
Necessary 219 77.39
1) The total numbers of respondents for monthly income, awareness of dietary guidelines, and perceived necessity of dietary guidelines were 284, 289, and 283, respectively, due to non-responses.
2) hypertensive: SBP≥140 mmHg or DBP≥90 mmHg
3) anaemic: male Hb<13 g/dl, female Hb<12 g/dl
4) osteopaenic : -2.5<t-score<-1, osteoporotic: t-score≤-2.5
5) poor: dietary score<70, good: dietary score≥70
<200 mg/dl), normal hemoglobin level, osteopaenic, and osteoporosis were 63.5, 52.1, 84.1, 81.7, 37.6, and 37.2%, respectively (Table 3).
Approximately three-quarters of the subjects showed ‘good’
status with the dietary guidelines (74.1%), and 25.9% indicated
‘poor’ status (Table 3).
Approximately two-thirds of the subjects were not aware of the guidelines; the awareness rate was only 32.2%. However, a majority (77.4%) recognised the necessity for the dietary guidelines (Table 3).
Factors affecting awareness and the perceived necessity of the dietary guidelines
1) Distribution of subjects’ awareness
Sociodemographic characteristics such as age, education, and marital status were significant variables (Table 4). Respondents
who were adult (41.4%), higher educated (51.3%), and with a spouse (36.9%) had higher awareness than their counterparts.
Among the health indicators, bone density was the only significant variable. Awareness rates for normal, osteopaenic, and osteoporotic were 50.7, 30.3, and 21.5%, respectively.
Dietary status was not a significant variable, although subjects with good status tended to have a higher awareness rate (33.2%) than subjects with poor status (29.3%).
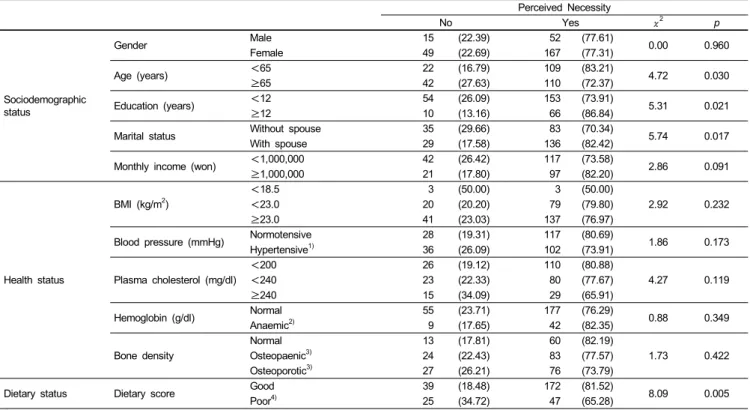
2) Distribution of subjects’ perceived necessity
Sociodemographic characteristics such as age, education, and marital status were significant variables (Table 5). Respondents who were adult (83.2%), higher educated (86.8%), and married (82.4%) perceived the guidelines to be more necessary than individuals who were elderly (72.4%), lower educated (73.9%), and without a spouse (70.3%). Subjects with lower income had marginally lower perceived necessity (p<0.1; Table 5).
No health status variables were significant. Regarding dietary status, participants with a good status thought the guidelines were necessary (81.5%), whereas subjects with a poor status were less likely to find them necessary (65.3%).
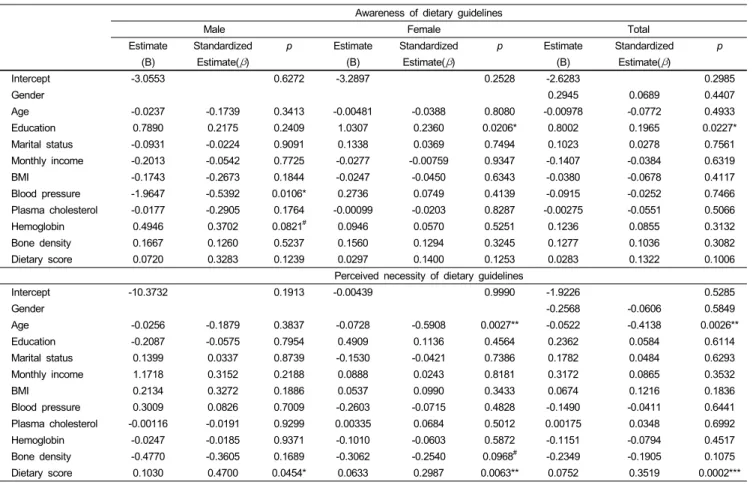
3) Factors affecting awareness and the perceived necessity of the dietary guidelines
Table 6 summarizes the logistic regression results. The analysis of the subjects’ awareness is given in the upper part of Table 6. Education had a significant and positive influence on the awareness. In males, blood pressure was the most significant variable and had a negative influence. Hemoglobin level was the next most significant and had a positive influence. In females, education was the most significant variable and showed a positive influence (Table 6).
An estimation of the perceived necessity results are given in the lower part of Table 6. Age was negatively correlated; dietary score was positively correlated. In males, the dietary score was significant and positive. In females, age and dietary score were significant and bone density was marginally significant (p<0.1).
Age and bone density were negative, but the dietary score was positive (Table 6).
Discussion
This study researched subjects’ awareness of the dietary guidelines and their perception of the guidelines’ necessity, and identified factors affecting awareness and perceived necessity.
More than double the subjects were not aware of the dietary guidelines (67.8%) than were aware (32.2%). Subjects’ awareness in our study was slightly higher than noted in a previous report from Korea (23.1%; Moon, 2003), but it was lower than the 45%
reported in a study in the United States (Keenan et al., 2002).
Dietary guidelines do not appear to be sufficiently disseminated among the Korean population.
Table 4. Distribution of the subjects’ awareness of dietary guidelines n (%)
Awareness
No Yes χ2 p
Sociodemographic status
Gender Male 44 (65.67) 23 (34.33)
0.18 0.668
Female 152 (68.47) 70 (31.53)
Age (years) <65 78 (58.65) 55 (41.35)
9.50 0.002
≥65 118 (75.64) 38 (24.36)
Education (years) <12 159 (74.65) 54 (25.35)
17.30 0.000
≥12 37 (48.68) 39 (51.32)
Marital status Without spouse 90 (74.38) 31 (25.62)
4.10 0.043
With spouse 106 (63.10) 62 (36.90)
Monthly income (won) <1,000,000 114 (70.37) 48 (29.63)
1.43 0.232
≥1,000,000 77 (63.64) 44 (36.36)
Health status
BMI (kg/m2)
<18.5 3 (50.00) 3 (50.00)
2.14 0.343
<23.0 64 (64.00) 36 (36.00)
≥23.0 129 (70.49) 54 (29.51)
Blood
Pressure (mmHg)
Normotensive 99 (65.56) 52 (34.44)
0.74 0.390
Hypertensive1) 97 (70.29) 41 (29.71)
Plasma cholesterol (mg/dl)
<200 90 (64.75) 49 (35.25)
2.91 0.233
<240 70 (67.31) 34 (32.69)
≥240 36 (78.26) 10 (21.74)
Hemoglobin (g/dl) Normal 159 (67.37) 77 (32.63)
0.12 0.731
Anaemic2) 37 (69.81) 16 (30.19)
Bone density
Normal 36 (49.32) 37 (50.68)
17.23 0.000
Osteopaenic3) 76 (69.72) 33 (30.28)
Osteoporotic3) 84 (78.50) 23 (21.50)
Dietary status Dietary score Good 143 (66.82) 71 (33.18)
0.38 0.540
Poor4) 53 (70.67) 22 (29.33)
1) hypertensive: SBP≥140 mmHg or DBP≥90 mmHg
2) anaemic: male Hb<13 g/dl, female Hb<12 g/dl
3) osteopaenic: -2.5<t-score<-1, osteoporotic: t-score≤-2.5
4) poor: dietary score<70, good: dietary score≥70
Table 5. Distribution of the subjects’ perceived necessity of dietary guidelines n (%)
Perceived Necessity
No Yes χ2 p
Sociodemographic status
Gender Male 15 (22.39) 52 (77.61)
0.00 0.960
Female 49 (22.69) 167 (77.31)
Age (years) <65 22 (16.79) 109 (83.21)
4.72 0.030
≥65 42 (27.63) 110 (72.37)
Education (years) <12 54 (26.09) 153 (73.91)
5.31 0.021
≥12 10 (13.16) 66 (86.84)
Marital status Without spouse 35 (29.66) 83 (70.34)
5.74 0.017
With spouse 29 (17.58) 136 (82.42)
Monthly income (won) <1,000,000 42 (26.42) 117 (73.58)
2.86 0.091
≥1,000,000 21 (17.80) 97 (82.20)
Health status
BMI (kg/m2)
<18.5 3 (50.00) 3 (50.00)
2.92 0.232
<23.0 20 (20.20) 79 (79.80)
≥23.0 41 (23.03) 137 (76.97)
Blood pressure (mmHg) Normotensive 28 (19.31) 117 (80.69)
1.86 0.173
Hypertensive1) 36 (26.09) 102 (73.91)
Plasma cholesterol (mg/dl)
<200 26 (19.12) 110 (80.88)
4.27 0.119
<240 23 (22.33) 80 (77.67)
≥240 15 (34.09) 29 (65.91)
Hemoglobin (g/dl) Normal 55 (23.71) 177 (76.29)
0.88 0.349
Anaemic2) 9 (17.65) 42 (82.35)
Bone density
Normal 13 (17.81) 60 (82.19)
1.73 0.422
Osteopaenic3) 24 (22.43) 83 (77.57)
Osteoporotic3) 27 (26.21) 76 (73.79)
Dietary status Dietary score Good 39 (18.48) 172 (81.52)
8.09 0.005
Poor4) 25 (34.72) 47 (65.28)
1) hypertensive: SBP≥140 mmHg or DBP≥90 mmHg
2) anaemic: male Hb<13 g/dl, female Hb<12 g/dl
3) osteopaenic: -2.5<t-score<-1, osteoporotic: t-score≤-2.5
4) poor: dietary score<70, good: dietary score≥70
Table 6. Association between general characteristics and awareness and perceived necessity by gender
Awareness of dietary guidelines
Male Female Total
Estimate Standardized p Estimate Standardized p Estimate Standardized p
(B) Estimate(β) (B) Estimate(β) (B) Estimate(β)
Intercept -3.0553 0.6272 -3.2897 0.2528 -2.6283 0.2985
Gender 0.2945 0.0689 0.4407
Age -0.0237 -0.1739 0.3413 -0.00481 -0.0388 0.8080 -0.00978 -0.0772 0.4933
Education 0.7890 0.2175 0.2409 1.0307 0.2360 0.0206* 0.8002 0.1965 0.0227*
Marital status -0.0931 -0.0224 0.9091 0.1338 0.0369 0.7494 0.1023 0.0278 0.7561
Monthly income -0.2013 -0.0542 0.7725 -0.0277 -0.00759 0.9347 -0.1407 -0.0384 0.6319
BMI -0.1743 -0.2673 0.1844 -0.0247 -0.0450 0.6343 -0.0380 -0.0678 0.4117
Blood pressure -1.9647 -0.5392 0.0106* 0.2736 0.0749 0.4139 -0.0915 -0.0252 0.7466
Plasma cholesterol -0.0177 -0.2905 0.1764 -0.00099 -0.0203 0.8287 -0.00275 -0.0551 0.5066
Hemoglobin 0.4946 0.3702 0.0821# 0.0946 0.0570 0.5251 0.1236 0.0855 0.3132
Bone density 0.1667 0.1260 0.5237 0.1560 0.1294 0.3245 0.1277 0.1036 0.3082
Dietary score 0.0720 0.3283 0.1239 0.0297 0.1400 0.1253 0.0283 0.1322 0.1006
Perceived necessity of dietary guidelines
Intercept -10.3732 0.1913 -0.00439 0.9990 -1.9226 0.5285
Gender -0.2568 -0.0606 0.5849
Age -0.0256 -0.1879 0.3837 -0.0728 -0.5908 0.0027** -0.0522 -0.4138 0.0026**
Education -0.2087 -0.0575 0.7954 0.4909 0.1136 0.4564 0.2362 0.0584 0.6114
Marital status 0.1399 0.0337 0.8739 -0.1530 -0.0421 0.7386 0.1782 0.0484 0.6293
Monthly income 1.1718 0.3152 0.2188 0.0888 0.0243 0.8181 0.3172 0.0865 0.3532
BMI 0.2134 0.3272 0.1886 0.0537 0.0990 0.3433 0.0674 0.1216 0.1836
Blood pressure 0.3009 0.0826 0.7009 -0.2603 -0.0715 0.4828 -0.1490 -0.0411 0.6441
Plasma cholesterol -0.00116 -0.0191 0.9299 0.00335 0.0684 0.5012 0.00175 0.0348 0.6992
Hemoglobin -0.0247 -0.0185 0.9371 -0.1010 -0.0603 0.5872 -0.1151 -0.0794 0.4517
Bone density -0.4770 -0.3605 0.1689 -0.3062 -0.2540 0.0968# -0.2349 -0.1905 0.1075
Dietary score 0.1030 0.4700 0.0454* 0.0633 0.2987 0.0063** 0.0752 0.3519 0.0002***
1) Independent variables: Gender (0 for males, 1 for females); age (continuous variable); education level (0 for less than 12 years, 1 for more than 12 years); marital status (0 = without a spouse, 1 = with a spouse); monthly income level (0 for<1,000,000 Korean won per month (≑US $1,000), 1 for≥1,000,000; BMI (continuous variable);
blood pressure (0 = normotensive, 1 = hypertensive); plasma cholesterol (continuous variable); hemoglobin (continuous variable); bone density (continuous variable); dietary score (continuous variable)
2) #p<0.1; *p<0.05; **p<0.01; ***p<0.001
The guidelines were perceived as necessary by 3.4 times more people (77.4%) than those who thought them unnecessary (22.6%). Because the majority of those surveyed had a high interest in the guidelines, more Koreans would likely be in compliance with the guidelines if the public was better informed and educated about them.
According to the chi-square tests, age, education, and marital status were the significant sociodemographic factors determining people’s awareness and perceived necessity. The elderly, subjects with lower education, and those without a spouse showed significantly low awareness (75.6, 74.7, and 74.4%, respectively;
Table 4) and low perceived necessity (Table 5) compared to their counterparts. Most people who were not aware of the dietary guidelines thought the guidelines unnecessary. Hence, strategies to raise individual awareness and perceived necessity should be developed to improve the diets of Koreans.
The variable with the largest influence on awareness of females (β= 0.2360, p<0.05, Table 6) and all subjects (β= 0.1965, p<0.05, Table 6) was education. Therefore, dissemi- nating dietary guidelines through traditional school or com- munity education systems would be efficient. Perceived necessity
was low among the elderly females (β= -0.5908, p<0.01, Table 6). Public education strategies would help these individuals understand the benefits of the guidelines. Elderly females with less education had the lowest scores, so particular attention should be paid to this group.
Dynesen et al. (2003) reported an association between low compliance with the guidelines and lower education levels and being in a family without a spouse or child. Our results were consistent with those findings. However, whilst elderly females were likely to follow the guidelines in Dynesen et al.’s (2003) report, this was not true in our study.
Subjects with lower monthly income had lower perceived necessity (Table 5) at a relatively attenuated significance level (p<0.1). It has been reported that lower household income negatively affects adherence to the dietary guidelines (Turrell et al., 2002), in accordance with our study. Therefore, low income families should be a target group for education programs, and these programs should help them find an affordable way to satisfy recommended dietary intakes.
Health indicators influenced the subjects’ awareness and perceived necessity of the guidelines. Subjects with lower bone
density (Table 4) and males with higher blood pressure showed lower awareness (β= -0.5392, p<0.05, Table 6). Females with lower bone density indicated lower perceived necessity (β= -0.254, p<0.1, Table 6). Nayga and Capps (1999) found that persons with a higher BMI were less likely to perceive the importance of a diet that adheres to the dietary guidelines. In our study, however, health status variables, including BMI, were not significant, although higher BMI, higher blood pressure, higher cholesterol, lower hemoglobin level, and lower bone density were negatively associated with awareness, and positively associated with perceived necessity with the exception of blood pressure (Table 6). Individuals in poor health were less likely than their healthier counterparts to be aware of the guidelines, but were more likely to consider them important. Therefore, individuals who have health problems should be a target group for the education programs.
In conclusion, information about the dietary guidelines has not spread to the people who need them most. Providing education about the guidelines and propagating them to target populations is the first step toward promoting a healthy diet at the national level. Although the study had a relatively small sample size, we suggest the following. First, because awareness about the dietary guidelines is much lower than the perceived necessity, systematic education and dissemination of the guidelines is urgently needed.
Second, in addition to a population-wide education campaign, the following subpopulations should be targeted: the elderly, the poorly educated, the underprivileged, and individuals who live alone, are unhealthy, or have poor dietary habits. Third, it is essential to develop educational strategies to facilitate compliance by these subpopulations.
Literature cited
Achterberg CL (1994). Qualitative research: What do we know about teaching good nutritional habits? J Nutr 124:1808-1812.
Ball K, Mishra GD, Thane CW & Hodge A (2004). How well do Australian women comply with dietary guidelines? Public Health Nutr 7:443-452.
Dynesen AW, Haraldsdottir J, Holm L & Astrup A. (2003). Soci- odemographic differences in dietary habits described by food frequency questions-results from Denmark. Eur J Clin Nutr 57:
1586-1597.
Food and Agriculture Organization of the United Nations & World Health Organization (1996). Preparation and use of food-based dietary guidelines. WHO, Geneva. Switzerland
Kant AK, Schatzkin A, Graubard BI & Schairer C (2000). A pros- pective study of diet quality and mortality in women. JAMA 283:
2109-2115.
Keenan DP, AbuSabha R, Sigman-Grant M, Achterberg C & Green- span N (1999). Factors that influence dietary fat reduction beha- viors. J Nutr Educ 31:134-144.
Keenan DP, AbuSabha R & Robinson NG (2002). Consumers’ under- standing of the dietary guidelines for Americans: Insights into future. Health Educ Behav 29:124-135.
Korea Health Industry Development Institute (2002). Revision of Dietary Guidelines for Koreans (2002: With Actions Guides for Adults and Elders). Health Industry Development Institute, Seoul.
Republic of Korea
Moon EJ (2003). A survey on awareness and publicity information about dietary guidelines for Koreans. Master’s Thesis, Sangju University of Korea.
Nayga RM (1997). Impact of sociodemographic factors on perceived importance of nutrition in food shopping. J Consum Aff 31:1-9.
Nayga RM & Capps O (1999). US consumers’ perceptions of the importance of following the US dietary guidelines. Food Policy 24:553-564.
Turrell G, Hewitt B, Patterson C, Oldenburg B & Gould T (2002).
Socioeconomic differences in food purchasing behavior and suggested implications for diet-related health promotion. J Hum Nutr Diet 15:355-364.
Turrell G, Hewitt B, Patterson C & Oldenburg B (2003). Measuring socio-economic position in dietary research: Is choice of socio- economic indicator important? Public Health Nutr 6:191-200.
Turrell G, Blakely T, Patterson C & Oldenburg B (2004). A multi- level analysis of socioeconomic (small area) differences in house- hold food purchasing behavior. J Epidemiol Community Health 58:208-215.
Welsh S (1996). Nutrient standards, dietary guide-lines, and food guides. In: Ziegler EE & Filer LJ (Eds.), Present Knowledge in Nutrition, p.630-646. ILSI Press, Washington DC. USA