16
Open Access
Improvement in Left Ventricular Systolic Dyssynchrony in Hypertensive Patients After Treatment of Hypertension
Byung Seok Bae, MD, Ki Ju Kim, MD, Jung Gil Park, MD, Yeoun Su Jung, MD, Han Jun Ryu, MD, Hyun Jae Kang, MD, Bong Ryeol Lee, MD and Byung Chun Jung, MD
Department of Cardiology, Fatima General Hospital, Daegu, Korea ABSTRACT
Background and Objectives: Left ventricular (LV) dyssynchrony has been commonly detected among hypertensive pa- tients with normal LV systolic function and no evidence of congestive heart failure. The purpose of our study was to assess the changes in LV systolic dyssynchrony (SDSLV) among hypertensive patients after antihypertensive treatment, and to determine the relationship between SDSLV and other conventional echocardiographic parameters. Subjects and Methods: Forty one hypertensive patients with normal LV ejection fraction were enrolled. By performing a conventional echocardiographic study, the SDSLV was measured as the time difference between the shortest and longest time of the peak myocardial systolic velocities among 12 segments of the basal and mid-levels of the 3 apical views, and radial dyssynchrony of the basal (RDSbase) and mid- levels (RDSmid) measured as the time difference between the earliest and latest peak values on the radial strain curves of each level of the parasternal short-axis views. Results: Compared to baseline after six months of antihypertensive treatment, the SDSLV improved significantly (48.7±37.9 ms vs. 29.5±34.1 ms, p=0.020). Also the RDSbase and RDSmid improved significantly in respect to the baseline values (129.9±136.3 ms vs. 38.8±45.4 ms, p=0.002 and 75.2±63.8 ms vs. 28.2±37.7 ms, respectively, p<0.001). Conclusion: The severity of SDSLV improved with antihypertensive treatment, and was associated with the regres- sion of LV mass. Furthermore, it might precede improvement in the mitral inflow pattern, as assessed by conventional echocar- diography, so that early detection of the benefit of antihypertensive treatment may be possible. (Korean Circ J 2011;41:16-22) KEY WORDS: Hypertension; Left ventricular dyssynchrony.
Received: April 1, 2010
Revision Received: May 31, 2010 Accepted: June 21, 2010
Correspondence: Byung Chun Jung, MD, Department of Cardiology, Fatima General Hospital, 302-1 Sinam-dong, Dong-gu, Daegu 701-724, Korea
Tel: 82-53-940-7214, 940-7459, Fax: 82-53-954-7417 E-mail: Augustjbc@yahoo.co.kr
• The authors have no financial conflicts of interest.
cc This is an Open Access article distributed under the terms of the Cre- ative Commons Attribution Non-Commercial License (http://creativecom- mons.org/licenses/by-nc/3.0) which permits unrestricted non-commer- cial use, distribution, and reproduction in any medium, provided the origi- nal work is properly cited.
Introduction
Hypertension has been regarded as a major cause of heart failure with preserved left ventricular (LV) systolic function as well as increased incidence of cardiovascular events. In hypertensive patients, abnormal LV diastolic properties de- tected by echocardiographic studies are implicated in the main
underlying pathophysiologies.1) Also a subtle but detectable LV systolic impairment has been reported, frequently accom- panied by diastolic dysfunction despite a normal ejection frac- tion (EF).2)3) Furthermore, mechanical dyssynchrony of LV con- traction as measured by tissue Doppler imaging (TDI), as op- posed to QRS complex width, has evolved as a parameter for identifying patients with severely decreased LV systolic func- tion who might benefit from cardiac resynchronization thera- py (CRT) through the reverse remodeling of the deteriorat- ed LV.4)5) Recent studies have demonstrated that LV dyssyn- chrony is not confined to these patients and is widely found among patients with preserved LV systolic function.6)7) Furth- ermore, it is reported that LV systolic or diastolic dyssynchro- ny are commonly detected among hypertensive patients with a normal LV systolic function, even in patients with no evid- ence of congestive heart failure.8)
Whereas anatomical changes such as LV hypertrophy or en- largement in hypertensive patients have been known to regress as blood pressure is lowered, it has not been well determined
whether LV dyssynchrony can be improved or not. The pur- pose of this study was to assess the changes in LV systolic dys- synchrony (SDSLV) among hypertensive patients after antihy- pertensive treatment, and to determine the relationship be- tween SDSLV and other conventional echocardiographic pa- rameters.
Subjects and Methods
Subjects
Newly diagnosed hypertensive patients, who needed antihy- pertensive medication according to the “Seventh Report of the Joint National Committee” guidelines,9) were enrolled into the study during echocardiography and confirmed as eligible for TDI and two dimensional speckle tracking image (2D- STI). Patients with a decreased left ventricular ejection frac- tion (LVEF: <50%) or symptoms of heart failure according to the Framingham criteria10) were excluded. Exclusion crite- ria were moderate to severe valvular heart disease, atrial fibril- lation, a bundle branch block pattern on the surface electro- cardiogram (ECG), cardiomyopathies on echocardiography, and coronary artery disease by a clinical assessment. A total of 41 patients were enrolled.
Blood pressure measurement and treatment
While screening, a sitting blood pressure was measured three times using a manual cuff and stethoscope, with at least five minute intervals between each measurement, after resting for more than five minutes. The study eligibility required an average systolic blood pressure (SBP) of more than 160 mmHg or an average diastolic blood pressure (DBP) of more than 100 mmHg. Combination therapy was initially prescribed using angiotensin II receptor blockers (ARBs) with hydrochlorothi- azide. The average SBP and DBP were evaluated at two week intervals until a target blood pressure level that was recom- mended by the “Seventh Report of the Joint National Com- mittee” guidelines was reached. Calcium channel blockers (CCBs) were added when the initial combination therapy did not achieve the target blood pressure level. The outcome of the antihypertensive treatment was assessed six months later.
Blood chemistry examinations and echocardiographic st- udies were performed twice, once at the initial enrollment and once after six months.
Conventional echocardiographic study
Two-dimensional and Doppler echocardiographic studies were performed using a 3.5 MHz transducer (Vivid 7, Ving- med-General Electric, Horten, Norway). The LVEF was mea- sured in the apical 4-, and 2-chamber views using a modified Simpson’s formula. A preserved LVEF was regarded as an EF greater than or equal to 50%. The wall-motion score index was also examined in order to rule out any patients with regional
wall motion abnormalities. As described in a previous study,11) pulsed-wave Doppler echocardiography was conducted in the apical 4-chamber view to obtain the mitral inflow profile measurements such as E-, A-wave velocity, E-deceleration time, and E/A ratio. TDI was also performed with a 1-2 mm sample volume at the septal side of the mitral annulus from the apical 4-chamber view in order to measure the systolic and dia- stolic mitral annulus velocities.
Assessment of left ventricular systolic dyssynchrony using tissue Doppler imaging and two dimensional speckle tracking image
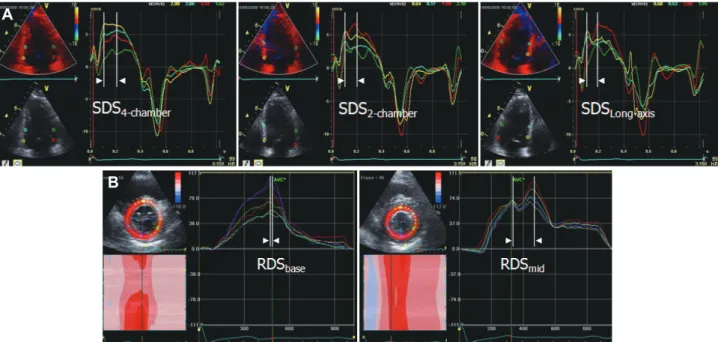
After at least three consecutive beats were stored during the conventional echocardiographic studies, the images were an- alyzed offline with the aid of a customized software package (EchoPac, version 5.1.1, Vingmed-General Electric). To assess the SDSLV, the peak myocardial systolic velocity of the tissue Doppler signal was measured using the onset of the QRS com- plex as the reference point wherein the basal segments were scanned just above the mitral annulus, and the mid segments at the papillary muscle level. SDSLV was defined as a time dif- ference between the shortest and longest time of the peak myo- cardial systolic velocities among the 12 segments (Fig. 1A).
At the basal and papillary muscle level of the short-axis view, routine gray scale images were also acquired to obtain the 2D-STI data as previously described in detail.12)13) An end-sys- tolic circular region of interest (ROI) was traced through the cardiac border using a point-and-click technique to adjust the tracking of all 6 segments. The location shift of the acoustic markers (speckles) in the ROI from frame to frame, which re- presented tissue movement, provided the spatial and tempo- ral data for calculating the velocity vectors as moving further apart or closer together. A series of regional strain vectors were calculated as the changes in the length independent of the in- itial length. Myocardial thickening was represented as a pos- itive value of the strain, whereas myocardial thinning was re- presented as a negative value of the strain. The customized software package automatically analyzed and presented the radial strain curves of each segment, which were used to assess the radial dyssynchrony defined as the time difference be- tween the earliest and latest peak values on the radial strain curves of each level (RDSbase, and RDSmid for the radial dyssy- chrony of the mitral and papillary muscle levels of the parast- ernal short-axis view, respectively) (Fig. 1B).
Statistical analysis
Continuous data were presented as the mean value±stan- dard deviation unless otherwise stated. The comparisons of the means between the initial and six month values were con- ducted by the paired t-test, and chi-square test for comparing categorical data. The relationship between the continuous variables was analyzed using a regression analysis, and the sel-
ection of the most powerful factor was performed using a forward stepwise multivariate analysis (Statistical Package for the Social Sciences version 17). A p ≤0.05 was used to define a significant result.
Interobserver and intraobserver variability were tested by independent analysis by two independent observers and by repeated measurement of these segments on another occasion by the same observer. To quantify the interobserver and in- traobserver variability, the figure was expressed using Pear- son’s correlation coefficient and also as the percentage (%) of the measured value as compared with the mean value.
Results
Baseline characteristics
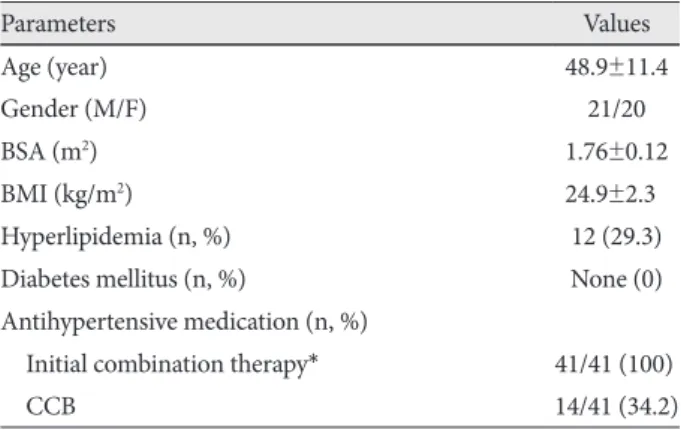
The study included 20 women and 21 men: 41 patients in total. The mean age was 48.9±11.4 years ranging from 24 to 74 years. The mean body surface area and body mass index were 1.76±0.12 m2 and 24.9±2.3 kg/m2, respectively. Twelve
patients had hyperlipidemia, and none had diabetes mellitus.
For the initial management of the hypertension, a combina- tion therapy (ARBs with diuretics) was prescribed for all pa- tients. Fourteen patients additionally required CCBs to achi- eve the target blood pressure level (Table 1).
The initial SBP and DBP of the patients were 165.6±19.4 mmHg and 102.2±13.6 mmHg, respectively (mean BP: 123.3±
12.6 mmHg, pulse pressure: 65.6±15.6 mmHg). The QRS du- ration and PR interval were 98.3±12.7 ms and 168.9±22.9 ms, respectively. According to the criteria of Sokolow and Lyon,14) 25 of the patients presented with a left ventricular hypertro- phic (LVH) pattern on the surface ECG (Table 1).
Changes in the hemodynamics, surface electrocardiogram parameters and pro B-type natriuretic peptide level after the
antihypertensive treatment
After the antihypertensive treatment, the SBP and DBP av- eraged 131.9±5.4 mmHg and 82.5±9.1 mmHg respectively.
A
B
Fig. 1. A: tissue Doppler time-velocity curves were derived from 12 segments measured at basal and mid levels from 4-, 2-chamber and long- axis views. A time difference between the shortest and longest time of the peak myocardial systolic velocities among the 12 segments was de- fined as LV systolic dyssynchrony (SDSLV). B: speckle tracking time-strain curves of six-radial sites were measured from mitral (RDSbase) and papillary muscle levels (RDSmid) of parasternal short axis views.
Fig. 2. Individual changes in dyssynchrony from baseline to the end of six months antihypertensive treatment. The improvement was noted in LV systolic dyssynchrony measured by tissue Doppler image (A), and also radial dyssynchrony in mitral (B) and papillary muscle level (C) as measured by 2D-STI. LV: left ventricle, 2D-STI: two dimensional speckle tracking image.
400 300 200 100 0
500 400 300 200 100 0
200 150 100 50 0
Baseline Six months later Baseline Six months later Baseline Six months later
LV systolic dyssynchrony (ms) Radial dyssynchrony (mitral level, ms) Radial dyssynchrony (papillary level, ms)
C B
A
These were significantly decreased (p<0.001, and p<0.001 res- pectively) and achieved the target blood pressure level. Also, the mean BP and pulse pressure decreased significantly (123.3±
12.6 mmHg vs. 98.9±7.3 mmHg, p<0.001 and 65.6±15.6 mmHg vs. 49.4±7.2 mmHg, p<0.001, respectively). The QRS duration and PR interval had no significant changes while the LVH pattern decreased with marginal significance {25 (60.9%) vs. 12 (29.3%), p=0.070} (Table 2, Upper panel).
The level of pro B-type natriuretic peptide (pro-BNP) de- creased from 142.6±294.7 pg/mL to 39.9±43.6 pg/mL with marginal significance after the antihypertensive treatment (p=
0.053) (Table 2, Middle panel).
Analysis of the conventional echocardiographic parameters
The LV septal and posterior wall thicknesses during the end diastolic period significantly decreased after the antihyper- tensive treatment (1.15±0.19 cm vs. 1.07±0.14 cm, p=0.017 and 1.13±0.18 cm vs. 1.04±0.13 cm, p=0.031, respectively) wh- ereas the LV dimension did not. In addition, the LV mass re- gressed significantly (227.6±57.5 g vs. 199.6 ±37.9 g, p=0.002), but the left atrial dimension represented no meaningful re- gression (Table 2, Lower panel). Furthermore, in the present study, among the parameters of blood pressure, the amount of regression in the LV mass was well correlated with the de- gree of decrease in the SBP {confidence interval (CI): 0.469- 3.145, β=0.495, p=0.010}.
In the pulsed-wave Doppler study, the parameters related to the mitral inflow patterns, as above-mentioned, did not show any significant alterations. However, the peak early di- astolic mitral annulus velocity (E’) and the ratio of the peak early diastolic mitral flow velocity to E’ (E/E’ ratio) exhibited a significant improvement in the TDI study (6.7±2.5 cm/sec vs. 8.0±2.6 cm/sec, p=0.017 and 13.0±4.9 cm/sec vs. 9.8±3.5 cm/sec, p=0.002) while the peak early systolic (Sm) and late
diastolic annulus velocity (A’) did not show any meaningful changes (Table 2, Lower panel).
Analysis of left ventricular the longitudinal dyssynchrony using tissue Doppler imaging
The SDSLV exhibited a significant improvement after the an- Table 1. Baseline characteristics of hypertensive patients
Parameters Values
Age (year) 48.9±11.4
Gender (M/F) 21/20
BSA (m2) 1.76±0.12
BMI (kg/m2) 24.9±2.30
Hyperlipidemia (n, %) 12 (29.3)
Diabetes mellitus (n, %) None (0)
Antihypertensive medication (n, %)
Initial combination therapy* 41/41 (100)
CCB 14/41 (34.2)
Calcium channel blockers (CCBs) were added when a target blood pressure was not achieved that was recommended by the “Seventh Report of the Joint National Committee” guidelines. *The initial com- bination therapy was composed of angiotensin II receptor blockers (ARBs) with hydrochlorothizide in all patients. M: male, F: female, BSA: body surface area, BMI: body mass index
Table 2. Changes in blood pressure, surface ECG, pro-BNP level and conventional echocardiographic parameters before and after antihypertensive treatment
Baseline After treatment p Blood pressure
Blood pressure (mmHg)
Systolic blood pressure 165.6±19.4 131.9±5.40 <0.001 Diastolic blood pressure 102.2±13.6 82.5±9.1 <0.001 Mean blood pressure 123.3±12.6 98.9±7.3 <0.001 Pulse pressure 065.6±15.6 49.4±7.2 <0.001 Surface ECG parameters
Heart rate (bpm) 72.1±9.2 69.1±7.5 0.123 QRS duration (ms) 098.3±12.7 097.8±14.2 0.802 LVH pattern (n, %) 25 (60.9) 12 (29.3) 0.070 PR interval (ms) 168.9±22.9 170.9±22.1 0.446 S in V1 (V2)+
R in V5 (V6) (mV) 038.8±10.9 32.5±7.8 0.001
R in aVL (mV) 06.8±4.2 05.2±3.6 0.004
NT-proBNP level (pg/mL)0142.6±294.7 039.9±43.6 0.053 Echocardiographic parameters
LVEF (%) 60.9±9.4 63.4±6.3 0.189
dLVST (cm) 01.15±0.19 01.07±0.14 0.017 dLVPWT (cm) 01.13±0.18 01.04±0.13 0.031
dLVD (cm) 05.08±0.54 05.01±0.41 0.356
LV mass (g) 227.6±57.5 199.6±37.9 0.002
LAD (cm) 03.82±0.49 03.75±0.42 0.275
E (cm/sec) 077.7±17.2 076.0±15.6 0.706
A (cm/sec) 077.7±20.1 073.0±18.3 0.107
E/A ratio 01.05±0.35 01.09±0.30 0.613
DT (ms) 211.3±42.7 0.217±38.5 0.558
IVRT (ms) 096.3±18.6 090.7±14.1 0.248
Sm (cm/sec) 08.0±1.9 08.4±2.2 0.389
E’ (cm/sec) 06.7±2.5 08.0±2.6 0.017
A’ (cm/sec) 09.6±1.7 09.7±2.1 0.843
E/E’ ratio 13.0±4.9 09.8±3.5 0.002
ECG: electrocardiogram, NT-proBNP: N-terminal pro B-type natri- uretic peptide, LVH: left ventricular hypertrophy, LVH pattern was diagnosed by the criteria of Sokolow-Lyon, LVEF: left ventricular ejection fraction, dLVST: diastolic LV septal thickness, dLVPWT: di- astolic LV posterior wall thickness, dLVD: diastolic LV dimension, LAD: left atrial dimension, E: peak early diastolic mitral flow veloci- ty, A: peak late diastolic mitral flow velocity, DT: deceleration time, IVRT: isovolemic relaxation time, Sm: peak early systolic mitral an- nulus velocity, E’: peak early diastolic mitral annulus velocity, A’: peak late diastolic mitral annulus velocity
tihypertensive treatment when compared to the baseline (48.7
±37.9 ms vs. 29.5±34.1 ms, p=0.020) (Table 3). However, the degree of improvement of the SDSLV did not demonstrate a correlation to the amount of regression in the LV mass or the degree of decrease in the other blood pressure parameters, such as the amount of change of SBP, DBP, and pulse pres- sure between before and after the treatment, in the multivari- ate regression analysis (Fig. 2A).
Analysis of the left ventricular radial dyssynchrony The RDSbase and RDSmid exhibited a significant improve- ment compared with baseline (129.9±136.3 ms vs. 38.8±45.4 ms, p=0.002 and 75.2±63.8 ms vs. 28.2±37.7 ms, respectively, p<0.001) (Table 3). In the multivariate regression analysis, the degree of improvement in the RDSbase correlated to the degree of the decrease of SBP (CI: 0.981-7.372, β=0.482, p=0.013) despite lack of correlation among the variations of other pa- rameters. Further, the degree of improvement in the RDSmid
had no correlation to the variation of any parameters mention- ed above (Fig. 2B and C).
Prevalence of left ventricular systolic dyssynchrony before and after antihypertensive treatment
Using 100 ms as a cut-off value for SDSLV, as proposed by Yu et al.7) no cases of SDSLV were seen in this study. A mean- ingful radial dyssynchrony was defined as more than 130 ms by Suffoletto et al.12) According to that criterion, radial dys- synchrony was found in 16 cases at the mitral level and in 14 cases at the papillary muscle level in the baseline study while only two cases were accounted for at the mitral level after the antihypertensive treatment.
Interobserver and intraobserver variability
Baseline analysis of interobserver and intraobserver vari- ability were r=0.94 (7.7%) and r=0.81 (8.0%) for SDSLV, r=0.92 (5.4%) and r=0.96 (7.2%) for RDSmid, r=0.82 (6.5%) and r=0.91 (7.2%) for RDSbase. After antihypertensive treat-
ment, interobserver and intraobserver variability were r=0.93 (6.3%) and r=0.94 (7.3%) for SDSLV, r=0.95 (6.5%) and r=
0.94 (7.3%) for RDSmid, r=0.98 (6.7%) and r=0.99 (7.8%) for RDSbase.
Discussion
The present study demonstrated that the SDSLV in hyper- tensive patients can be improved by lowering blood pressure.
At first, electrical dyssynchrony caused by left bundle branch block has been discerned to lead to further deterioration of LV systolic function in congestive heart failure, and is regard- ed as a surrogate for CRT.15) However, a widening of the QRS duration did not necessarily identify responders to CRT and a narrow QRS duration did not guarantee the absence of me- chanical dyssynchrony in later studies.16)17) Furthermore, a number of myocardial imaging techniques based on echo- cardiography have been proven to be valuable for assessing me- chanical dyssynchrony. Besides patients with systolic heart failure (SHF) or wide QRS complexes, LV systolic or diastol- ic dyssynchrony evaluated through these myocardial imag- ing techniques has been revealed to be more prevalent than expected with prevalences of 25.0% or 21.7%, respectively, in patients with a preserved LV systolic function (EF >50%), and they did not occur in parallel.7) While, for the purpose of a diagnosis, the threshold or cut-off value of dyssynchrony was arbitrarily determined to result in a prevalence of less than 5% of the normal population in the previous studies, the dys- synchrony itself was not an all-or-none phenomenon, but a continuous variable reflecting the discordance of the myo- cardial movement. Despite the variations in the cut-off values in the previous studies, dyssynchrony has a tendency to be less frequently observed in patients with diastolic heart failure (DHF) than in those with SHF, as well as being less common, but not rare, in the normal population.18) Wang et al.19) report- ed that medical therapy can improve LV dyssynchrony in pa- tients with DHF, but not SDSLV. This finding suggests that the pathophysiology of the LV dyssynchrony might, in part, be composed of reversible components depending on the cardi- ac status. To the best of our knowledge, there have been no st- udies evaluating the effects of antihypertensive treatment on the change in SDSLV among patients without heart failure. In the present study, performed in hypertensive patients with pre- served LV systolic function, improvement in the SDSLV after antihypertensive treatment was seen when measured by the longitudinal and radial aspects.
In hypertensive patients, an abnormal LV relaxation with an elevated LV filling pressure secondary to a stiff, hypertro- phied ventricle has been regarded as a cause of diastolic dys- function. Recently, Yang et al.8) reported that SDSLV is com- mon among hypertensive patients with a normal LV systolic function and no evidence of congestive heart failure when com- Table 3. Comparison of the values of the LV longitudinal systolic
and radial dyssynchrony before and after antihypertensive treat- ment
Baseline After treatment p LV Longitudinal systolic dyssynchrony using TDI (ms)
SDSLV 48.7±37.9 29.5±34.1 0.020
RR interval 873.9±121.9 910.5±146.7 0.203 LV radial dyssynchrony using 2D-STI (ms)
RDSbase 129.9±136.3 38.8±45.4 0.002
RDSmid 75.2±63.8 28.2±37.7 <0.001
RR interval 848.2±152.6 896.0±131.4 0.123 LV: left ventricle, RDS: radial dyssynchrony, Rot: rotation, SDSLV: systolic LV intraventricular dyssynchrony, TDI: tissue Doppler im- age, 2D-STI: two dimensional speckle tracking image
pared to normotensive controls: SDSLV was assessed by the
“maximum T-P”, which is the maximal difference in the inter- val from the onset of the QRS complex to the peak of the sys- tolic velocity on the pulsed tissue Doppler waveform in the 3 apical views, and deterioration of the LV synchrony seems to be associated with the LV remodeling process. Wang et al.20) reported that exercise could aggravate the SDSLV in hyperten- sive patients when comparing those in a post-exercise state with those in a resting state. This finding suggests that an in- crease in the LV wall tension caused by an elevation in blood pressure during exercise could result in a temporal deteriora- tion of the LV synchrony in susceptible conditions. Also a po- sitive correlation with the N-terminal pro-BNP (NT-proBNP) level was found between the resting and post-exercise states.
In the present study, the level of NT-proBNP tended to decre- ase with marginal significance after antihypertensive treat- ment.
We submit two possible mechanisms for the improvement in SDSLV. The first possibility is the the regression in LV hyper- trophy that was observed in the present study, resulting in the decrease of LV mass from 227.6±57.5 g at baseline to 199.6±
37.9 g after antihypertensive therapy. However, the degree of regression of LV mass after antihypertensive treatment, de- pendent on individual susceptibility, varied between patients to such an extent that we were unable to find an obvious lin- ear correlation between the reduction of LV mass and the im- provement of LV dyssynchrony. The second possible expla- nation is that the effect of lowering BP itself accounted to some extent for the immediate restoration of the LV synchrony, re- gardless of the regression in the LV hypertrophy, because de- creased LV wall stress could ameliorate any regional hetero- geneity of the coronary blood flow and regional wall motion.
Additionally, in the conventional echocardiographic stud- ies, the pulsed-Doppler parameters of the mitral inflow and LVEF did not change significantly after antihypertensive th- erapy. But the parameters related with mitral annulus veloci- ty such as E’, and E/E’ ratio were improved after antihyperten- sive treatment in the TDI study, which suggested that LV dia- stolic function improved with antihypertensive treatment.
Also, improvements in the SDSLV were elucidated by the TDI and 2D-STI studies. Therefore, as a clinical implication, meas- urement of longitudinal or radial dyssynchrony could be used for the early detection of any improvement in the LV mech- anical function during antihypertensive treatment.
Study limitations
The number of patients was relatively small in the present study. Therefore, it was not possible to elucidate the quantita- tive relationship between the degree of improvement in the SDSLV and the amount of regression of LV hypertrophy. An ex- amination with a larger number of patients is warranted to achieve a more accurate representation of improvement in
SDSLV associated with antihypertensive treatment.
In conclusion, the degree of SDSLV can be improved by an- tihypertensive treatment. Furthermore, it might precede an im- provement in the pulsed-Doppler parameters of mitral in- flow, so that early detection of the benefit of antihypertensive treatment for LV myocardium may be possible.
REFERENCES
1) Zile MR, Brutsaert DL. New concepts in diastolic dysfunction and dia- stolic heart failure: I. diagnosis, prognosis, measurements of diastolic function. Circulation 2002;105:1387-93.
2) Poulsen SH, Anderson NH, Ivarsen PI, Mogensen CE, Egeblad H.
Doppler tissue imaging reveals systolic dysfunction in patients with hy- pertension and apparent “isolated” diastolic dysfunction. J Am Soc Echocardiogr 2003;16:724-31.
3) Aurigemma GP, Silver KH, Priest MA, Gaasch WH. Geometric ch- anges allow normal ejection fraction despite depressed myocardial sh- ortening in hypertensive left ventricular hypertrophy. J Am Coll Car- diol 1995;26:195-202.
4) Penicka M, Bartunek J, De Bruyne B, et al. Improvement of left ven- tricular function after cardiac resynchronization therapy is predicted by tissue Doppler imaging echocardiography. Circulation 2004;109:
978-83.
5) Leclercq C, Faris O, Tunin R, et al. Systolic improvement and mechan- ical resynchronization does not require electrical synchrony in the di- lated failing heart with left bundle-branch block. Circulation 2002;
106:1760 -3.
6) Wang J, Kurrelmeyer KM, Torre-Amione G, Nagueh SF. Systolic and diastolic dyssynchrony in patients with diastolic heart failure and the effect of medical therapy. J Am Coll Cardiol 2007;49:88-96.
7) Yu C-M, Zhang Q, Yip GWD, et al. Diastolic and systolic asynchro- ny in patients with diastolic heart failure. J Am Coll Cardiol 2007;49:
97-105.
8) Yang B, Chettiveettil D, Jones F, Aguero M, Lewis JF. Left ventricular dyssynchrony in hypertensive patients without congestive heart fail- ure. Clin Cardiol 2008;31:597-601.
9) Chobanian AV, Bakris GL, Black HR, et al. Seventh report of the Joint National Committee on Prevention, Detection, Evaluation, and Treat- ment of High Blood Pressure. JAMA 2003;289:2560-72.
10) McKee PA, Castelli WP, McNamara PM, Kannel WB. The natural his- tory of congestive heart failure: the Framingham study. N Engl J Med 1971;285:1441-6.
11) Ommen SR, Nishimura RA, Appleton CP, et al. Clinical utility of Dop- pler echocardiography and tissue Doppler imaging in the estimation of left ventricular filling pressures: a comparative simultaneous Dop- pler-catheterization study. Circulation 2000;102:1788-94.
12) Suffoletto MS, Dohi K, Cannesson M, Seba S, Gorcsan J 3rd. Novel speckle tracking radial strain from routine black-and-white echocar- diographic images to quantify dyssynchrony and predict response to cardiac resynchronization therapy. Circulation 2006;113:960-8.
13) Gorcsan J 3rd, Tanabe M, Bleeker GB, et al. Combined longitudinal and radial dyssynchrony predicts ventricular response after resynchro- nization therapy. J Am Coll Cardiol 2007;50:1476-83.
14) Sokolow M, Lyon TP. The ventricular complex in ventricular hyper- trophy as obtained by unipolar precordial and limb leads. Am Heart J 1949;37:161-86.
15) Nagueh SF. Mechanical dyssynchrony in congestive heart failure. J Am Coll Cardiol 2008;51:18-22.
16) Hawkins NM, Petrie MC, MacDonald MR, Hogg JK, McMurray JJ.
Selecting patients for cardiac resynchronization therapy: electrical or mechanical dyssynchrony? Eur Heart J 2006;27:1270-81.
17) Bleeker GB, Holman ER, Steendijk P, et al. Cardiac resynchroniza- tion therapy in patients with a narrow QRS complex. J Am Coll Cardi- ol 2006;48:2243-50.
18) Kass DA. An epidemic of dyssynchrony: but what does it mean? J Am Coll Cardiol 2008;51:12-7.
19) Wang J, Kurrelmeyer KM, Torre-Amione G, Nagueh SF. Systolic and diastolic dyssynchrony in patients with diastolic heart failure and the
effect of medical therapy. J Am Coll Cardiol 2007;49:88-96.
20) Wang YC, Hwang JJ, Lai LP, et al. Coexistence and exercise exacer- bation of intraleft ventricular contractile dyssynchrony in hypertensive patients with diastolic heart failure. Am Heart J 2007;154:278-84.