ORIGINAL ARTICLE
기능성 팽만감 환자에서 복부 컴퓨터단층촬영으로 측정한 위장관 가스와 지방량
이홍섭1,2, 김재근3, 선주성3, 이광재1
아주대학교 의과대학 소화기내과학교실1, 명지병원 소화기내과2, 아주대학교 의과대학 영상의학과교실3
Gastrointestinal Gas and Abdominal Fat Quantity Measured by Three-Dimensional Abdominal Computed Tomography in Patients with Functional Bloating
Hong Sub Lee1,2, Jai Keun Kim3, Joo Sung Sun3 and Kwang Jae Lee1
Department of Gastroenterology, Ajou University School of Medicine1, Suwon; Department of Gastroenterology, Myongji Hospital2, Goyang;
Department of Radiology, Ajou University School of Medicine3, Suwon, Korea
Background/Aims: The aim of this study was to assess whether increased intestinal gas or fat content in the abdominal cavity is related to abdominal bloating, using three-dimensional abdominal computed tomography scan.
Methods: Twenty-nine healthy individuals without abdominal bloating and organic disease (15 women; mean age, 49 years; range of age, 23-73 years) and 30 patients with chronic recurrent abdominal bloating-diagnosed with functional bloating (10 women; mean age, 53 years; range of age, 35-75 years) - participated in this study. The mean values of measured parameters were compared using independent sample t-test.
Results: The mean volume of total colon gas in bloated patients was similar to that in control subjects. The distribution of intra-abdomi- nal gas was also similar between the two groups. However, the amount of gas in the transverse colon tended to be significantly higher in patients with bloating than in controls (p=0.06). Body mass index was similar between the two groups (23.4±3.2 kg/m2 and 22.3±3.1 kg/m2, respectively). Moreover, no significant differences with respect to circumferential area, subcutaneous fat, visceral fat area, and total fat area were found between the two groups.
Conclusions: Bloating might not just be the result of gastrointestinal gas or intra-abdominal fat. Other contributing factors, such as localized abnormality in gas distribution and visceral hypersensitivity, may be involved. (Korean J Gastroenterol 2018;71:324-331) Key Words: Abdominal fat; Gastrointestinal contents; Gas bloat syndrome; Multidetector computed tomography; Irritable bowel syn- drome
Received December 11, 2017. Revised March 2, 2018. Accepted March 25, 2018.
CC This is an open access article distributed under the terms of the Creative Commons Attribution Non-Commercial License (http://creativecommons.org/licenses/
by-nc/4.0) which permits unrestricted non-commercial use, distribution, and reproduction in any medium, provided the original work is properly cited.
Copyright © 2018. Korean Society of Gastroenterology.
교신저자: 이광재, 16499, 수원시 영통구 월드컵로 164, 아주대학교 의과대학 소화기내과학교실
Correspondence to: Kwang Jae Lee, Department of Gastroenterology, Ajou University School of Medicine, 164 Worldcup-ro, Yeongtong-gu, Suwon 16499, Korea. Tel:
+82-31-219-5102, Fax: +82-31-219-5999, E-mail: [email protected] Financial support: None. Conflict of interest: None.
INTRODUCTION
Abdominal bloating is one of the most common functional symptoms.1 However, functional bloating is not a part of func- tional bowel or gastroduodenal disorder. A recent study
showed that the prevalence of functional bloating in Korea, according to Rome III criteria, was 6.9%, after excluding other overlapping functional gastrointestinal (GI) diseases.2 In an- other study, abdominal bloating symptom was present in 26.9% of the health screening cohort. An epidemiologic sur-
vey in the United States revealed that sex and age-adjusted overall prevalence of abdominal bloating was 19.0%.3 Moreover, another study showed that 82.5% of patients with irritable bowel syndrome (IBS) reported abdominal bloating, which may be a more bothersome symptom than abdominal pain or discomfort.4 In that study, abdominal bloating was the third main reason for IBS patients to visit the doctors, and more than half of these patients reported regular use of an- ti-gas medications. In spite of this high prevalence, the patho- physiology of bloating is complicated and poorly understood.
Four factors, including volume of intra-abdominal con- tents, subjective sensation of abdominal bloating, objective abdominal dimensional changes, and muscular activities of the abdominal walls, were included in the pathophysiology of abdominal bloating.5 Of all intra-abdominal elements, in- testinal gas has been the most likely candidate to explain bloating. Although many studies have been performed to prove excessive amounts of gas in the GI tract for patients with bloating using washout techniques,6,7 simple X-ray,8 and computed tomography (CT) image analysis,9,10 bloating re- mains contentious.
Abdominal bloating might also result from increased ab- dominal fat. However, previous studies that evaluated the as- sociation between body mass index (BMI) and abdominal symptoms showed inconsistent results. In one study, no rela- tionship between BMI and abdominal symptoms was found.11 Another study found that increasing BMI was asso- ciated with increasing vomiting, upper abdominal pain, bloat- ing, and diarrhea.12 Therefore, the relationship between in- creased BMI and bloating remains unclear. Additionally, no study on intra-abdominal fat contents and bloating can be found in the literature.
Based on these data, we hypothesized that excessive gas, abnormal distribution, and abdominal fat could account for abdominal bloating. The aim of this study were to determine whether increased intestinal gas or increased fat content in the abdominal cavity or relevant to abdominal bloating, using three-dimensional abdominal CT scan, which is a validated method for measuring intra-abdominal gas and fat.9,10,13
SUBJECTS AND METHODS
1. Participants
Twenty-nine healthy individuals without abdominal bloat-
ing and organic disease (15 women and 14 men; mean age, 49 years; range of age, 23-73 years) and 30 patients diag- nosed with functional bloating experiencing chronic re- current abdominal bloating (10 women and 20 men; mean age, 53 years; range of age, 35-75 years) participated in this study. All participants received a list of symptoms by vali- dated Korean version of the bowel disease questionnaire (Rome III-K)14 according to the Rome III criteria.1 Subjects di- agnosed with other functional GI disorders, including IBS, functional diarrhea, functional constipation, and functional dyspepsia, were excluded. Moreover, blood tests and colono- scopy were performed to exclude participants with organic bow- el disease. This study was approved by the institutional review board of the university hospital (AJIRB-MED-MDB-12-018).
Before participation, all subjects provided written informed consent and were informed of their right to discontinue par- ticipation at any time.
2. Determination of the sample size
In a previous study that used plain abdominal radiography to determine the amount of abdominal gas,8 the mean gas volume score of patients with IBS and controls were 0.069 (standard deviation 0.039) and 0.033 (standard deviation 0.013), respectively. The number of participants in each arm of this study was calculated to obtain a satisfactory result with α=0.05 and a power of 0.90. Therefore, we calculated that 34 subjects, including 17 subjects and 17 controls, were necessary. We chose to enroll 60 subjects to allow for about 30% no-show on the day of the scheduled procedure. Only one healthy participant did not participate in this study.
3. CT technique
Abdominal imaging was performed using a Somatom Sensation 16-channel multidetector CT (Siemens, Forchheim, Germany). Subjects fasted for at least 6 h before the CT scan.
No glucagon or anticholinergic agents were administered.
First, pre-contrast CT scan was performed. Second, 150 mL of iopromide (Ultravist 300; Schering, Berlin, Germany) or io- meprol (Iomeron 300; Bracco, Milan, Italy) was injected intra- venously through an 18-gauge angiographic catheter in- serted into an antecubital vein using a LF CT 9000 power in- jector (Liebel-Flarsheim, Ohio, USA) at a rate of 2.5 mL/sec.
Third, combinations of arterial and portal phase scans were acquired for 35 sec (arterial phase) and 90 sec (delayed
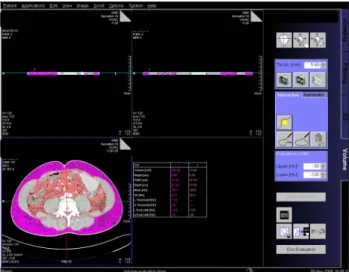
Fig. 1. Subcutaneous fat and visceral fat amount measurement by image processing workstation software.
Fig. 2. Intra-abdominal gas measurements by image processing work- station software.
phase), respectively. Arterial phase and delayed phase CT im- ages were obtained using the following protocol: detector col- limation of 16×1.5, pitch of 1.0, section width of 5 mm, re- construction increment of 5 mm as 5 mm-thick sections, 120 kVp, and 160 mAs. The scanning range included the region from the liver to pelvic cavity in the precontrast and arterial phase, and from the lower chest to the symphysis pubis for the delayed phase.
4. Imaging and analyses
Two certified experienced abdominal radiologists blindly reviewed the CT images by consensus on a picture archiving and communication system (Starpacs; infinitt, Seoul, Korea) picture and communication system workstation (Infinitt, Seoul, Korea). The morphologic features on CT images were measured and calculated on the PACS workstation.
Air volume measurement was also performed using the in- teractive image processing workstation software. With auto- matic thresholds between -400 and -1024 Hounsfield Unit, manually defined multiple regions of interest were selected, and the total air volume in the bowel segment was measured in the stomach, ascending (A) colon, transverse (T) colon, de- scending (D) colon, and rectosigmoid (RS) colon (Fig. 1).
To evaluate the volume of small bowel and non-gas intra- luminal contents in the colon, maximal diameter of ascend- ing colon, transverse colon, descending colon, and rec- tosigmoid colon, as well as the maximal diameter of small bowel in the left upper quadrant abdomen and right lower ab- domen were measured. The measurement of small bowel
gas distribution using CT scan was not definite yet. The divi- sion point between the small bowel parts is arbitrary. As a general rule, the jejunum includes about 40% of the small in- testine proximally and the ileum includes about 60% of the small intestine distally, except the duodenum. The jejunum lies mainly in the left upper and lower quadrants and the ileum in the lower abdomen and the right iliac fossa.15 Hence, the alternative way to assume intra-abdominal volume was used in this study.
Subcutaneous fat and visceral fat were measured via Syngo interactive image processing workstation software (Siemens, Erlangen, Germany). With automatic thresholds of Hounsfield Units between -30 and -120, manually-defined subcutaneous fat area was selected, and the total amounts of abdominal fat and visceral abdominal fat were measured (Fig. 2). The amount of subcutaneous fat was calculated from the total abdominal fat amount and the visceral fat amount, according to the following equation: Subcutaneous fat amount=total abdominal fat amount-visceral fat amount.
5. Statistical analyses
All data were expressed as the mean±standard error for each group. The mean values of the measured parameters were compared using Student’s t-test or Mann-Whitney U-test. P values of less than 0.05 were considered statisti- cally significant. SPSS for Windows version 11 (SPSS Inc., Chicago, USA) was used for all statistical analyses.
RESULTS
1. Intra-abdominal gas volume and distribution
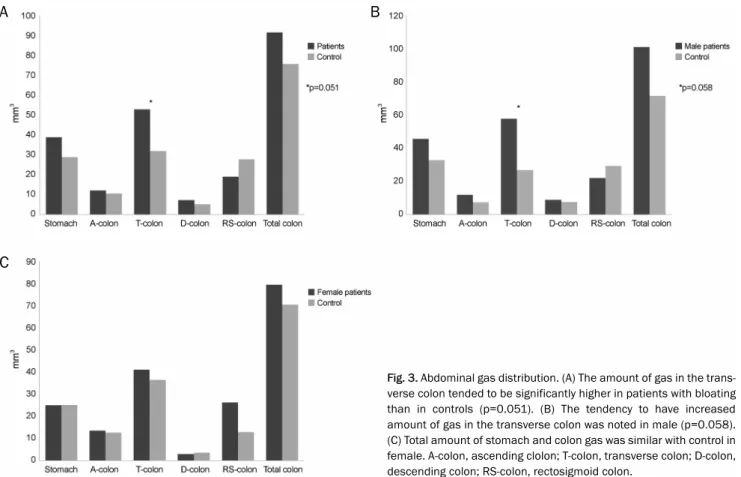
The results of intra-abdominal gas volume and distribution are summarized in Fig. 3. The mean volume of the total colon gas in patients with bloating was not significantly different from that in control subjects (90.6±12.6 vs. 75.5±9.8 mm3; p=0.353). Moreover, the mean volumes of stomach, A colon, D colon, and RS colon of patients with bloating were similar to those of controls (38.7±6.0 vs. 28.8±3.9 mm3; p=0.174, 12.2±1.4 vs. 10.6±1.3 mm3; p=0.433, 7.2±2.1 vs. 5.2±1.4 mm3; p=0.446, 19.0±5.0 vs. 27.7±6.0 mm3; p=0.271, re- spectively). However, the amount of gas in the transverse co- lon tended to be higher in patients with bloating than in con- trols (52.0±8.9 vs. 31.8±4.7 mm3; p=0.051). The distribution ratio of the intra-abdominal gas was calculated. The gas ratio of the T colon in the total colon was significantly higher in pa- tients with bloating compared with the controls (p=0.009).
The gas ratio of the stomach, A colon, D colon, and RS colon in the total colon of patients with functional bloating did not significantly differ from those detected in control subjects.
According to the analysis of male and female subgroups, there was no significant intra-abdominal gas difference be- tween patients and controls in women. In men, however, in- tra-abdominal gas was higher in patients, especially in the transverse colon (57.6±12.0 vs. 26.9±6.8 mm3; p=0.058).
2. Maximal diameter of intestinal segment
Fig. 4 shows the maximal diameter distribution of intestine between the two groups. The mean maximal diameter of A co- lon, T colon, D colon, and RS colon in patients with bloating was similar to those in controls (5.1±1.7 vs. 4.8±1.5 cm;
p=0.171, 3.1±1.5 vs. 3.0±1.3 cm; p=0.858, 3.3±1.1 vs.
3.1±0.9 cm; p=0.135, 3.1±1.9 vs. 3.2±1.7 cm; p=0.661 by t-test). Moreover, the mean maximal diameter of ileum in pa- tients with bloating was similar to that in controls (1.9±0.9 vs.
1.7±0.6 cm; p=0.187 by t-test). However, the maximum di- ameter of jejunum in the left upper quadrant was sig- nificantly greater in patients with bloating compared with controls (2.0±0.7 vs. 1.8±0.6 cm; p=0.031 by t-test). Also, the jejunal diameter ratio of ileum was calculated. The diam- eter ratio was not significantly different between the two
Fig. 3. Abdominal gas distribution. (A) The amount of gas in the trans- verse colon tended to be significantly higher in patients with bloating than in controls (p=0.051). (B) The tendency to have increased amount of gas in the transverse colon was noted in male (p=0.058).
(C) Total amount of stomach and colon gas was similar with control in female. A-colon, ascending clolon; T-colon, transverse colon; D-colon, descending colon; RS-colon, rectosigmoid colon.
A B
C
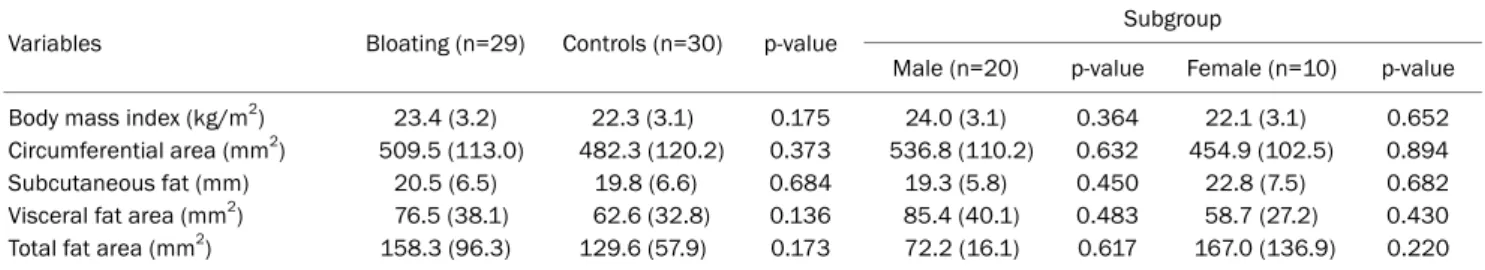
Table 1. Comparison of Body Mass Index and Fat Contents between Patients with Bloating and Control Subjects
Variables Bloating (n=29) Controls (n=30) p-value Subgroup
Male (n=20) p-value Female (n=10) p-value
Body mass index (kg/m2) 23.4 (3.2) 22.3 (3.1) 0.175 24.0 (3.1) 0.364 22.1 (3.1) 0.652
Circumferential area (mm2) 509.5 (113.0) 482.3 (120.2) 0.373 536.8 (110.2) 0.632 454.9 (102.5) 0.894
Subcutaneous fat (mm) 20.5 (6.5) 19.8 (6.6) 0.684 19.3 (5.8) 0.450 22.8 (7.5) 0.682
Visceral fat area (mm2) 76.5 (38.1) 62.6 (32.8) 0.136 85.4 (40.1) 0.483 58.7 (27.2) 0.430 Total fat area (mm2) 158.3 (96.3) 129.6 (57.9) 0.173 72.2 (16.1) 0.617 167.0 (136.9) 0.220 Values are presented as mean (standard deviation).
groups (p=0.750 by Mann-Whitney U-test). According to the analysis of male and female subgroups, there was no sig- nificant difference with respect to the mean diameter in women. In men, however, the mean diameter of intestine was significantly higher in the jejunum (2.1±0.6 vs. 1.7±0.6 cm;
p=0.001) and ileum (2.0±1.2 vs. 1.6±0.7 cm; p=0.020), compared with control.
3. Abdominal fat contents
Table 1 shows the abdominal fat content of the two groups.
BMI in patients with bloating (23.4±3.2 kg/m2) was higher
than that in controls (22.3±3.1 kg/m2), but the difference was not statistically significant (p=0.175). The circum- ferential area, subcutaneous fat, visceral fat area, and total fat area were slightly higher in patients with functional bloat- ing than in control subjects, but the difference was not stat- istically significant.
DISCUSSION
Abdominal bloating is common and frequently associated with IBS. Many patients with IBS with complaint of abdominal
Fig. 4. Maximal diameter of intestinal segment. (A) The mean max- imal diameter of A colon, T colon, D colon and RS colon in the pa- tients with bloating was similar as in control subjects. (B) There is no significant mean diameter difference between patients and control in female. (C) In male, mean diameter of intestine was higher in pa- tients, significantly in the jejunum (2.1±0.6 vs. 1.7±0.6 mm3; p=0.001) and ileum (2.0±1.2 vs. 1.6±0.7 mm3; p=0.020). A-colon, ascending clolon; T-colon, transverse colon; D-colon, descending co- lon; RS-colon, rectosigmoid colon.
A B
C
bloating are convinced that these symptoms might have or- iginated from excessive intra-abdominal gas.16,17 It was re- ported that patients with IBS can show large abdominal girth increase, as high as up to 12 cm without gas infusion.18 In ad- dition, colonic gas production appear to be greater in patients with IBS than in controls.19 Therefore, patients with bloating symptom are generally considered to have excessive in- tra-abdominal gas. Although many imaging studies that used simple radiography demonstrated the presence of excessive gas in patients with bloating symptom, many recent imaging studies, including multidetector CT studies, have not con- firmed this fact.10,20 Therefore, this present study verified whether the total amount of GI gas in patients with functional bloating was significantly different from that in control subjects. Moreover, the use of gas challenge technique, while not involving imaging, has provided supporting results.
For example, although infusion of a large amount of gas into the intestinal tract in healthy individual produces only an in- crementally small change in abdominal girth, patients with IBS develop gas retention, abdominal girth increment, and in- creased GI symptoms.7 This suggests that bloating might not just be the result of excess GI gas. Symptom perception did not correlate with the degree of abdominal distension, but with the mechanism of retention and gut motor activity.21
The second issue in this present study was gas distribution about the intra-abdominal gas in abdominal bloating. The amount of gas in the transverse colon tended to be higher in patients with bloating than in controls, indicating a difference in gas distribution between the two groups. These results cor- related well with those of a study that used magnetic reso- nance imaging to assess the bowel volume in patients with IBS and controls.22 In that study, the authors showed that bloating symptom correlated better with distention of trans- verse colon than with ascending colon. Other studies demon- strated that some patients with IBS have abnormalities in in- testinal transit, which could contribute to symptoms of ab- dominal bloating.23,24 Moreover, the findings of this study cor- responded well with those of colonic gas load survey that showed delayed proximal colonic gas clearance but normal distal colonic gas clearance in patients with abdominal bloating.25 Therefore, clinically impaired clearance of in- tra-abdominal gas could lead to localized distention of the proximal colon, thereby causing significant bloating via ab- normal viscerosomatic responses.26
According to gender sub-analysis, there was no significant difference in gas or maximal intestinal diameter between pa- tients and controls in females. However, in the males, the amount of gas and maximal intestinal diameter was higher in patients than in controls. This is presumed to be due to the involvement of visceral hypersensitivity in females.27
To the best of our knowledge, this is the first study to dem- onstrate the relationship between abdominal fat content and abdominal bloating. Obesity is a risk factor for some GI diseases, such as gastro-esophageal reflux disease, and is suggested to be linked to common GI functional disorders.28 This association suggests the possibility that obesity and functional GI disorders may be pathologically linked. The re- sults of the current study correlated well with those of a re- cent meta-analysis, showing no relationship between bloat- ing and BMI.29 Interestingly, several studies showed that pa- tients with abdominal bloating were more prone to recent weight gain than controls, irrespective of BMI.30,31 The sug- gested hypothesis of these studies was that excessive accu- mulation of intra-abdominal fat content could alter visceral sensation. However, no studies have compared the intra-ab- dominal fat content between patients with functional bloat- ing and control subjects. The present study showed that the circumferential area, subcutaneous fat, visceral fat area, and total fat area in patients with functional bloating were slightly higher than in control subjects, but the difference was not statistically significant. Since a recent increase in in- tra-abdominal fat might be associated with the develop- ment of abdominal bloating, further investigations will be needed.
This study has several limitations. First, the non-gas intra- luminal contents, including stool and liquid, were not meas- ured directly. Instead, an indirect method by using the max- imal diameter of colon was used in this study. Moreover, it was reported that colonic solid and liquid residue appears to be stable, and non-gas contents were not significantly differ- ent between patients with bloating and controls.32 Second, a direct measurement of small bowel gas distribution was not included in this study. The method of evaluating the small bowel by using maximal diameter was first used in this study.
Hence, further studies will be needed to confirm whether the maximal diameter of the small bowel can indirectly estimate the volume of the small bowel. Third, all measurements in our study were performed on a fixed schedule. Therefore, diurnal
and day-to-day variation of bloating and distension33 were not considered. Fourth, cases and controls were not matched.
However, the baseline characteristics, including age and BMI, did not differ between patients and control. In the future, matched control studies, including more patients, will be needed to confirm the results of this study.
In conclusion, bloating might not just be the result of ex- cess intra-abdominal gas, but may involve other factors, such as localized abnormality in gas handling and visceral hypersensitivity. Moreover, bloating appears to not be related with intra-abdominal fat content.
REFERENCES
1. Longstreth GF, Thompson WG, Chey WD, Houghton LA, Mearin F, Spiller RC. Functional bowel disorders. Gastroenterology 2006;
130:1480-1491.
2. Ryu MS, Jung HK, Ryu JI, Kim JS, Kong KA. Clinical dimensions of bloat- ing in functional gastrointestinal disorders. J Neurogastroenterol Motil 2016;22:509-516.
3. Jiang X, Locke GR 3rd, Choung RS, Zinsmeister AR, Schleck CD, Talley NJ. Prevalence and risk factors for abdominal bloating and visible distention: a population-based study. Gut 2008;57:756-763.
4. Ringel Y, Williams RE, Kalilani L, Cook SF. Prevalence, character- istics, and impact of bloating symptoms in patients with irritable bowel syndrome. Clin Gastroenterol Hepatol 2009;7:68-72; quiz 3.
5. Azpiroz F, Malagelada JR. Abdominal bloating. Gastroenterology 2005;129:1060-1078.
6. Lasser RB, Bond JH, Levitt MD. The role of intestinal gas in func- tional abdominal pain. N Engl J Med 1975;293:524-526.
7. Serra J, Azpiroz F, Malagelada JR. Impaired transit and tolerance of intestinal gas in the irritable bowel syndrome. Gut 2001;
48:14-19.
8. Koide A, Yamaguchi T, Odaka T, et al. Quantitative analysis of bowel gas using plain abdominal radiograph in patients with irri- table bowel syndrome. Am J Gastroenterol 2000;95:1735-1741.
9. Maxton DG, Martin DF, Whorwell PJ, Godfrey M. Abdominal dis- tension in female patients with irritable bowel syndrome: ex- ploration of possible mechanisms. Gut 1991;32:662-664.
10. Accarino A, Perez F, Azpiroz F, Quiroga S, Malagelada JR.
Intestinal gas and bloating: effect of prokinetic stimulation. Am J Gastroenterol 2008;103:2036-2042.
11. van Oijen MG, Josemanders DF, Laheij RJ, van Rossum LG, Tan AC, Jansen JB. Gastrointestinal disorders and symptoms: does body mass index matter? Neth J Med 2006;64:45-49.
12. Delgado-Aros S, Locke GR 3rd, Camilleri M, et al. Obesity is asso- ciated with increased risk of gastrointestinal symptoms: a pop- ulation-based study. Am J Gastroenterol 2004;99:1801-1806.
13. Vehmas T, Kairemo KJ, Taavitsainen MJ. Measuring visceral adi- pose tissue content from contrast enhanced computed tomography. Int J Obes Relat Metab Disord 1996;20:570-573.
14. Song KH, Jung HK, Min BH, et al. Development and validation of the Korean Rome III questionnaire for diagnosis of functional
gastrointestinal disorders. J Neurogastroenterol Motil 2013;19:
509-515.
15. Adam A, Dixon AK. Grainger & Allison's diagnostic radiology: a textbook of medical imaging. 5th ed. Philadelphia: Churchill Livingstone/Elsevier, 2008.
16. Chang L, Lee OY, Naliboff B, Schmulson M, Mayer EA. Sensation of bloating and visible abdominal distension in patients with irri- table bowel syndrome. Am J Gastroenterol 2001;96:3341-3347.
17. Lembo T, Naliboff B, Munakata J, et al. Symptoms and visceral perception in patients with pain-predominant irritable bowel syndrome. Am J Gastroenterol 1999;94:1320-1326.
18. Houghton LA, Lea R, Agrawal A, Reilly B, Whorwell PJ. Relationship of abdominal bloating to distention in irritable bowel syndrome and effect of bowel habit. Gastroenterology 2006;131:1003- 1010.
19. King TS, Elia M, Hunter JO. Abnormal colonic fermentation in irri- table bowel syndrome. Lancet 1998;352:1187-1189.
20. Mc Williams SR, Mc Laughlin PD, O'Connor OJ, et al. Computed tomography assessment of intestinal gas volumes in functional gastrointestinal disorders. J Neurogastroenterol Motil 2012;18:
419-425.
21. Serra J, Azpiroz F, Malagelada JR. Mechanisms of intestinal gas retention in humans: impaired propulsion versus obstructed evacuation. Am J Physiol Gastrointest Liver Physiol 2001;281:
G138-G143.
22. Lam C, Chaddock G, Marciani Laurea L, et al. Distinct abnormal- ities of small bowel and regional colonic volumes in subtypes of irritable bowel syndrome revealed by MRI. Am J Gastroenterol 2017;112:346-355.
23. Kellow JE, Phillips SF, Miller LJ, Zinsmeister AR. Dysmotility of the small intestine in irritable bowel syndrome. Gut 1988;29:1236- 1243.
24. Kellow JE, Phillips SF. Altered small bowel motility in irritable bow- el syndrome is correlated with symptoms. Gastroenterology 1987;92:1885-1893.
25. Hernando-Harder AC, Serra J, Azpiroz F, et al. Colonic responses to gas loads in subgroups of patients with abdominal bloating.
Am J Gastroenterol 2010;105:876-882.
26. Agrawal A, Whorwell PJ. Review article: abdominal bloating and distension in functional gastrointestinal disorders--epidemiology and exploration of possible mechanisms. Aliment Pharmacol Ther 2008;27:2-10.
27. Ludidi S, Mujagic Z, Jonkers D, et al. Markers for visceral hyper- sensitivity in patients with irritable bowel syndrome. Neurogas- troenterol Motil 2014;26:1104-1111.
28. Lee KJ. Obesity and functional gastrointestinal disorders. Korean J Gastroenterol 2012;59:1-7.
29. Eslick GD. Gastrointestinal symptoms and obesity: a meta-analysis.
Obes Rev 2012;13:469-479.
30. Sullivan SN. A prospective study of unexplained visible abdomi- nal bloating. N Z Med J 1994;107:428-430.
31. Eslick GD, Howell SC, Talley NJ. Dysmotility symptoms are in- dependently associated with weight change: a population-based study of Australian adults. J Neurogastroenterol Motil 2015;21:
603-611.
32. Bendezú RA, Barba E, Burri E, et al. Colonic content in health and
its relation to functional gut symptoms. Neurogastroenterol Motil 2016;28:849-854.
33. Accarino A, Perez F, Azpiroz F, Quiroga S, Malagelada JR. Abdominal
distention results from caudo-ventral redistribution of contents.
Gastroenterology 2009;136:1544-1551.