Serum Chemerin Levels Are Associated with Abdominal Visceral Fat in Type 2 Diabetes
Chemerin is a recently identified adipokine suggested to play a role in obesity and its metabolic complications. The relationship between visceral obesity and serum chemerin levels in type 2 diabetes (T2DM) is unknown and may differ from that of subjects without diabetes. Therefore, we evaluated whether serum chemerin was associated with visceral abdominal obesity in patients with T2DM. A total of 218 Korean patients with T2DM were enrolled and metabolic parameters, abdominal visceral and subcutaneous fat areas, and serum chemerin levels were measured. Serum chemerin level showed positive correlation with fasting insulin, HOMA-IR, serum triglyceride, serum creatinine, urine albumin/
creatinine ratio, high-sensitivity C-reactive protein (hsCRP), fibrinogen, abdominal visceral fat area, visceral to subcutaneous fat area ratio, and negatively correlation with high density lipoprotein cholesterol and creatinine clearance (CCr) after adjusting for age, gender and body mass index. Multiple linear stepwise regression analysis showed that abdominal visceral fat area (β = 0.001, P < 0.001), serum triglyceride (β = 0.001, P < 0.001), CCr (β = -0.003, P = 0.001), hsCRP (β = 0.157, P = 0.001), fibrinogen (β = 0.001, P < 0.001), and BMI (β = 0.02, P = 0.008) independently affected log transformed serum chemerin levels. Higher serum chemerin level was associated with higher level of abdominal visceral fat area, serum triglyceride, hsCRP and fibrinogen and lower level of CCr in patients with T2DM. Serum chemerin may be used as a biomarker of visceral adiposity and chemerin may play a role in inflammation, decreased renal function, and increased cardiovascular risk in T2DM.
Keywords: Chemerin; Abdominal Visceral Fat; Type 2 Diabetes Mellitus Juyoung Han,1* So Hun Kim,1*
Young Ju Suh,2 Hyun Ae Lim,3 Heekyoung Shin,3 Soon Gu Cho,4 Chei Won Kim,1 Seung Youn Lee,1 Dae Hyung Lee,3 Seongbin Hong,1 Yong Seong Kim,1 and Moon-Suk Nam1
1Department of Internal Medicine, Inha University School of Medicine, Incheon, Korea; 2Department of Biomedical Sciences, College of Medicine, Inha University, Incheon, Korea; 3Center for Clinical Research, Inha University School of Medicine, Incheon, Korea; 4Department of Radiology, Inha University School of Medicine, Incheon, Korea
* Juyoung Han and So Hun Kim contributed equally to this work.
Received: 3 November 2015 Accepted: 31 January 2016 Address for Correspondence:
Moon-Suk Nam, MD
Division of Endocrinology and Metabolism, Department of Internal Medicine, Inha University School of Medicine, 27 Inhang-ro, Jung-gu, Incheon 22332, Korea E-mail: [email protected]
Funding: This study was supported by a grant of the Korea Healthcare Technology R&D Project, Ministry of Health and Welfare, Republic of Korea (HI14C1062), a research grant from the Korean Diabetes Association (2010) and a research grant of Inha University (51693-01).
http://dx.doi.org/10.3346/jkms.2016.31.6.924 • J Korean Med Sci 2016; 31: 924-931
INTRODUCTION
In type 2 diabetes (T2DM), the pattern of adipose tissue distri
bution is significantly different from individuals without diabe
tes. Subjects with T2DM have more visceral adipose tissue and lesser subcutaneous adipose tissue than in healthy control sub
jects (1). Most studies have found that visceral adipose tissue is strongly related to insulin resistance in T2DM. Visceral fat ac
cumulation has a significant negative impact on glycemic con
trol through a decrease in peripheral insulin sensitivity and an enhancement of gluconeogenesis (2) and it is associated with the development of coronary heart disease (3).
T2DM seems to be closely related to the endocrine activity of adipose tissue. Adipose tissue is known to express and secrete a variety of adipokines, such as leptin, adiponectin, resistin, cheme
rin, retinol binding protein4 (RBP4), omentin and adipocyte fatty acidbinding protein (AFABP). The release of adipokines by adipocytes can lead to a chronic inflammatory state that could
play a central role in the development of insulin resistance and T2DM and is associated with the risk of cardiovascular disease (4). However, among these adipokines, the potential role of che
merin on T2DM and adiposity has not been fully examined and remains controversial.
Chemerin is a recently identified adipokine, which may par
ticipate in the regulation of adipogenesis as well as the regula
tion of inflammation. It may also play a role in insulin resistance, glucose and lipid metabolism (5). Previous studies have shown that chemerin is associated with several aspects of the metabol
ic syndrome (6). Gene expression of chemerin is significantly higher in visceral adipose tissue compared with subcutaneous adipose tissue in normal glucose tolerance animals (6). We pre
viously showed a decrease in total body fat content and serum chemerin levels in overweight and obese patients with T2DM by an intensive lifestyle intervention (7). Recently, a positive cor
relation between visceral fat accumulation and serum chemer
in levels in subjects without diabetes has been shown (8). How
ever, the relationship between serum chemerin levels and body fat composition, in particular visceral abdominal obesity in peo
ple with T2DM has not been well studied and this relationship may be different from those without diabetes. Therefore, we in
vestigated whether circulating chemerin levels might be associ
ated with the degree of visceral obesity and other metabolic pa
rameters in patients with T2DM.
MATERIALS AND METHODS Study participants
In this study, 218 subjects with T2DM participated from the out
patient clinic of Inha University Hospital Diabetes and Endocri
nology Center, Incheon, Korea. Diabetes was defined according to the American Diabetes Association diagnostic criteria (9). El
igible participants were aged 2075 years with T2DM taking oral hypoglycemic agent, but not on insulin therapy. Participants who had a history of type 1 diabetes, active malignancy, infection and severe renal (serum creatinine level > 2 mg/dL) or hepatic disease (alanine aminotransferase or aspartate aminotransfer
ase level greater than or equal to twofold higher than the upper normal limit), and patients taking an antiobesity drug or a thia
zolidinedione were excluded.
Anthropometric measurement
Body weight, height, waist circumference (WC), and blood pres
sure were measured. Body mass index (BMI) was calculated as weight (kg) divided by the square of height (m). WC was mea
sured at the midpoint between the lower borders of the rib cage and the iliac crest. Blood pressure was measured after the sub
ject has been in rest for at least 10 minutes in a sitting position.
Blood collection and biochemical analyses
Blood samples were collected after an overnight fast of at least 8 hours and stored at 80°C for subsequent assays. Serum glucose was measured by a hexokinase method and hemoglobin A1c (HbA1c) values were determined by highperformance liquid chromatography (HLC723G7, Tosoh, Tokyo, Japan). Insulin was measured by a radioimmunoassay (TFB, Tokyo, Japan).
Serum concentrations of triglyceride, total cholesterol, and high density lipoprotein cholesterol (HDLC) were measured with an automatic chemical analyzer (Hitachi 7600110, Tokyo, Ja
pan). Fibrinogen concentrations were measured by a Diagnos
tica STA analyzer with fibrinogen reagent (STAfibrinogen). Cre
atinine clearance (CCr) was calculated by the CockcroftGoult equation: [(140age) × total body weight]/(serum creatinine (mg/dL) × 72) (× 0.85 for females). Chemerin (Mesdia, Seoul, Korea), lipocalin2 (R&D systems, Minneapolis, MN, USA) and omentin1 (Biovender Laboratory Medicine Inc, Modrice, Czech Republic) levels were measured by ELISA (enzymelinked im
munosorbent assay). The intra assay CVs were 11.3%, 9.4%, and
4.6% respectively. High sensitivity Creactive protein (hsCRP) was measured by a highsensitivity latex enhanced, immunon
ephelometric assay method with a chemical analyzer (Hitachi 7600; Tokyo, Japan). The homeostasis model assessment of in
sulin resistance (HOMAIR) was calculated by the following for
mula: (fasting insulin [IU/mL] × fasting glucose [mmol/L])/22.5.
Measurement of abdominal adipose tissue
Intraabdominal adipose tissue area was measured by a com
puted tomography (CT) scan (Lightspeed VCT 64 Rows, GE Healthcare, Waukesha, WI, USA). A 5 mm CT slice scan was ac
quired at the L4L5 level with the subject supine. The adipose tissue area was determined electronically by setting the attenu
ation values for a region of interest within a range of 250 to 50 Hounsfield unit (HU). The subcutaneous fat area was derived by subtracting the visceral fat area from the total abdominal fat area. The visceral to subcutaneous fat area ratio (V/S ratio) was also calculated.
Measurement of brachial ankle pulse wave velocity (baPWV) baPWV was measured using model BP203RPE II volumeple
thysmographic apparatus (Colin, Komaki, Japan). Each partici
pant rested in the supine position for 10 minutes, and was ex
amined with electrocardiographic electrodes placed on both wrists and cuffs wrapped around both brachia and ankles. Trans
mission time was calculated as the time for the waveform to trav
el between the right arm and both ankles, and the transmission distance between the right brachium and ankle was automati
cally calculated based on the height of the participant. In the present study, the means of right and left baPWV were used for analysis.
Definition of diabetic retinopathy
Diabetic retinopathy was diagnosed by ophthalmologists ac
cording to the international classification of diabetic retinopa
thy as previously described (10).
Statistical analysis
All calculations and statistical analyses were performed using the SPSS for Windows software (version 19.0, Chicago, IL, USA).
Data are expressed as the mean ± SD. Baseline comparisons and characteristics according to presence of diabetic retinopa
thy were assessed by ttest, Wilcoxon rank sum test and χ2 test as appropriate. Partial Spearman’s correlation analysis were used to examine the association between serum chemerin lev
els and other metabolic variables. To establish the independent factors associated with chemerin levels, multiple linear stepwise regression analysis was used. Chemerin was log transformed and independent variables in the multiple stepwise regression analysis were age, gender, BMI, fasting insulin, HOMAIR, HDL cholesterol, triglyceride, serum creatinine, CCr, urine albumin/
cr ratio, hsCRP, fibrinogen, visceral fat area, and V/S ratio. Re
sults were considered statistically significant if the P value was
< 0.05.
Ethics statement
This study was approved by the institutional review board at Inha University Hospital (IRB 200667) and all participants pro
vided written informed consent to participate in the study.
RESULTS
A total of 218 subjects (131 men and 87 women) participated in the study. Baseline clinical characteristics of this study subjects are summarized in Table 1. Mean age was 52.2 ± 7.5 years, BMI 25.3 ± 2.9 kg/m2, HbA1c 7.5% ± 1.3%, visceral abdominal fat area 111.7 ± 48.9 cm2, subcutaneous abdominal fat area 153.1 ± 66.6 cm2, and serum chemerin 80.3 ± 22.3 ng/mL. Serum chemerin
level was positively correlated with BMI, WC, abdominal sub
cutaneous fat area, abdominal visceral fat area, V/S ratio, blood pressure, fasting insulin, HOMAIR, triglyceride, urine albumin/
creatinine ratio, hsCRP, fibrinogen, and negatively correlated with HDLC. However, after adjusting for age, gender and BMI, serum chemerin level was positively correlated with fasting in
sulin (r = 0.25, P < 0.001), HOMAIR (r = 0.19, P = 0.006), triglyc
eride (r = 0.36, P < 0.001), serum creatinine (r = 0.21, P = 0.002), urine albumin/creatinine ratio (r = 0.25, P < 0.001), hsCRP (r = 0.31, P < 0.001), fibrinogen (r = 0.32, P < 0.001), abdominal vis
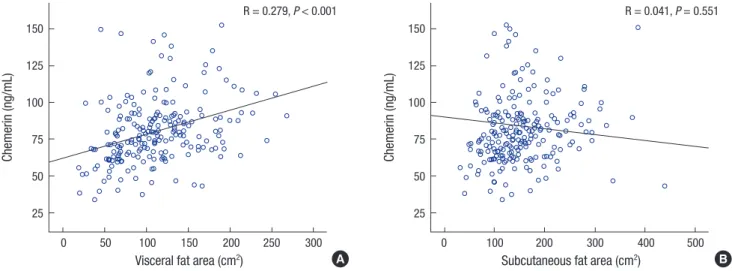
ceral fat area (r = 0.28, P < 0.001), and V/S ratio (r = 0.30, P < 0.001), and negatively correlated with HDLC (r = 0.19, P = 0.005) and CCr (r = 0.18, P = 0.009) as shown in Table 2 and Fig. 1. We also examined the association of serum chemerin levels with omen
tin1 and lipocalin2, but no association was observed. Multiple linear stepwise regression analysis showed that abdominal vis
ceral fat area (β = 0.001, P < 0.001), serum triglyceride (β = 0.001,
Table 1. Clinical characteristics of the study subjects
Characteristics Men (n = 131) Women (n = 87) Total (n = 218) P value
Age, yr 51.6 ± 7.9 53.2 ± 7.0 52.2 ± 7.5 0.14
Duration, yr 6.0 ± 5.3 5.7 ± 5.2 5.9 ± 5.3 0.75
Medication Sulfonylurea, % Metformin, %
Hypertension medication, % Statin, %
41.2 76.3 32.8 35.1
47.1 83.9 26.4 48.3
43.6 79.4 30.3 40.4
0.41 0.23 0.37 0.07
Diabetic retinopathy, % 23.7 13.8 19.7 0.08
BMI, kg/m2 25.3 ± 3.0 25.1 ± 3 25.3 ± 2.9 0.64
Waist circumference, cm 87.6 ± 7.9 84 ± 6.7 86.1 ± 7.6 0.001
Total Abdominal fat area, cm² 242 ± 92.1 299.2 ± 88.5 264.8 ± 94.7 < 0.001
Visceral fat area, cm² 113.7 ± 52.0 108.6 ± 44.1 111.7 ± 48.9 0.46
Subcutaneous fat area, cm² 128.3 ± 56.4 190.6 ± 63.3 153.1 ± 66.6 < 0.001
V/S ratio 0.95 ± 0.5 0.62 ± 0.4 0.8 ± 0.5 < 0.001
Systolic BP, mmHg 125.3 ± 14.1 124.4 ± 13.9 124.9 ± 14.0 0.67
Diastolic BP, mmHg 81.4 ± 10.8 77.2 ± 10.4 79.7 ± 10.8 0.005
Fasting plasma glucose, mM 8.3 ± 2.2 7.9 ± 2.4 8.1 ± 2.3 0.26
HbA1c, % 7.5 ± 1.4 7.4 ± 1.1 7.5 ± 1.3 0.36
HbA1c, mmol/mol 59.0 ± 15.4 57.2 ± 12.0 58.3 ± 14.1 0.36
HOMA-IR 3.2 ± 2.2 3.7 ± 2.5 3.4 ± 2.4 0.1
Fasting insulin, pM 8.8 ± 6.1 10.7 ± 6.8 9.6 ± 6.4 0.03
Total cholesterol, mmol/L 4.3 ± 0.9 4.3 ± 1.0 4.3 ± 0.9 0.87
HDL cholesterol, mmol/L 1.3 ± 0.3 1.3 ± 0.3 1.3 ± 0.3 0.09
Triglyceride, mmol/L 1.9 ± 1.3 1.7 ± 0.9 1.8 ± 1.2 0.16
LDL cholesterol, mmol/L 2.2 ± 0.9 2.2 ± 0.8 2.2 ± 0.8 0.81
Serum creatinine, mg/dL 1.05 ± 0.1 0.81 ± 0.1 0.95 ± 0.2 < 0.001
CCr, mg/dL 87.4 ± 26.9 78.4 ± 14.9 83.8 ± 23.3 0.002
Albumin/Cr Ratio, μg/mgCr 55.6 ± 196.6 29.4 ± 37.5 45.1 ± 154.5 0.14
hs CRP, mg/dL 0.2 ± 0.4 0.2 ± 0.4 0.17 ± 0.4 0.91
Fibrinogen, mg/dL 303.2 ± 63.9 320.4 ± 76.9 310 ± 69.7 0.08
PWV mean, m/sec 15.0 ± 2.5 15.0 ± 2.4 14.9 ± 2.4 0.63
Chemerin, ng/mL 78.6 ± 22.0 82.9 ± 22.6 80.3 ± 22.3 0.16
Omentin-1, ng/mL 427.7 ± 140.2 462.9 ± 154.9 441.7 ± 146.9 0.08
Lipocalin, ng/mL 73.9 ± 21.2 65.9 ± 22.8 70.7 ± 1.5 0.01
Data were expressed as the mean ± SD. The Wilcoxon rank sum test, t-test and χ2 test were used to compare the baseline characteristics as appropriate.
BMI, body mass index; BP, blood pressure; HOMA-IR, homeostasis model of ssessment-insulin resistance; HDL, high-density lipoprotein; LDL, low-density lipoprotein; hsCRP, high-sensitivity C-reactive protein; CCr, creatinine clearance; PWV, pulse wave velocity; V/S ratio, ratio of visceral to subcutaneous fat.
Table 2. The correlation between serum chemerin levels and abdominal fat area, metabolic variables
Variables Unadjusted Age, gender,
BMI adjusted
r P r P
Gender 0.11 0.09
Age, yr 0.03 0.63
BMI, kg/m2 0.29 < 0.001
Waist circumference, cm 0.24 < 0.001 0.08 0.26 Total Abdominal fat area, cm² 0.34 < 0.001 0.16 0.02 Visceral fat area, cm² 0.39 < 0.001 0.28 < 0.001 Subcutaneous fat area, cm² 0.21 0.002 -0.04 0.55
V/S ratio 0.22 0.001 0.30 < 0.001
Systolic BP, mmHg 0.16 0.02 0.11 0.11
Diastolic BP, mmHg 0.15 0.03 0.13 0.07
Fasting plasma glucose, mM 0.01 0.91 0.02 0.79
HbA1c, % -0.04 0.59 -0.04 0.52
Fasting insulin, pM 0.36 < 0.001 0.25 < 0.001
HOMA-IR 0.29 < 0.001 0.19 0.006
Total cholesterol, mmol/L -0.05 0.50 -0.05 0.51
HDL cholesterol, mmol/L -0.18 0.009 -0.19 0.005
Triglyceride, mmol/L 0.38 < 0.001 0.36 < 0.001
Serum creatinine, mg/dL 0.07 0.28 0.21 0.002
CCr, mg/dL -0.31 0.65 -0.18 0.009
Albumin/Cr Ratio, μg/mgCr 0.28 < 0.001 0.25 < 0.001
hs CRP, mg/dL 0.33 < 0.001 0.31 < 0.001
Fibrinogen, mg/dL 0.33 < 0.001 0.32 < 0.001
PWV mean, m/sec 0.11 0.11 0.12 0.08
Omentin-1, ng/mL -0.41 0.55 -0.01 0.91
Lipocalin, ng/mL 0.11 0.12 0.10 0.13
Correlation coefficients (r) and P values were calculated by the partial Spearman’s correlation model.
BMI, body mass index; BP, blood pressure; HOMA-IR, homeostasis model of assess- ment - insulin resistance; HDL, high-density lipoprotein; LDL, low-density lipoprotein;
hsCRP, high-sensitivity C-reactive protein; CCr, creatinine clearance; PWV, pulse wave velocity; V/S ratio, ratio of visceral to subcutaneous fat.
Table 3. Multiple linear stepwise regression analysis for factors associated with se- rum chemerin level*
Factors β SE P R2
Visceral fat area, cm² 0.001 < 0.001 < 0.001
Fibrinogen 0.001 < 0.001 0.001
Triglyceride 0.001 < 0.001 < 0.001
HsCRP 0.157 0.045 0.001
CCr -0.003 0.001 < 0.001
BMI 0.020 0.007 0.008 0.378
Independent variables in the multiple stepwise regression analysis were age, gender, body mass index, fasting insulin, HOMA-IR, HDL cholesterol, triglyceride, serum cre- atinine, CCr, urine albumin/Cr ratio, hsCRP, fibrinogen, visceral fat area, and V/S ratio.
BMI, body mass index; hsCRP, high-sensitivity C-reactive protein; CCr, creatinine clear- ance; SE, standard error; R2, coefficient of determination.
*Serum chemerin level was log-transformed.
Fig. 1. Relationship between fat areas and serum chemerin levels after adjusting age, sex and BMI. (A) Abdominal visceral fat. (B) Abdominal subcutaneous fat.
Chemerin (ng/mL)
Visceral fat area (cm2)
0 50 100 150 200 250 300 150
125 100 75 50 25
R = 0.279, P < 0.001
Chemerin (ng/mL)
Subcutaneous fat area (cm2)
0 100 200 300 400 500 150
125 100 75 50 25
R = 0.041, P = 0.551
A B
P < 0.001), CCr (β = 0.003, P = 0.001), hsCRP (β = 0.157, P = 0.001), fibrinogen (β = 0.001, P < 0.001), and BMI (β = 0.02, P = 0.008) independently affected log transformed serum chemerin levels
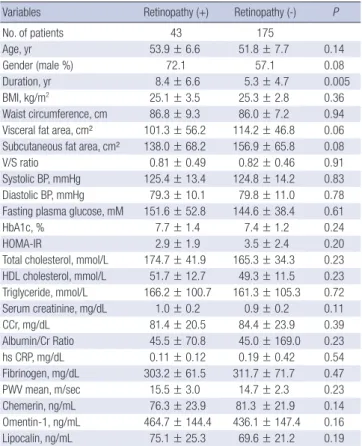
(Table 3). When clinical characteristics were compared accord
ing to the presence and absence of diabetic retinopathy, there were no significant differences in most parameters except for longer duration in those with diabetic retinopathy. Chemerin, omentin, lipocalin levels were not different according to the pres
ence of diabetic retinopathy (Table 4).
DISCUSSION
We report for the first time that serum chemerin levels are posi
tively associated with abdominal visceral fat area using CT and fibrinogen was a definite factor associated with serum chemer
in levels in patients with T2DM. In a previous study, chemerin level was significantly associated with visceral fat accumulation in subjects without diabetes (8), and other studies reported that chemerin gene expression was significantly higher in visceral adipose tissue compared with subcutaneous adipose tissue in animals (5). However, the relationship between serum chemer
in levels and abdominal fat area, especially subcutaneous and visceral fat in T2DM has not been well studied. In our previous study, a 12week intensive lifestyle intervention significantly
decreased total body fat content and serum chemerin level (7).
In this study, baseline chemerin level was not associated with visceral abdominal fat and subcutaneous visceral fat. However, the number of participants was too small (n = 35) to explain the association between serum chemerin level and abdominal fat composition, and the participants were limited to only over
weight and obese patients with T2DM. Since, there was a possi
bility that serum chemerin concentration might be associated with abdominal fat area, especially visceral fat compartment in T2DM, we investigated this in a larger number of patients with T2DM and those with a broader range of BMI.
Obesity, and in particular abdominal obesity, plays a major role in the pathogenesis of several metabolic and cardiovascu
lar problems including T2DM, hypertension, atherosclerosis and coronary artery disease (11). Especially, excess visceral adi
posity is associated with impaired glucose tolerance, insulin re
sistance, and atherogenic dyslipidemia (12). In addition, viscer
al fat has been associated with coronary stenosis, independent of traditional cardiovascular risk factors, in an asymptomatic population without a history of coronary artery disease (13).
Even within the normal range of BMI, accumulation of visceral
fat remains to be an independent cardiovascular risk factor (14).
Visceral fat accumulation may also induce secretion of adipo
cytokines. Oversecretion of proinflammatory adipocytokines, such as PAI1 or tumor necrosis factorα (TNFα) and hypose
cretion of defensive adipocytokines, such as adiponectin, might be major mechanisms of insulin resistance and T2DM (15). In recent years, several adipocytokines were newly discovered such as retinol binding protein4 (RBP4), vaspin, omentin, chemer
in and adipocyte fatty acidbinding protein (AFABP). Among these adipocytokines, the effect of chemerin on the adipose tis
sue and glucose metabolism remains controversial.
Chemerin is an adipokine which was recently found that has a role in adaptive and innate immunity, and regulates adipo
cyte differentiation and metabolism by binding to and activat
ing the seven transmembranespanning G proteincoupled re
ceptor (GPCR), chemokinelike receptor 1 (CMKLR1) (5). Se
rum chemerin levels are increased in obesity (5), and the ex
pression is especially higher in visceral adipose tissue compared with subcutaneous adipose tissue in normal glucose tolerance animals (6). In addition, visceral fat mass quantified by mag
netic resonance imaging was significantly associated with ge
netic variations of RARRES2 which encodes chemerin in sub
jects with an increased risk for T2DM (16). WC is an easily check
able method, however an imprecise measurement of abdomi
nal adiposity because it is the sum of both subcutaneous and visceral adipose tissue compartments. Our results also found that WC was associated with chemerin level, but after adjusting for age, sex and BMI, the correlation of systemic chemerin level with WC was not significant. Therefore, assessment of visceral adipose tissue area requires imaging with radiographic tech
niques such as CT or magnetic resonance imaging. In this re
spect, measurement of chemerin levels which is positively as
sociated with visceral obesity, may conveniently provide a more precise information about metabolic risk compared to BMI, WC or radiographic imaging such as CT.
Patients with diabetes have increased prevalence of hypert
rigyceridemia. In diabetes, the impaired ability of insulin to in
hibit the release of free fattyacid leads to hypertriglyceridemia (17). There is a controversy whether hypertriglyceridemia is di
rectly related with cardiovascular disease, however, some stud
ies demonstrate that hypertriglyceridemia is associated with cardiovascular disease, especially in patients with insulin resis
tance or in patient accompanying other type of dyslipidemias (e.g. increased small dense LDL cholesterol and low HDL cho
lesterol) (17). Recent studies have shown that serum chemerin levels are associated with metabolic risk factors including se
rum triglyceride (1820). Takahashi et al. (21) showed that che
merin levels were positively correlated with BMI, total choles
terol, triglyceride levels and negatively correlated with HDLC in T2DM. Another study showed that chemerin levels were sig
nificantly associated with BMI, triglyceride, creatinine, CCr af
Table 4. Clinical and laboratory variables according to presence of diabetic retinopathy
Variables Retinopathy (+) Retinopathy (-) P
No. of patients 43 175
Age, yr 53.9 ± 6.6 51.8 ± 7.7 0.14
Gender (male %) 72.1 57.1 0.08
Duration, yr 8.4 ± 6.6 5.3 ± 4.7 0.005
BMI, kg/m2 25.1 ± 3.5 25.3 ± 2.8 0.36
Waist circumference, cm 86.8 ± 9.3 86.0 ± 7.2 0.94 Visceral fat area, cm² 101.3 ± 56.2 114.2 ± 46.8 0.06 Subcutaneous fat area, cm² 138.0 ± 68.2 156.9 ± 65.8 0.08
V/S ratio 0.81 ± 0.49 0.82 ± 0.46 0.91
Systolic BP, mmHg 125.4 ± 13.4 124.8 ± 14.2 0.83 Diastolic BP, mmHg 79.3 ± 10.1 79.8 ± 11.0 0.78 Fasting plasma glucose, mM 151.6 ± 52.8 144.6 ± 38.4 0.61
HbA1c, % 7.7 ± 1.4 7.4 ± 1.2 0.24
HOMA-IR 2.9 ± 1.9 3.5 ± 2.4 0.20
Total cholesterol, mmol/L 174.7 ± 41.9 165.3 ± 34.3 0.23 HDL cholesterol, mmol/L 51.7 ± 12.7 49.3 ± 11.5 0.23 Triglyceride, mmol/L 166.2 ± 100.7 161.3 ± 105.3 0.72 Serum creatinine, mg/dL 1.0 ± 0.2 0.9 ± 0.2 0.11
CCr, mg/dL 81.4 ± 20.5 84.4 ± 23.9 0.39
Albumin/Cr Ratio 45.5 ± 70.8 45.0 ± 169.0 0.23
hs CRP, mg/dL 0.11 ± 0.12 0.19 ± 0.42 0.54
Fibrinogen, mg/dL 303.2 ± 61.5 311.7 ± 71.7 0.47
PWV mean, m/sec 15.5 ± 3.0 14.7 ± 2.3 0.23
Chemerin, ng/mL 76.3 ± 23.9 81.3 ± 21.9 0.14
Omentin-1, ng/mL 464.7 ± 144.4 436.1 ± 147.4 0.16
Lipocalin, ng/mL 75.1 ± 25.3 69.6 ± 21.2 0.19
Data were expressed as the mean ± SD. Wilcoxon rank sum test, t-test and χ2 test were used to calculate P values as appropriate.
BMI, body mass index; BP, blood pressure; HOMA-IR, homeostasis model of assess- ment-insulin resistance; HDL, high-density lipoprotein; LDL, low-density lipoprotein;
hsCRP, high-sensitivity C-reactive protein; CCr, creatinine clearance; PWV, pulse wave velocity; V/S ratio, ratio of visceral to subcutaneous fat.
ter adjusting for age and gender in patients with T2DM (22). Con
sistent with previous studies, we found that multiple factors of metabolic syndrome were significantly associated with serum chemerin, especially serum triglyceride was independently af
fecting serum chemerin levels.
In recent years, it has become clear that obesity is commonly associated with chronic lowgrade systemic inflammation and cardiovascular disease (23,24). Furthermore, visceral obesity rather than subcutaneous obesity is associated with elevated concentrations of inflammatory cytokines along with the incre
ase in risk of cardiovascular disease and diabetes. Chemerin can contribute to initiation and progression of inflammation in the obese state by stimulating macrophage adhesion to extracellu
lar matrix proteins and by promoting chemotaxis (25). Chemer
in synthesis is induced by the overexpression of proinflamma
tory cytokines such as TNFα (26) in visceral adipose tissue, and chemerin participates in the recruitment and local activation of inflammatory cells in adipose tissue (27). In addition, Weigert et al. (28) also identified that chemerin level was significantly higher in patients with elevated CRP in T2DM. Our study also identified that higher serum chemerin level was independently associated with higher hsCRP in T2DM. Furthermore, high che
merin levels were associated with increasing risk of coronary artery disease and severity of atherosclerosis independently of other established cardiovascular risk factors (29). In this respect, like other inflammatory factors such as hsCRP, TNFα and IL1 which promote atherogenesis, chemerin may be one of several factors that contribute to cardiovascular disease in T2DM. How
ever, longterm prospective studies of cardiovascular outcome associated with serum chemerin level should be investigated.
Plasma fibrinogen is an acutephase protein, and is likely to increase with inflammation and has been identified as an inde
pendent risk factor for cardiovascular disease and it is associat
ed with traditional cardiovascular risk factors (30). Plasma fi
brinogen may also be increased in T2DM and be associated with a number of components of the metabolic syndrome (31).
These evidences indicate that hyperfibrinogenemia in T2DM could contribute to the excess cardiovascular morbidity and mortality. In the present study, for the first time, we identified that fibrinogen was a definite factor associated with serum che
merin levels in T2DM. In accordance with the above findings, we suggest that serum chemerin levels in T2DM can serve as a predictor of inflammation and cardiovascular disease, like hsCRP and fibrinogen.
Recently, serum chemerin levels were reported to be signifi
cantly higher in patients on chronic hemodialysis as compared with healthy subjects, suggesting that determinants of renal func
tion are independently related to serum chemerin levels (32).
In addition, both CCr and serum creatinine were significantly associated with serum chemerin levels (22). In accordance with these reports, our data showed that serum chemerin concen
trations were significantly correlated with serum creatinine and CCr after adjusting age, sex, and BMI. Moreover, CCr was inde
pendently associated with serum chemerin levels. These find
ings indicate that elevated serum chemerin levels could be a mark
er of low CCr associated with diabetic nephropathy.
This study has some limitations. First, the study population were Korean subjects with T2DM, therefore the relationship between circulating chemerin level and visceral adipose tissue should be studied further in other populations. Second, we only measured the total form of chemerin. Chemerin is secreted in an inactive form as prochemerin with significantly lower bio
logical activity, and undergoes proteolytic cleavage on the C
terminal by proteases such as neutrophil elastase, cathepsin G and plasmin to become a short form with varying biological ac
tivity (6). Adipocytes express the genes that encode for protease that activate chemerin, such as neutrophil elastase, mast cell tryptase, angiotensin converting enzyme, tPA, uPA, and cathep
sin K (33). Cterminaltruncated chemerin variants display ei
ther more chemotactic or antiinflammatory effects, which is determined by the cleavage at distinct sites by different classes of proteases (34). Therefore, additional studies are necessary to evaluate the change in chemerin subtypes and the significance of these changes
In summary, abdominal visceral fat area, BMI, serum triglyc
eride, hsCRP, fibrinogen, and CCr were independent factors af
fecting serum chemerin levels in T2DM. Our data suggest that serum chemerin which is associated with many metabolic risk factors can be a predictor of the degree of visceral adiposity and may play an important role in inflammation, diabetic nephrop
athy, and risk of cardiovascular disease in T2DM. Furthermore, the metabolic complications of obesity in T2DM are not fully predictable based on simple anthropometric measurements.
Therefore, clinical utility of chemerin as a biomarker of visceral obesity in T2DM could be useful in early detection of these path
ological states, and aid in finding candidates for more intensive lifestyle modification and therapy to prevent their unfavorable consequences.
DISCLOSURE
The authors have no potential conflicts of interest to disclose.
AUTHOR CONTRIBUTION
Study conception and design: Kim SH, Lee SY, Nam MS. Data collection: Lim HA, Shin H, Cho SG, Kim CW, Lee SY. Data anal
ysis and interpretation: Han J, Kim SH, Suh YJ, Lee DH, Nam MS. Writing the first draft: Han J, Kim SH, Nam MS. Review and critical revision: Han J, Kim SH, Suh YJ, Hong S, Kim YS, Nam MS. Final manuscript approval: all authors.
ORCID
Juyoung Han http://orcid.org/000000023764178X So Hun Kim http://orcid.org/0000000225543664 Young Ju Suh http://orcid.org/0000000268168067 Hyun Ae Lim http://orcid.org/0000000201630376 Heekyoung Shin http://orcid.org/0000000213555705 Soon Gu Cho http://orcid.org/0000000266354595 Seung Youn Lee http://orcid.org/0000000167976858 Dae Hyung Lee http://orcid.org/0000000202840519 Seongbin Hong http://orcid.org/000000028189395X Yong Seong Kim http://orcid.org/0000000175792530 MoonSuk Nam http://orcid.org/0000000317568498
REFERENCES
1. Gallagher D, Kelley DE, Yim JE, Spence N, Albu J, Boxt L, Pi-Sunyer FX, Heshka S; MRI Ancillary Study Group of the Look AHEAD Research Group.
Adipose tissue distribution is different in type 2 diabetes. Am J Clin Nutr 2009; 89: 807-14.
2. Gastaldelli A, Miyazaki Y, Pettiti M, Matsuda M, Mahankali S, Santini E, DeFronzo RA, Ferrannini E. Metabolic effects of visceral fat accumula- tion in type 2 diabetes. J Clin Endocrinol Metab 2002; 87: 5098-103.
3. Nakamura T, Tokunaga K, Shimomura I, Nishida M, Yoshida S, Kotani K, Islam AH, Keno Y, Kobatake T, Nagai Y, et al. Contribution of visceral fat accumulation to the development of coronary artery disease in non-obese men. Atherosclerosis 1994; 107: 239-46.
4. Antuna-Puente B, Feve B, Fellahi S, Bastard JP. Adipokines: the missing link between insulin resistance and obesity. Diabetes Metab 2008; 34:
2-11.
5. Goralski KB, McCarthy TC, Hanniman EA, Zabel BA, Butcher EC, Parlee SD, Muruganandan S, Sinal CJ. Chemerin, a novel adipokine that regu- lates adipogenesis and adipocyte metabolism. J Biol Chem 2007; 282:
28175-88.
6. Bozaoglu K, Bolton K, McMillan J, Zimmet P, Jowett J, Collier G, Walder K, Segal D. Chemerin is a novel adipokine associated with obesity and met- abolic syndrome. Endocrinology 2007; 148: 4687-94.
7. Kim SH, Lee SH, Ahn KY, Lee DH, Suh YJ, Cho SG, Choi YJ, Lee DH, Lee SY, Hong SB, et al. Effect of lifestyle modification on serum chemerin con- centration and its association with insulin sensitivity in overweight and obese adults with type 2 diabetes. Clin Endocrinol (Oxf) 2014; 80: 825-33.
8. Shin HY, Lee DC, Chu SH, Jeon JY, Lee MK, Im JA, Lee JW. Chemerin lev- els are positively correlated with abdominal visceral fat accumulation.
Clin Endocrinol (Oxf) 2012; 77: 47-50.
9. Genuth S, Alberti KG, Bennett P, Buse J, Defronzo R, Kahn R, Kitzmiller J, Knowler WC, Lebovitz H, Lernmark A, et al. Follow-up report on the di- agnosis of diabetes mellitus. Diabetes Care 2003; 26: 3160-7.
10. Hong SB, Lee JJ, Kim SH, Suh YJ, Han JY, Kim YS, Nam M. The effects of adiponectin and inflammatory cytokines on diabetic vascular complica- tions in obese and non-obese patients with type 2 diabetes mellitus. Dia- betes Res Clin Pract. Forthcoming 2016.
11. Hamdy O, Porramatikul S, Al-Ozairi E. Metabolic obesity: the paradox between visceral and subcutaneous fat. Curr Diabetes Rev 2006; 2: 367-
73.
12. Pouliot MC, Després JP, Nadeau A, Moorjani S, Prud’Homme D, Lupien PJ, Tremblay A, Bouchard C. Visceral obesity in men. Associations with glucose tolerance, plasma insulin, and lipoprotein levels. Diabetes 1992;
41: 826-34.
13. Kang SJ, Kim D, Park HE, Choi SH, Choi SY, Lee W, Kim JS, Cho SH. Vis- ceral adipose tissue area is associated with coronary stenosis and non- calcified plaques. Int J Obes 2014; 38: 272-8.
14. Clinical guidelines on the identification, evaluation, and treatment of overweight and obesity in adults--the evidence report. National Institutes of Health. Obes Res 1998; 6 Suppl 2: 51S-209S.
15. Matsuzawa Y. The metabolic syndrome and adipocytokines. FEBS Lett 2006; 580: 2917-21.
16. Müssig K, Staiger H, Machicao F, Thamer C, Machann J, Schick F, Claussen CD, Stefan N, Fritsche A, Häring HU. RARRES2, encoding the novel adi- pokine chemerin, is a genetic determinant of disproportionate regional body fat distribution: a comparative magnetic resonance imaging study.
Metabolism 2009; 58: 519-24.
17. Mooradian AD. Dyslipidemia in type 2 diabetes mellitus. Nat Clin Pract Endocrinol Metab 2009; 5: 150-9.
18. Osman MM, El-mageed AI, El-hadidi E, Shahin RS, Mageed NA. Clinical utility of serum chemerin as a novel marker of metabolic syndrome and type 2 diabetes mellitus. Life Sci J 2012; 9: 1098-108.
19. Bozaoglu K, Segal D, Shields KA, Cummings N, Curran JE, Comuzzie AG, Mahaney MC, Rainwater DL, VandeBerg JL, MacCluer JW, et al. Chemer- in is associated with metabolic syndrome phenotypes in a Mexican-Amer- ican population. J Clin Endocrinol Metab 2009; 94: 3085-8.
20. Dong B, Ji W, Zhang Y. Elevated serum chemerin levels are associated with the presence of coronary artery disease in patients with metabolic syndrome. Intern Med 2011; 50: 1093-7.
21. Takahashi M, Inomata S, Okimura Y, Iguchi G, Fukuoka H, Miyake K, Koga D, Akamatsu S, Kasuga M, Takahashi Y. Decreased serum chemerin lev- els in male Japanese patients with type 2 diabetes: sex dimorphism. En- docr J 2013; 60: 37-44.
22. Hu W, Feng P. Elevated serum chemerin concentrations are associated with renal dysfunction in type 2 diabetic patients. Diabetes Res Clin Pract 2011; 91: 159-63.
23. Willerson JT, Ridker PM. Inflammation as a cardiovascular risk factor. Cir- culation 2004; 109: II2-10.
24. Libby P. Inflammation in atherosclerosis. Nature 2002; 420: 868-74.
25. Hart R, Greaves DR. Chemerin contributes to inflammation by promot- ing macrophage adhesion to VCAM-1 and fibronectin through clustering of VLA-4 and VLA-5. J Immunol 2010; 185: 3728-39.
26. Parlee SD, Ernst MC, Muruganandan S, Sinal CJ, Goralski KB. Serum che- merin levels vary with time of day and are modified by obesity and tumor necrosis factor-{alpha}. Endocrinology 2010; 151: 2590-602.
27. Ernst MC, Sinal CJ. Chemerin: at the crossroads of inflammation and obe- sity. Trends Endocrinol Metab 2010; 21: 660-7.
28. Weigert J, Neumeier M, Wanninger J, Filarsky M, Bauer S, Wiest R, Farkas S, Scherer MN, Schäffler A, Aslanidis C, et al. Systemic chemerin is related to inflammation rather than obesity in type 2 diabetes. Clin Endocrinol (Oxf) 2010; 72: 342-8.
29. Yan Q, Zhang Y, Hong J, Gu W, Dai M, Shi J, Zhai Y, Wang W, Li X, Ning G.
The association of serum chemerin level with risk of coronary artery dis- ease in Chinese adults. Endocrine 2012; 41: 281-8.
30. Barasch E, Benderly M, Graff E, Behar S, Reicher-Reiss H, Caspi A, Pelled B, Reisin L, Roguin N, Goldbourt U. Plasma fibrinogen levels and their correlates in 6457 coronary heart disease patients. The Bezafibrate Infarc- tion Prevention (BIP) Study. J Clin Epidemiol 1995; 48: 757-65.
31. Bembde AS. A study of plasma fibrinogen level in type-2 diabetes melli- tus and its relation to glycemic control. Indian J Hematol Blood Transfus 2012; 28: 105-8.
32. Pfau D, Bachmann A, Lössner U, Kratzsch J, Blüher M, Stumvoll M, Fass-
hauer M. Serum levels of the adipokine chemerin in relation to renal func- tion. Diabetes Care 2010; 33: 171-3.
33. Parlee SD, McNeil JO, Muruganandan S, Sinal CJ, Goralski KB. Elastase and tryptase govern TNFalpha-mediated production of active chemerin by adipocytes. PLoS One 2012; 7: e51072.
34. Du XY, Leung LL. Proteolytic regulatory mechanism of chemerin bioac- tivity. Acta Biochim Biophys Sin (Shanghai) 2009; 41: 973-9.