D I A B E T E S & M E T A B O L I S M J O U R N A L
This is an Open Access article distributed under the terms of the Creative Commons Attribution Non-Commercial License (https://creativecommons.org/licenses/by-nc/4.0/) which permits unrestricted non-commercial use, distribution, and reproduction in any medium, provided the original work is properly cited.
Metabolic Health, Obesity, and the Risk of Developing Open-Angle Glaucoma: Metabolically Healthy Obese Patients versus Metabolically Unhealthy but Normal Weight Patients
Younhea Jung1, Kyungdo Han2, Hae-Young L. Park3, Seung Hoon Lee1, Chan Kee Park3
1Department of Ophthalmology, Yeouido St. Mary’s Hospital, College of Medicine, The Catholic University of Korea, Seoul,
2Department of Biostatistics, College of Medicine, The Catholic University of Korea, Seoul,
3Department of Ophthalmology, Seoul St. Mary’s Hospital, College of Medicine, The Catholic University of Korea, Seoul, Korea
Background: This study sought to investigate the associations between metabolic health status, obesity, and incidence of primary open-angle glaucoma (POAG).
Methods: In this nationwide, population-based, longitudinal prospective cohort study conducted using the Korean National Health Insurance System, we categorized all subjects based on presence and severity of metabolic syndrome and obesity. Insur- ance claims data were used to identify POAG development. Then, Cox regression was applied to calculate the hazard of develop- ing POAG in people with various components of metabolic syndrome, obesity, or their combination.
Results: Of the total 287,553 subjects, 4,970 (1.3%) developed POAG. High fasting glucose, blood pressure, and total cholesterol levels were all associated with increased risk of developing POAG. Regarding obesity level, people with body mass index (BMI) greater than 30 kg/m2 were more likely to develop POAG than those with normal BMI. Also, people with greater number of meta- bolic syndrome components showed a greater POAG incidence. People who are metabolically unhealthy and obese (adjusted hazard ratio [HR], 1.574; 95% confidence interval [CI], 1.449 to 1.711) and those who are metabolically unhealthy nonobese (MUNO: adjusted HR, 1.521; 95% CI, 1.405 to 1.645) but not those who are metabolically healthy obese (MHO: adjusted HR, 1.019; 95% CI, 0.907 to 1.144) had an increased hazard of developing POAG compared with metabolically healthy nonobese (MHNO) subjects.
Conclusion: Metabolic health status and obesity were significantly associated with increased risk of POAG incidence. MUNO subjects but not MHO subjects showed a higher risk of POAG development than did MHNO subjects, suggesting that metabolic status is more important than obesity in POAG.
Keywords: Diabetes mellitus; Glaucoma, open-angle; Hypercholesterolemia; Hypertension; Metabolic syndrome; Obesity
Corresponding author: Chan Kee Park https://orcid.org/0000-0002-0922-8293 Department of Ophthalmology, Seoul St. Mary’s Hospital, College of Medicine, The Catholic University of Korea, 222 Banpo-daero, Seocho-gu, Seoul 06591, Korea E-mail: [email protected]
INTRODUCTION
Glaucoma is characterized by irreversible damage to the optic nerve, which can cause blindness, and is the leading cause of irreversible blindness worldwide. Globally, 64.3 million people
were estimated to have glaucoma in 2013, with the number ex- pected to increase to 111.8 million in 2040 [1]. Although irre- versible, its progression can be delayed by treatment; therefore, identifying risk factors associated with the disease to promote earlier detection is important.
https://doi.org/10.4093/dmj.2019.0048 pISSN 2233-6079 · eISSN 2233-6087
Many risk factors for glaucoma development have been rec- ognized including increased intraocular pressure (IOP) [2], family history of glaucoma [3], age [4], and African ancestry [5]. In addition, hemodynamic factors have been identified to play an important role in the pathogenesis of primary open- angle glaucoma (POAG); thus, metabolic health status and obesity may affect POAG development [6,7]. However, meta- bolic health status and obesity have been shown to have con- flicting relationships with glaucoma [6,8-14]. This inconsisten- cy could be attributed to differences in the characteristics of the study population, dissimilar definitions or categories of diseases, or variation in follow-up periods. It may also be due to interactions between metabolic health and obesity. It has been suggested that, despite similarities in obesity level, which is most frequently measured by body mass index (BMI), indi- viduals show different clinical outcomes depending on meta- bolic statuses [15,16]. Individuals who are obese but metaboli- cally healthy show lower degrees of insulin resistance, visceral adiposity, and cardiovascular risk. Conversely, individuals who are nonobese but metabolically unhealthy show higher degrees of insulin resistance, visceral adiposity, blood pressure (BP), oxidative stress, and cardiovascular mortality [16-19].
To the best of our knowledge, the risk of POAG develop- ment has not been previously compared in the context of com- binations of metabolic status and obesity. Therefore, in this study, we assessed the effects of metabolic status and obesity, both presence and severity, on development of POAG using a nationwide longitudinal sample of individuals enrolled from throughout South Korea. Furthermore, we sought to under- stand how different combinations of metabolic status and obe- sity affected the likelihood of developing POAG after adjusting for potentially confounding factors.
METHODS
Database
The Korean National Health Insurance System (KNHIS) re- quires that all South Koreans enroll in the system and contains comprehensive health-related information for all nationals.
With this system, medical providers receive 30% of total medi- cal expenses from patients themselves and the other 70% from the KNHIS, for which they must submit claims [20]. In addi- tion, the KNHIS offers free general health checkups to all in- sured Koreans and their dependents over the age of 40 years, at least biennially. The KNHIS contains data regarding personal
information about the patient (an unidentifiable code repre- senting each individual as well as age, sex, socioeconomic vari- ables, area of residency, and household income level), medical treatment based on medical claims made by medical providers (diagnostic codes, treatment procedures, prescription drugs, information about the hospital, total medical costs), and the results of general health examination. A customized database of 1,025,340 subjects (2.2%) was compiled from the entire Ko- rean population in 2002 (46,605,433 subjects) by stratified ran- dom sampling to represent the total population, and the sub- jects were tracked until 2013.
The KNHIS national sample cohort 2002 to 2013 (KNHIS- NSC 2002 to 2013) project was approved by the Institutional Review Board of the KNHIS. This study followed the tenets of the Declaration of Helsinki and was approved by the Institu- tional Review Board of Seoul St. Mary’s Hospital (KC15EI- SI0294). Written informed consent by the patients was waived due to a retrospective nature of our study.
Participants
From the KNHIS-NSC 2002 to 2013 project, we included sub- jects who had undergone a general health examination at least once between 2002 and 2008 (n=424,712). Subjects were iden- tified as having POAG if they had at least two visits for POAG (International Classification of Diseases [ICD]-10 code H40.1) and received antiglaucoma medications during the study peri- od. We excluded subjects aged younger than 40 years (n=
136,834) and those who were diagnosed with POAG prior to enrollment (n=325) to exclude nonincident cases. Ultimately, the study included 287,553 subjects. If a subject underwent more than one health examination, the results from their first health examination were included in the analysis.
Measurements and demographic factors
Health examinations were performed in hospitals that were certified by the KNHIS. Anthropometric measurements were performed with the subjects wearing light clothing. BMI was calculated as subject weight in kilograms divided by the square of subject height in meters. BP was measured in a seated posi- tion after an at least 5-minute rest. Blood samples for glucose serum and total cholesterol (TC) levels were collected following overnight fasting. Data on history of smoking (no, past, or cur- rent), alcohol consumption (no, less than two to three times/
month, once or more/week), and exercise (no activity, less than four times/week, or five times or more/week) were obtained
using a questionnaire. Subject medication history was gathered based on clinic and pharmacy ICD-10 codes, list of prescribed medications, and medical history obtained via a questionnaire.
Subject socioeconomic status was dichotomized into lower 20% and upper 80% groups based on household income. Area of residency was categorized as either urban or rural.
Definitions of metabolically healthy obesity
Metabolically healthy patients were defined as those who were free of metabolic syndrome components. If a subject had at least one of diabetes mellitus (DM), hypertension, and hyper- cholesterolemia, the participant was considered to be metabol- ically unhealthy. DM was defined based on ICD-10 codes (E11–E14) and prescription of antidiabetic medications or a fasting plasma glucose (FPG) ≥126 mg/dL. Hypertension was defined based on ICD-10 codes (I10, I11, I12, I13, and I15) and prescription of antihypertensive medications, a systolic BP (SBP) ≥140 mm Hg, or a diastolic BP (DBP) ≥90 mm Hg.
Prehypertension was defined as a SBP from 120 to 139 mm Hg or a DBP from 80 to 89 mm Hg. Hypercholesterolemia was de- fined based on an ICD-10 code (E78) and prescription of cho- lesterol medications or TC ≥240 mg/dL. Obesity was defined as BMI ≥25 kg/m2.
Subjects were categorized into the following four groups based on metabolic status and obesity: metabolically healthy nonobese (MHNO), metabolically unhealthy nonobese (MUNO), metabolically healthy obese (MHO), and metaboli- cally unhealthy obese (MUO).
Statistical analyses
Student t-test was used to compare continuous variables, and chi-square test was used to compare categorical variables. The duration of follow-up (person-years) was calculated from the enrollment date (2002 to 2008) to the date of POAG diagnosis or to the end of follow-up (December 2013). Cox proportional hazards analysis was performed to estimate the overall hazard ratio (HR) and 95% confidence interval (CI) for the associa- tions of DM, hypertension, hypercholesterolemia, and BMI with POAG development. To identify the graded risk of POAG development by level of metabolic syndrome component, DM, hypertension, hypercholesterolemia, and obesity were each stratified into subgroups based on levels of FPG (FPG <100, 100≤ FPG <126, 126 mg/dL ≤ FPG, or on medication); SBP or DBP (SBP <120 or DBP <80, 120≤ SBP <140 or 80≤ DBP
<90, SBP ≥140 or DBP ≥90 mmHg, or on medication); TC
(TC <200, 200≤ TC <240, 240 mg/dL ≤ TC, or on medica- tion); and BMI (<18.5, 18.5 to 22.9, 23 to 24.9, 25 to 29.9, and
≥30 kg/m2), respectively.
In addition, we calculated the HR of incident POAG accord- ing to number of metabolic syndrome components. We also calculated the HR of each metabolic syndrome component and obesity level for new-onset POAG, stratified by sex and age (<64 years vs. ≥65 years). The Kaplan-Meier curve was used to calculate the overall disease-free rate, while the log-rank test was performed to investigate the differences in the effect of metabolic state and obesity on POAG development. Further- more, we examined the association between groups stratified according to metabolic status and obesity and POAG incidence.
Multivariable HRs were calculated after adjusting for age, sex, smoking, exercise, and income. A P value less than 0.05 was considered significant. All statistical analyses were performed using SAS version 9.3 (SAS Institute Inc., Cary, NC, USA).
RESULTS
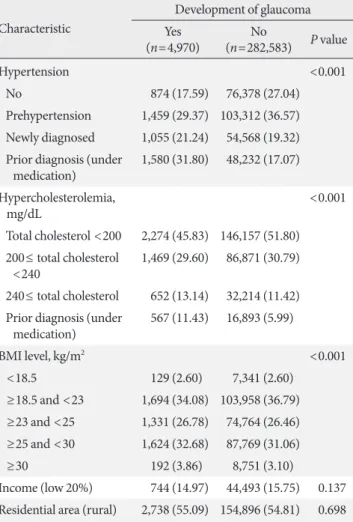
Of the 287,553 participants who were included in the present analysis, 4,970 (1.73%) developed POAG. Baseline characteris- tics of participants with and without incident POAG are shown in Table 1. Participants who developed POAG were more likely to be older than 65 years and male. These individuals addition- ally showed higher BMI, SBP, DBP, serum glucose, and TC lev- els than did those without POAG.
Association with open-angle glaucoma: components of metabolic syndrome and BMI
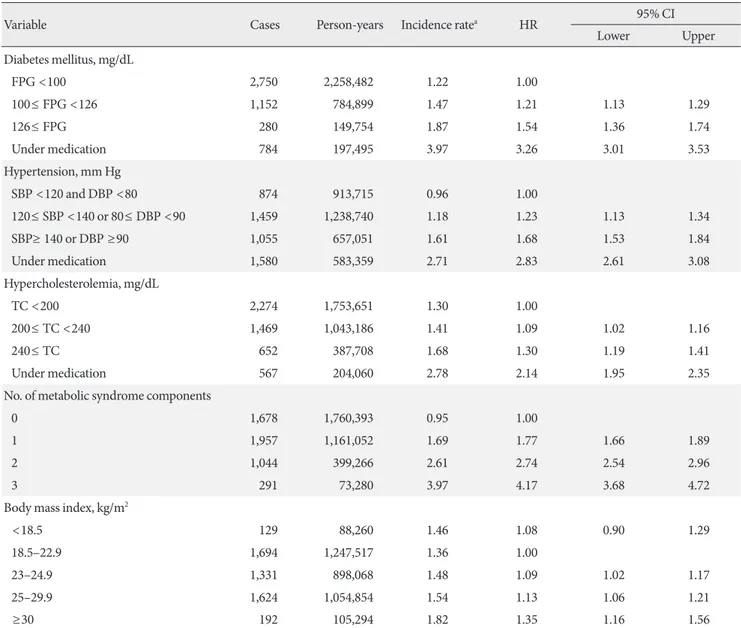
Table 2 shows the HR for POAG according to DM, hyperten- sion, and hypercholesterolemia parameters as well as obesity levels and number of metabolic syndrome components. People with higher FPG level had a higher risk of developing POAG ([HR, 1.21; 95% CI, 1.13 to 1.29] and [HR, 1.54; 95% CI, 1.36 to 1.74] for 100≤ FPG <126 and FPG ≥126 mg/dL, respec- tively). People with prior diagnosis of DM who were under medication also had increased risk of developing POAG (HR, 3.26; 95% CI, 3.01 to 3.53). Separately, people with higher SBP or DBP were more likely to develop POAG ([HR, 1.23; 95% CI, 1.13 to 1.34] and [HR, 1.68; 95% CI, 1.53 to 1.84] for 120≤ SBP
<140 or 80≤ DBP <90 and SBP ≥140 or DBP ≥90 mm Hg, respectively). Those with prior diagnosis of hypertension who are on medication were also more likely to develop POAG (HR, 2.83; 95% CI, 2.61 to 3.08). People with higher cholesterol lev-
els showed increased risk of developing POAG ([HR, 1.09;
95% CI, 1.02 to 1.16] and [HR, 1.30; 95% CI, 1.19 to 1.41] for 200≤ TC <240 and 240 mg/dL ≤ TC, respectively). People with prior diagnosis of hypercholesterolemia on medication showed a higher risk of developing POAG (HR, 2.14; 95% CI, 1.95 to 2.35), and people with a greater number of metabolic syndrome components were more likely to develop POAG ([HR, 1.77; 95% CI, 1.66 to 1.89], [HR, 2.74; 95% CI, 2.54 to 2.96], and [HR, 4.17; 95% CI, 3.68 to 4.72] for one, two, and
three risk factors, respectively).
Regarding obesity, people with BMI of 30 kg/m2 or greater were more likely to develop POAG than those with BMI be- tween 18.5 and 22.9 kg/m2, in a statistically significant manner (HR, 1.35; 95% CI, 1.16 to 1.56).
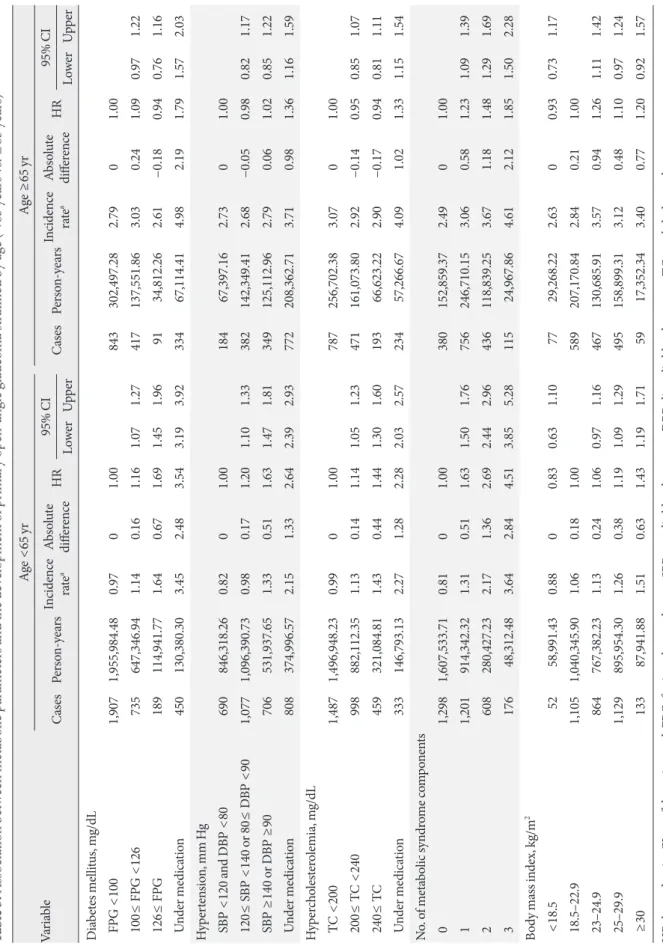
Furthermore, after stratifying by age, those younger than 65 years showed a relatively higher risk of developing POAG at higher levels of FPG, BP, cholesterol, and BMI and with greater number of metabolic syndrome components (Table 3). In comparison, those who were 65 years old or older showed rela- tively weaker relationships; those with prior diagnosis of DM, hypertension, or hypercholesterolemia under medication showed greater risk of developing POAG, but the levels of FPG, BP, cholesterol, and BMI did not lead to a statistically sig-
Characteristic
Development of glaucoma (n=4,970)Yes No
(n=282,583) P value
Hypertension <0.001
No 874 (17.59) 76,378 (27.04)
Prehypertension 1,459 (29.37) 103,312 (36.57) Newly diagnosed 1,055 (21.24) 54,568 (19.32) P rior diagnosis (under
medication) 1,580 (31.80) 48,232 (17.07) Hypercholesterolemia,
mg/dL <0.001
Total cholesterol <200 2,274 (45.83) 146,157 (51.80) 2 00≤ total cholesterol
<240 1,469 (29.60) 86,871 (30.79) 240≤ total cholesterol 652 (13.14) 32,214 (11.42) P rior diagnosis (under
medication) 567 (11.43) 16,893 (5.99)
BMI level, kg/m2 <0.001
<18.5 129 (2.60) 7,341 (2.60) ≥18.5 and <23 1,694 (34.08) 103,958 (36.79) ≥23 and <25 1,331 (26.78) 74,764 (26.46) ≥25 and <30 1,624 (32.68) 87,769 (31.06)
≥30 192 (3.86) 8,751 (3.10)
Income (low 20%) 744 (14.97) 44,493 (15.75) 0.137 Residential area (rural) 2,738 (55.09) 154,896 (54.81) 0.698 Values are presented as number (%) or mean±standard deviation.
BMI, body mass index; SBP, systolic blood pressure; DBP, diastolic blood pressure.
Table 1. Continued Table 1. Comparison of baseline characteristics between sub-
jects with and without glaucoma Characteristic
Development of glaucoma (n=4,970)Yes No
(n=282,583) P value Age ≥65 yr 1,687 (33.94) 44,790 (15.85) <0.001 Male sex 2,603 (52.37) 138,576 (49.04) <0.001
Height, cm 160.4±9.1 161.2±8.9 <0.001
Weight, kg 62.3±10.6 62.3±10.5 0.882
BMI, kg/m2 24.1±3.1 23.9±3.1 <0.001
SBP, mm Hg 130.4±18.3 126.1±17.8 <0.001
DBP, mm Hg 80.3±11.5 78.6±11.5 <0.001
Fasting plasma glucose,
mg/dL 107.1±43.3 98.5±31.3 <0.001
Total cholesterol, mg/dL 202.3±39.5 198.5±38.2 <0.001
Smoking <0.001
No 3,363 (74.82) 185,671 (72.18)
Past 216 (4.81) 11,817 (4.59)
Current 916 (20.38) 59,761 (23.23)
Alcohol <0.001
No 3,021 (62.46) 159,001 (58.58)
<2–3 times/mo 608 (12.57) 38,628 (14.23) ≥once/wk 1,208 (24.97) 73,788 (27.19)
Exercise <0.001
No 2,682 (55.38) 154,422 (56.21)
≤4 times/wk 1,511 (31.20) 93,662 (34.09) ≥5 times/wk 650 (13.42) 26,635 (9.70)
Diabetes mellitus, mg/dL <0.001
Glucose <100 2,750 (55.38) 188,299 (66.70) 100≤ glucose <126 1,152 (23.20) 65,349 (23.15) 126≤ glucose 280 (5.64) 12,431 (4.40) P rior diagnosis (under
medication) 784 (15.79) 16,224 (5.75)
(Continued to the next)
nificant difference regarding the hazard of developing POAG.
Separately, those aged 65 years or older with a greater number of metabolic syndrome components showed a greater risk of incident POAG. Also, in terms of absolute risk increment, the incidence rates of developing POAG at higher levels of FPG, BP, cholesterol, and BMI were higher in those younger than 65 years of age compared with those 65 years of age or older.
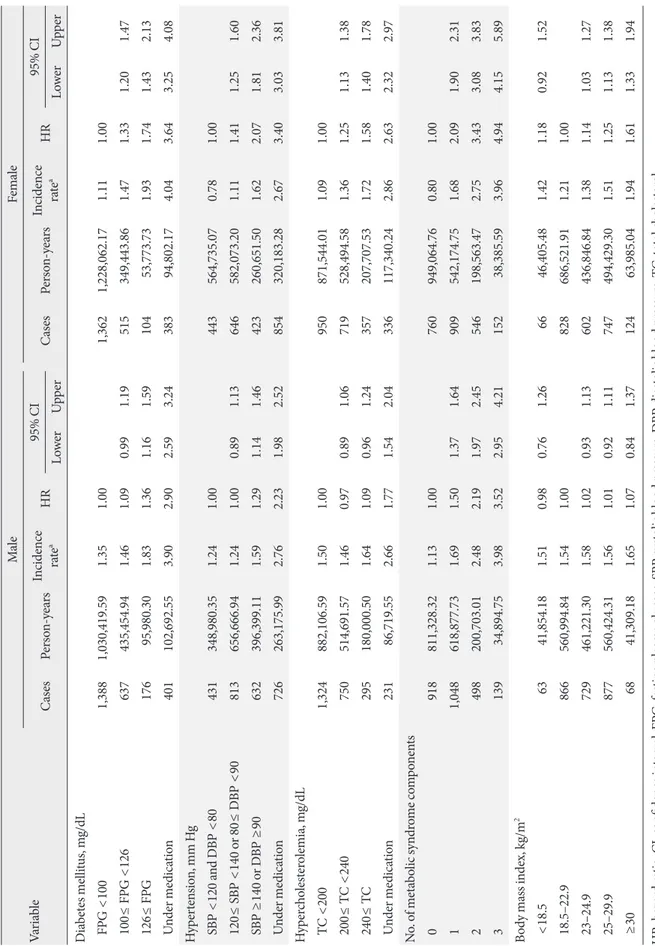
Moreover, when stratified by sex, both men and women ex- hibited significantly higher risks of developing POAG at higher levels of FPG, BP, and cholesterol and with greater number of
metabolic syndrome components, but the HR was higher in women than in men (Table 4). Regarding BMI, higher BMI level increased the hazard of developing POAG only in women ([HR, 1.14; 95% CI, 1.03 to 1.27], [HR, 1.25; 95% CI, 1.13 to 1.38], and [HR, 1.61; 95% CI, 1.33 to 1.94] for BMI of 23 to 24.9, 25 to 29.9, and ≥30 kg/m2, respectively).
Association with open-angle glaucoma: MHO individuals vs. MUNO individuals
Table 5 shows HR values for developing POAG according to Table 2. Association between metabolic parameters and the development of primary open-angle glaucoma
Variable Cases Person-years Incidence ratea HR 95% CI
Lower Upper
Diabetes mellitus, mg/dL
FPG <100 2,750 2,258,482 1.22 1.00
100≤ FPG <126 1,152 784,899 1.47 1.21 1.13 1.29
126≤ FPG 280 149,754 1.87 1.54 1.36 1.74
Under medication 784 197,495 3.97 3.26 3.01 3.53
Hypertension, mm Hg
SBP <120 and DBP <80 874 913,715 0.96 1.00
120≤ SBP <140 or 80≤ DBP <90 1,459 1,238,740 1.18 1.23 1.13 1.34
SBP ≥ 140 or DBP ≥90 1,055 657,051 1.61 1.68 1.53 1.84
Under medication 1,580 583,359 2.71 2.83 2.61 3.08
Hypercholesterolemia, mg/dL
TC <200 2,274 1,753,651 1.30 1.00
200≤ TC <240 1,469 1,043,186 1.41 1.09 1.02 1.16
240≤ TC 652 387,708 1.68 1.30 1.19 1.41
Under medication 567 204,060 2.78 2.14 1.95 2.35
No. of metabolic syndrome components
0 1,678 1,760,393 0.95 1.00
1 1,957 1,161,052 1.69 1.77 1.66 1.89
2 1,044 399,266 2.61 2.74 2.54 2.96
3 291 73,280 3.97 4.17 3.68 4.72
Body mass index, kg/m2
<18.5 129 88,260 1.46 1.08 0.90 1.29
18.5–22.9 1,694 1,247,517 1.36 1.00
23–24.9 1,331 898,068 1.48 1.09 1.02 1.17
25–29.9 1,624 1,054,854 1.54 1.13 1.06 1.21
≥30 192 105,294 1.82 1.35 1.16 1.56
HR, hazard ratio; CI, confidence interval; FPG, fasting plasma glucose; SBP, systolic blood pressure; DBP, diastolic blood pressure; TC, total cho- lesterol.
aPer 1,000 person-years.
Table 3. Association between metabolic parameters and the development of primary open-angle glaucoma stratified by age (<65 years vs. ≥65 years) VariableAge <65 yrAge ≥65 yr CasesPerson-yearsIncidence rateaAbsolute differenceHR95% CI CasesPerson-yearsIncidence rateaAbsolute differenceHR 95% CI LowerUpperLowerUpper Diabetes mellitus, mg/dL FPG <100 1,9071,955,984.480.97 01.00 843302,497.282.79 01.00 100≤ FPG <126 735647,346.941.14 0.16 1.16 1.07 1.27 417137,551.863.03 0.24 1.09 0.97 1.22 126≤ FPG189114,941.771.64 0.67 1.69 1.45 1.96 9134,812.262.61 −0.18 0.94 0.76 1.16 Under medication450130,380.303.45 2.483.54 3.19 3.92 33467,114.414.98 2.19 1.79 1.57 2.03 Hypertension, mm Hg SBP <120 and DBP <80690846,318.260.82 01.00 18467,397.162.73 01.00 120≤ SBP <140 or 80≤ DBP <901,0771,096,390.730.98 0.17 1.20 1.10 1.33 382142,349.412.68 −0.05 0.98 0.82 1.17 SBP ≥140 or DBP ≥90 706531,937.651.33 0.51 1.63 1.47 1.81 349125,112.962.79 0.06 1.02 0.85 1.22 Under medication808374,996.572.15 1.33 2.64 2.39 2.93 772208,362.713.71 0.98 1.36 1.16 1.59 Hypercholesterolemia, mg/dL TC <2001,4871,496,948.230.99 01.00 787256,702.383.07 01.00 200≤ TC <240998882,112.351.13 0.14 1.14 1.05 1.23 471161,073.802.92 −0.14 0.95 0.85 1.07 240≤ TC459321,084.811.43 0.44 1.44 1.30 1.60 19366,623.222.90 −0.17 0.94 0.81 1.11 Under medication333146,793.132.27 1.28 2.28 2.03 2.57 23457,266.674.09 1.02 1.33 1.15 1.54 No. of metabolic syndrome components 01,2981,607,533.710.81 01.00 380152,859.372.49 01.00 11,201914,342.321.31 0.51 1.63 1.50 1.76 756246,710.153.06 0.58 1.23 1.09 1.39 2608280,427.232.17 1.36 2.69 2.44 2.96 436118,839.253.67 1.18 1.48 1.29 1.69 317648,312.483.64 2.84 4.51 3.85 5.28 11524,967.864.61 2.12 1.85 1.50 2.28 Body mass index, kg/m2 <18.55258,991.430.88 00.830.631.107729,268.222.63 00.930.731.17 18.5–22.91,1051,040,345.901.06 0.18 1.00589207,170.842.84 0.21 1.00 23–24.9864767,382.231.13 0.24 1.060.971.16467130,685.913.57 0.94 1.261.111.42 25–29.91,129895,954.301.26 0.38 1.191.091.29495158,899.313.12 0.48 1.100.971.24 ≥3013387,941.881.51 0.63 1.431.191.715917,352.343.40 0.77 1.200.921.57 HR, hazard ratio; CI, confidence interval; FPG, fasting plasma glucose; SBP, systolic blood pressure; DBP, diastolic blood pressure; TC, total cholesterol. a Per 1,000 person-years.
Table 4. Association between metabolic parameters and the development of primary open-angle glaucoma stratified by gender VariableMaleFemale CasesPerson-yearsIncidence rateaHR95% CI CasesPerson-yearsIncidence rateaHR 95% CI LowerUpperLowerUpper Diabetes mellitus, mg/dL FPG <100 1,3881,030,419.591.35 1.00 1,3621,228,062.171.11 1.00 100≤ FPG <126 637435,454.941.46 1.09 0.99 1.19 515349,443.861.47 1.33 1.20 1.47 126≤ FPG17695,980.301.83 1.36 1.16 1.59 10453,773.731.93 1.74 1.43 2.13 Under medication401102,692.553.90 2.90 2.59 3.24 38394,802.174.04 3.64 3.25 4.08 Hypertension, mm Hg SBP <120 and DBP <80431348,980.351.24 1.00 443564,735.070.78 1.00 120≤ SBP <140 or 80≤ DBP <90813656,666.941.24 1.00 0.89 1.13 646582,073.201.11 1.41 1.25 1.60 SBP ≥140 or DBP ≥90 632396,399.111.59 1.29 1.14 1.46 423260,651.501.62 2.07 1.81 2.36 Under medication726263,175.992.76 2.23 1.98 2.52 854320,183.282.67 3.40 3.03 3.81 Hypercholesterolemia, mg/dL TC <2001,324882,106.591.50 1.00 950871,544.011.09 1.00 200≤ TC <240750514,691.571.46 0.97 0.89 1.06 719528,494.581.36 1.25 1.13 1.38 240≤ TC295180,000.501.64 1.09 0.96 1.24 357207,707.531.72 1.58 1.40 1.78 Under medication23186,719.552.66 1.77 1.54 2.04 336117,340.242.86 2.63 2.32 2.97 No. of metabolic syndrome components 0918811,328.321.13 1.00 760949,064.760.80 1.00 11,048618,877.731.69 1.50 1.37 1.64 909542,174.751.68 2.09 1.90 2.31 2498200,703.012.48 2.19 1.97 2.45 546198,563.472.75 3.43 3.08 3.83 313934,894.753.98 3.52 2.95 4.21 15238,385.593.96 4.94 4.15 5.89 Body mass index, kg/m2 <18.56341,854.181.51 0.980.761.266646,405.481.42 1.180.921.52 18.5–22.9866560,994.841.54 1.00828686,521.911.21 1.00 23–24.9729461,221.301.58 1.020.931.13602436,846.841.38 1.141.031.27 25–29.9877560,424.311.56 1.010.921.11747494,429.301.51 1.251.131.38 ≥306841,309.181.65 1.070.841.3712463,985.041.94 1.611.331.94 HR, hazard ratio; CI, confidence interval; FPG, fasting plasma glucose; SBP, systolic blood pressure; DBP, diastolic blood pressure; TC, total cholesterol. a Per 1,000 person-years.
metabolic syndrome component and obesity status with and without adjustment for confounding factors.
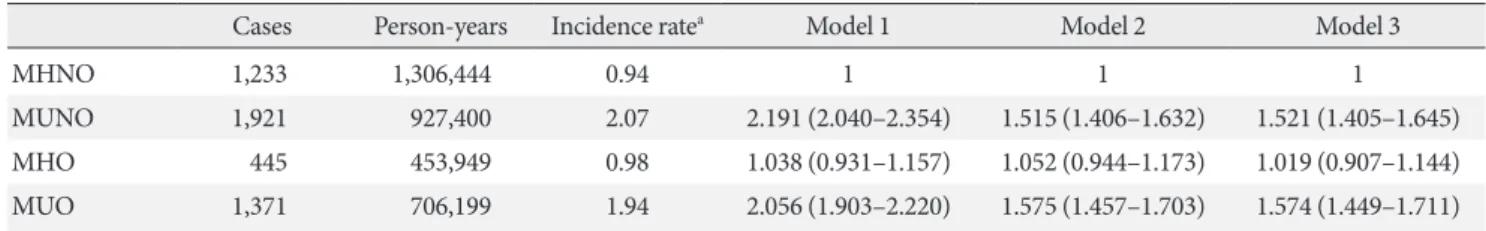
Compared with MHNO subjects, MUO individuals had an increased hazard of developing POAG before and after adjust- ing for age, sex, and sociodemographic confounding factors ([HR, 2.056; 95% CI, 1.903 to 2.220] and [adjusted HR, 1.574;
95% CI, 1.449 to 1.711]). MUNO individuals also showed a higher risk of developing POAG before and after adjusting for confounders ([HR, 2.191; 95% CI, 2.040 to 2.354] and [adjust- ed HR, 1.521; 95% CI, 1.405 to 1.645]), while MHO patients showed no significant difference in hazard of developing POAG before and after adjusting for covariates ([HR, 1.038;
95% CI, 0.931 to 1.157] and [adjusted HR, 1.019; 95% CI, 0.907
to 1.144]).
Fig. 1 shows Kaplan-Meier survival analysis for development of POAG according to metabolic status and obesity.
DISCUSSION
In this study, all components of metabolic syndrome including DM, hypertension, and hypercholesterolemia individually in- creased the risk of developing POAG. Also, higher level of FPG, BP, and TC each increased the risk of POAG incidence.
Furthermore, a greater number of metabolic syndrome com- ponents and higher level of FPG, BP, or cholesterol indepen- dently increased this risk. These trends were similarly observed Table 5. Association between metabolic status and incident primary open-angle glaucoma
Cases Person-years Incidence ratea Model 1 Model 2 Model 3
MHNO 1,233 1,306,444 0.94 1 1 1
MUNO 1,921 927,400 2.07 2.191 (2.040–2.354) 1.515 (1.406–1.632) 1.521 (1.405–1.645)
MHO 445 453,949 0.98 1.038 (0.931–1.157) 1.052 (0.944–1.173) 1.019 (0.907–1.144)
MUO 1,371 706,199 1.94 2.056 (1.903–2.220) 1.575 (1.457–1.703) 1.574 (1.449–1.711)
Values are presented as hazard ratio (95% confidence interval). Model 1: unadjusted; Model 2: adjusted for age, gender; Model 3: adjusted for age, gender, smoking, alcohol, exercise, income, and residential area.
MHNO, metabolically healthy nonobese; MUNO, metabolically unhealthy nonobese; MHO, metabolically health obese; MUO, metabolically unhealthy obese.
aPer 1,000 person-years.
Fig. 1. Kaplan Meier survival analysis (A) and cumulative incidence (B) of primary open-angle glaucoma according to metabolic status and obesity. MHNO, metabolically healthy nonobese; MUNO, metabolically unhealthy nonobese; MHO, metabolically health obese; MUO, metabolically unhealthy obese.
1.000 0.995 0.990 0.985 0.980 0.975 0.970
0.030 0.025 0.020 0.015 0.010 0.005 0
Survival probability Cumulative incidence
0 2 4 6 8 10 12 0 2 4 6 8 10 12
Time (yr) Time (yr)
MONW
MONW
P≤0.0001
P≤0.0001
MHNO
MHNO
MUNO
MUNO
MHO
MHO
MUO
MUO
A B
among both sexes and across age groups.
Moreover, regarding different combinations of metabolic status and obesity, we observed that metabolic status was more important than obesity, as individuals who were MUNO or MUO showed higher risk of developing POAG in comparison with those who were MHNO, whereas those who were MHO did not. This relationship was significant both before and after adjusting for age, sex, and sociodemographic confounding fac- tors.
Other studies have reported the association between meta- bolic syndrome and POAG development with various results.
Newman-Casey et al. [6] found that DM (HR, 1.35; 95% CI, 1.21 to 1.50) and hypertension (HR, 1.17; 95% CI, 1.13 to 1.22) individually increased the risk of developing open-angle glau- coma using medical claims data from throughout the United States. However, in their study, hyperlipidemia decreased the risk of open-angle glaucoma (HR, 0.95; 95% CI, 0.91 to 0.98).
In another study by Imai et al. [8], high levels of FPG, BP, and triglycerides were each related with high IOP. Kim et al. [9] re- ported that hypertension and impaired glucose tolerance were related with increased risk of glaucoma. In a cross-sectional study performed using a nationwide database, the prevalence of glaucoma was statistically significantly higher in those with greater numbers of metabolic syndrome components [9]. In addition, in the same study, the prevalence values of hyperten- sion, high FPG, and high triglycerides were higher in those with glaucoma than those without. Kim et al. [10] additionally reported a positive association between number of metabolic syndrome components and glaucoma.
There could be several possible reasons for increased risk of POAG development in patients with metabolic syndrome.
First, metabolic syndrome may increase IOP. Participants with metabolic syndrome showed higher IOP than did those with- out, and those with greater number of metabolic syndrome components also had higher IOP [8,21,22]. It has been hypoth- esized that hypertension may increase IOP by promoting greater blood flow to the ciliary artery, which results in exces- sive aqueous humor production [23]. Also, DM may elevate IOP by increasing the osmotic gradient, which can draw more aqueous humor into the anterior chamber [21]. This can also cause fibronectin accumulation in the trabecular meshwork, interrupting the aqueous outflow facility [24].
However, metabolic syndrome is reported to be related with certain findings in even normal-tension glaucoma (NTG) [10].
In one study, metabolic syndrome was independently related
with reduced retinal nerve fiber layer thickness, suggesting that metabolic syndrome may also be related with neurode- generation in glaucoma [25]. The positive relationship between metabolic syndrome components and POAG in our investiga- tion emphasized the possible relationship between metabolic syndrome and neurodegeneration in glaucoma, considering the greater prevalence of NTG in comparison with high-ten- sion glaucoma in Koreans than in other ethnicities [26].
Kim et al. [10] reported in a cross-sectional study that hy- pertension and impaired glucose tolerance increased the risk of NTG, and a greater number of metabolic syndrome compo- nents was positively related with NTG. Hypertension may cause arteriolosclerotic damage, while DM also causes damage to small blood vessels, which can reduce blood flow to the op- tic nerve head and promote endothelial cell dysfunction; this affects vascular autoregulation, increasing vulnerability to glaucomatous neurodegeneration [27,28]. Hypercholesterol- emia is an important risk factor for atherosclerosis [29] and may also reduce blood flow to the optic nerve head, resulting in ischemic damage to the retinal ganglion cells.
In our study, people with BMI of 30 kg/m2 or greater were more likely to develop POAG than were those with BMI be- tween 18.5 and 22.9 kg/m2. In a subgroup analysis, this rela- tionship was significant in those younger than 65 years of age and in women. Previous studies have noted that higher BMI was related with higher IOP, which is a major risk factor for POAG [30,31]. Cohen et al. [32] reported that obesity was an independent risk factor for elevated IOP. The Rotterdam Study separately reported that obesity was related with higher IOP [33]. The relationship between obesity and POAG, however, has not been established in a consistent manner. In a popula- tion-based study in the United States, Ko et al. [11] reported that BMI of 30 kg/m2 or greater was significantly associated with prevalence of glaucoma. Elsewhere, Zang and Wynder [14] found that high BMI was associated with glaucoma. How- ever, more studies have contrarily reported that prevalence of open-angle glaucoma was lower in the obese population [9,12,13]. The Barbados Eye Study also reported that those with high BMI showed decreased odds of open-angle glauco- ma [12]. Nangia et al. [13] reported that lower BMI was related with higher prevalence of glaucoma based on a population study in Central India. In addition, Gasser et al. [34] reported that obesity was not a risk factor for glaucoma. These varia- tions in results may be caused by different sociodemographic characteristics of the study populations, different definitions
used to define metabolic syndrome or POAG, and different factors used to adjust for confounding effects. The association between BMI and POAG remains unclear, and further re- search is warranted.
Furthermore, in subgroup analyses, the relative risk effects and the effect of metabolic syndrome components assessed by absolute incidence increments were greater in younger sub- jects. Similar results were found in the Blue Mountains Eye Study, in which the association between DM and POAG was significant in the younger age group but not in the older age group (≥70 years) [35]. The reason for this is unclear. Meta- bolic syndrome components may play a more important role in development of POAG in younger individuals. This may also be partly due to selection bias, indicating that younger subjects with metabolic syndrome components are more likely to visit an ophthalmologist than are those without [36].
We also compared the HR of developing POAG according to metabolic syndrome components and obesity status. Interest- ingly, those who were characterized as MUNO showed higher risk of developing POAG than those who were MHNO, but those who were MHO did not, indicating that metabolic status is more important than obesity. People who were MUNO were shown to exhibit impaired insulin sensitivity as well as higher BP, oxidative stress, abdominal adiposity, atherogenic lipid profile, risk of cardiovascular disease [37-39], and higher mor- tality compared with those who were MHO [17,40-42].
The strengths of this study are its large sample size represent- ing nationwide data and the combination of medical claims data and health examination data. In addition, it is a prospec- tive longitudinal cohort study that provides incidence and es- tablishes the temporal sequence required for causal inference.
Also, it provides graded associations between metabolic dis- ease severity, obesity, and POAG.
When interpreting our data, the following should be taken into consideration. First, patients with POAG were identified based on ICD-10 codes; those who did not visit hospitals were not included in this study. In addition, no information about POAG severity or subtype was available, so we could not grade the associations between metabolic status, obesity, and POAG.
Furthermore, other metabolic components such as waist cir- cumference, high-density lipoprotein C, and triglyceride level could not be included in our analysis because they were not in- cluded in the health examination until 2009, when the Nation- al Health Insurance Service revised the health examination categories.
In conclusion, we found that metabolic health status signifi- cantly increased the risk of POAG in this prospective cohort from a nationwide database. This emphasizes the importance of glaucoma screening in patients with metabolic syndrome and obesity, including not only those who are MUO, but also those who are MUNO.
CONFLICTS OF INTEREST
No potential conflict of interest relevant to this article was re- ported.
AUTHOR CONTRIBUTIONS
Conception or design: Y.J., K.H.
Acquisition, analysis, or interpretation of data: Y.J., K.H., H.
Y.L.P., S.H.L.
Drafting the work or revising: Y.J., S.H.L., C.K.P.
Final approval of the manuscript: Y.J., K.H., H.Y.L.P., S.H.L., C.K.P.
ORCID
Younhea Jung https://orcid.org/0000-0003-4223-0923 Chan Kee Park https://orcid.org/0000-0002-0922-8293
ACKNOWLEDGMENTS
The National Health Insurance Claims Database was provided by the National Health Insurance Sharing Service (NHISS) of Korea.
REFERENCES
1. Tham YC, Li X, Wong TY, Quigley HA, Aung T, Cheng CY.
Global prevalence of glaucoma and projections of glaucoma burden through 2040: a systematic review and meta-analysis.
Ophthalmology 2014;121:2081-90.
2. Sommer A, Tielsch JM, Katz J, Quigley HA, Gottsch JD, Javitt J, Singh K. Relationship between intraocular pressure and pri- mary open angle glaucoma among white and black Americans.
The Baltimore Eye Survey. Arch Ophthalmol 1991;109:1090-5.
3. Tielsch JM, Katz J, Sommer A, Quigley HA, Javitt JC. Family history and risk of primary open angle glaucoma. The Balti- more Eye Survey. Arch Ophthalmol 1994;112:69-73.
4. Mitchell P, Smith W, Attebo K, Healey PR. Prevalence of open- angle glaucoma in Australia. The Blue Mountains Eye Study.
Ophthalmology 1996;103:1661-9.
5. Tielsch JM, Katz J, Singh K, Quigley HA, Gottsch JD, Javitt J, Sommer A. A population-based evaluation of glaucoma screen- ing: the Baltimore Eye Survey. Am J Epidemiol 1991;134:1102- 10.
6. Newman-Casey PA, Talwar N, Nan B, Musch DC, Stein JD.
The relationship between components of metabolic syndrome and open-angle glaucoma. Ophthalmology 2011;118:1318-26.
7. Zheng Y, Wong TY, Mitchell P, Friedman DS, He M, Aung T.
Distribution of ocular perfusion pressure and its relationship with open-angle glaucoma: the Singapore Malay Eye Study. In- vest Ophthalmol Vis Sci 2010;51:3399-404.
8. Imai K, Hamaguchi M, Mori K, Takeda N, Fukui M, Kato T, Kawahito Y, Kinoshita S, Kojima T. Metabolic syndrome as a risk factor for high-ocular tension. Int J Obes (Lond) 2010;34:
1209-17.
9. Kim HA, Han K, Lee YA, Choi JA, Park YM. Differential asso- ciation of metabolic risk factors with open angle glaucoma ac- cording to obesity in a Korean population. Sci Rep 2016;6:
38283.
10. Kim M, Jeoung JW, Park KH, Oh WH, Choi HJ, Kim DM.
Metabolic syndrome as a risk factor in normal-tension glauco- ma. Acta Ophthalmol 2014;92:e637-43.
11. Ko F, Boland MV, Gupta P, Gadkaree SK, Vitale S, Guallar E, Zhao D, Friedman DS. Diabetes, triglyceride levels, and other risk factors for glaucoma in the National Health and Nutrition Examination Survey 2005-2008. Invest Ophthalmol Vis Sci 2016;57:2152-7.
12. Leske MC, Connell AM, Wu SY, Hyman LG, Schachat AP. Risk factors for open-angle glaucoma. The Barbados Eye Study.
Arch Ophthalmol 1995;113:918-24.
13. Nangia V, Jonas JB, Matin A, Bhojwani K, Sinha A, Kulkarni M, Gupta R, Khare A, Agarwal S, Bhate K, Nangia P, Nangia P, Panda-Jonas S. Prevalence and associated factors of glaucoma in rural central India. The Central India Eye and Medical Study. PLoS One 2013;8:e76434.
14. Zang EA, Wynder EL. The association between body mass in- dex and the relative frequencies of diseases in a sample of hos- pitalized patients. Nutr Cancer 1994;21:247-61.
15. Karelis AD, Faraj M, Bastard JP, St-Pierre DH, Brochu M, Prud’homme D, Rabasa-Lhoret R. The metabolically healthy but obese individual presents a favorable inflammation profile.
J Clin Endocrinol Metab 2005;90:4145-50.
16. Yang HK, Han K, Kwon HS, Park YM, Cho JH, Yoon KH, Kang MI, Cha BY, Lee SH. Obesity, metabolic health, and mor- tality in adults: a nationwide population-based study in Korea.
Sci Rep 2016;6:30329.
17. Dvorak RV, DeNino WF, Ades PA, Poehlman ET. Phenotypic characteristics associated with insulin resistance in metaboli- cally obese but normal-weight young women. Diabetes 1999;
48:2210-4.
18. Meigs JB, Wilson PW, Fox CS, Vasan RS, Nathan DM, Sullivan LM, D’Agostino RB. Body mass index, metabolic syndrome, and risk of type 2 diabetes or cardiovascular disease. J Clin En- docrinol Metab 2006;91:2906-12.
19. Teixeira TF, Alves RD, Moreira AP, Peluzio Mdo C. Main char- acteristics of metabolically obese normal weight and metaboli- cally healthy obese phenotypes. Nutr Rev 2015;73:175-90.
20. Kwon S. Payment system reform for health care providers in Korea. Health Policy Plan 2003;18:84-92.
21. Oh SW, Lee S, Park C, Kim DJ. Elevated intraocular pressure is associated with insulin resistance and metabolic syndrome.
Diabetes Metab Res Rev 2005;21:434-40.
22. Son J, Koh H, Son J. The association between intraocular pres- sure and different combination of metabolic syndrome com- ponents. BMC Ophthalmol 2016;16:76.
23. Bulpitt CJ, Hodes C, Everitt MG. Intraocular pressure and sys- temic blood pressure in the elderly. Br J Ophthalmol 1975;59:
717-20.
24. Sato T, Roy S. Effect of high glucose on fibronectin expression and cell proliferation in trabecular meshwork cells. Invest Oph- thalmol Vis Sci 2002;43:170-5.
25. Zarei R, Anvari P, Eslami Y, Fakhraie G, Mohammadi M, Ja- mali A, Afarideh M, Ghajar A, Heydarzade S, Esteghamati A, Moghimi S. Retinal nerve fibre layer thickness is reduced in metabolic syndrome. Diabet Med 2017;34:1061-6.
26. Cho HK, Kee C. Population-based glaucoma prevalence stud- ies in Asians. Surv Ophthalmol 2014;59:434-47.
27. Szaflik JP, Rusin P, Zaleska-Zmijewska A, Kowalski M, Ma- jsterek I, Szaflik J. Reactive oxygen species promote localized DNA damage in glaucoma-iris tissues of elderly patients vul- nerable to diabetic injury. Mutat Res 2010;697:19-23.
28. Flammer J, Mozaffarieh M. Autoregulation, a balancing act be- tween supply and demand. Can J Ophthalmol 2008;43:317-21.
29. Lin HC, Chien CW, Hu CC, Ho JD. Comparison of comorbid conditions between open-angle glaucoma patients and a con- trol cohort: a case-control study. Ophthalmology 2010;117:2088- 95.
30. Mori K, Ando F, Nomura H, Sato Y, Shimokata H. Relationship between intraocular pressure and obesity in Japan. Int J Epide- miol 2000;29:661-6.
31. Jonas JB, Nangia V, Matin A, Sinha A, Kulkarni M, Bhojwani K.
Intraocular pressure and associated factors: the central India eye and medical study. J Glaucoma 2011;20:405-9.
32. Cohen E, Kramer M, Shochat T, Goldberg E, Garty M, Krause I. Relationship between body mass index and intraocular pres- sure in men and women: a population-based study. J Glauco- ma 2016;25:e509-13.
33. Ramdas WD, Wolfs RC, Hofman A, de Jong PT, Vingerling JR, Jansonius NM. Lifestyle and risk of developing open-angle glau- coma: the Rotterdam study. Arch Ophthalmol 2011;129:767-72.
34. Gasser P, Stumpfig D, Schotzau A, Ackermann-Liebrich U, Flammer J. Body mass index in glaucoma. J Glaucoma 1999;8:8- 11.
35. Mitchell P, Smith W, Chey T, Healey PR. Open-angle glaucoma and diabetes: the Blue Mountains eye study, Australia. Oph- thalmology 1997;104:712-8.
36. Tielsch JM, Katz J, Quigley HA, Javitt JC, Sommer A. Diabetes, intraocular pressure, and primary open-angle glaucoma in the Baltimore Eye Survey. Ophthalmology 1995;102:48-53.
37. Kim M, Paik JK, Kang R, Kim SY, Lee SH, Lee JH. Increased oxidative stress in normal-weight postmenopausal women with metabolic syndrome compared with metabolically healthy
overweight/obese individuals. Metabolism 2013;62:554-60.
38. Kwon BJ, Kim DW, Her SH, Kim DB, Jang SW, Cho EJ, Ihm SH, Kim HY, Youn HJ, Seung KB, Kim JH, Rho TH. Metaboli- cally obese status with normal weight is associated with both the prevalence and severity of angiographic coronary artery disease. Metabolism 2013;62:952-60.
39. Choi KM, Cho HJ, Choi HY, Yang SJ, Yoo HJ, Seo JA, Kim SG, Baik SH, Choi DS, Kim NH. Higher mortality in metabolically obese normal-weight people than in metabolically healthy obese subjects in elderly Koreans. Clin Endocrinol (Oxf) 2013;
79:364-70.
40. Conus F, Allison DB, Rabasa-Lhoret R, St-Onge M, St-Pierre DH, Tremblay-Lebeau A, Poehlman ET. Metabolic and behav- ioral characteristics of metabolically obese but normal-weight women. J Clin Endocrinol Metab 2004;89:5013-20.
41. Lee SH, Ha HS, Park YJ, Lee JH, Yim HW, Yoon KH, Kang MI, Lee WC, Son HY, Park YM, Kwon HS. Identifying metaboli- cally obese but normal-weight (MONW) individuals in a non- diabetic Korean population: the Chungju Metabolic disease Cohort (CMC) study. Clin Endocrinol (Oxf) 2011;75:475-81.
42. Lee SH, Han K, Yang HK, Kim HS, Cho JH, Kwon HS, Park YM, Cha BY, Yoon KH. A novel criterion for identifying meta- bolically obese but normal weight individuals using the prod- uct of triglycerides and glucose. Nutr Diabetes 2015;5:e149.