Dynamic Contrast-Enhanced MRI of the Prostate: Can Auto-Generated Wash-in Color Map Be Useful in
Detecting Focal Lesion Enhancement?
INTRODUCTION
With the advances in magnetic resonance imaging (MRI) and the enablement of anatomic, functional, and physiologic assessment of the prostate, MRI has been widely used for prostate cancer detection and for the evaluation of clinically significant prostate cancer. The utility of multiparametric MRI (mpMRI), which includes T2- weighted imaging (T2WI), diffusion-weighted imaging (DWI), and dynamic contrast- enhanced MRI (DCE MRI), has been demonstrated in patients with suspected prostate cancer. Therefore, mpMRI is currently recommended in prostate cancer patients by the Prostate Imaging Reporting and Data System (PI-RADS) version 2 (1, 2).
Each pulse sequence included in mpMRI differs in significance based on the
This is an Open Access article distributed under the terms of the Creative Commons Attribution Non-Commercial License (http://creativecommons.org/licenses/
by-nc/4.0/) which permits unrestricted non-commercial use, distribution, and reproduction in any medium, provided the original work is properly cited.
Received: April 17, 2019 Revised: June 19, 2019 Accepted: July 29, 2019 Correspondence to:
Moon Hyung Choi, M.D.
Department of Radiology, Eunpyeong St. Mary’s Hospital, College of Medicine, The Catholic University of Korea, 1021 Tongil- ro, Eunpyeong-gu, Seoul 03312, Korea.
Tel. +82-2-2030-3013 Fax. +82-2-2030-3026 E-mail: [email protected]
Copyright © 2019 Korean Society of Magnetic Resonance in Medicine (KSMRM)
Original Article
Purpose: To evaluate the usefulness of wash-in color map in detecting early enhancement of prostate focal lesion compared to whole dynamic contrast-enhanced MRI (DEC MRI) images.
Materials and Methods: This study engaged 50 prostate cancer patients who underwent multiparametric MRI and radical prostatectomy as subjects. An expert [R1]
and a trainee [R2] independently evaluated early enhancement and recorded the time needed to review 1) a wash-in color map and 2) whole DCE MRI images.
Results: The review of whole DCE images by R1 showed fair agreement with color map by R1, whole images by R2, and color map by R2 (weighted kappa values = 0.59, 0.44, and 0.58, respectively). Both readers took a significantly shorter time to review the color maps as compared to whole images (P < 0.001).
Conclusion: A trainee could achieve better agreement with an expert when using wash-in color maps than when using whole DCE MRI images. Also, color maps took a significantly shorter evaluation time than whole images.
Keywords: Prostate cancer; Magnetic resonance imaging; Dynamic contrast- enhanced imaging
Ji Min Yoon1, Moon Hyung Choi2,3, Young Joon Lee2,3, Seung Eun Jung2,3
1Department of Radiology, Seoul St. Mary's Hospital, College of Medicine, The Catholic University of Korea, Seoul, Korea
2Department of Radiology, Eunpyeong St. Mary's Hospital, College of Medicine, The Catholic University of Korea, Seoul, Korea
3Catholic Smart Imaging Center, Eunpyeong St. Mary's Hospital, College of Medicine, The Catholic University of Korea, Seoul, Korea
location of the lesion. In PI-RADS version 2, T2WI and DWI are considered dominant sequences for lesions in the transitional and peripheral zones, respectively, whereas DCE MRI plays a minor role for peripheral zone lesions (2).
Recently, a meta-analysis had shown that the performance of biparametric MRI (T2WI and DWI) was similar to that of mpMRI (3). However, various studies have shown that DCE MRI of the prostate has significant influence on prostate cancer detection and characterization (4, 5). Also, other studies have shown that assessing DWI or T2WI combined with DCE MRI have improved cancer detection and predicted malignant potential (6, 7). Therefore, DCE MRI seems to play a role in prostate evaluation despite the controversy over clinical importance.
In PI-RADS version 2, enhancement evaluation is based on a qualitative visual assessment of the individual time points on DCE MRI, and it is recommended that the source images are assessed (4). However, since DCE MRI consists of several hundred images per evaluation, reviewing source images is a time-consuming procedure. Parametric color- coded maps have the potential to simplify evaluation of DCE MRI. Although quantitative analysis of pharmacokinetic parameters from DCE MRI has shown significant differences between benign lesions and prostate cancer and significant correlation with cancer aggressiveness, the parameters cannot directly represent the presence of early enhancement (8-11). Therefore, a color map that reflects the degree of enhancement in early phase of DCE MRI was used in this study. The objective of this study was to evaluate the usefulness of wash-in color map in detecting early enhancement of prostate focal lesion compared to whole dynamic contrast-enhanced MRI (DEC MRI) images according to radiologists’ experience
MATERIALS AND METHODS
The Institutional Review Board of the hospital approved this retrospective study and informed consent was waived.
Study Population
A retrospective review of medical records and imaging results of patients who had undergone prostatectomy for prostate cancer between January 2015 and July 2016 was performed. Among 57 patients who had undergone prostate MRI using a 3-T MRI before radical prostatectomy at our institution, 6 patients with MRI lacking a color map and 1 with a non-enhanced MRI were excluded. The 50 patients who were used as subjects had a mean age of 67.1 ± 6.6
years old [range, 50-79]). Clinical information, including patient age, prostate specific antigen (PSA) level before surgery, and pathologic characteristics such as tumor size, Gleason score, and stage, were collected based on the electronic medical record.
MR Image Acquisition
All preoperative MRIs were performed with a 3-T MRI unit (MAGENETOM Verio, Siemens Healthcare, Erlangen, Germany) using a pelvic-phased array coil. An endorectal coil was not used for prostate imaging. The following parameters were used for axial, sagittal, and coronal T2- weighted turbo spin echo (TSE) images (repetition time [TR]
> 3200 ms, echo time [TE] 80-100 ms; echo train length, 14-18; matrix, 320 × 320; slice thickness, 3 mm; field of view [FOV], 200-220 mm); axial T1-weighted TSE images (TR 400 ms, TE 10 ms; slice thickness, 3 mm; matrix, 320
× 320; FOV, 200-220 mm); axial DWI (b value 0, 50, 500, and 1000; slice thickness, 3 mm; matrix, 100 × 100; FOV, 200-220 mm); and DCE MRI (TR, 4.4 ms; TE 2.1 ms; slice thickness, 3 mm; matrix 320 × 160, FOV 220 mm). Apparent diffusion-coefficient (ADC) maps were generated from DWI with b values of 50 and 1000 sec/mm2. DCE MRI images were acquired for more than 3 minutes after a 0.1 mmol/
kg gadobutrol (Gadavist, Bayer Schering Pharma, Berlin, Germany) injection (temporal resolution, 5-7s). Subtracted DCE MRI images were used for image analysis.
Inline Wash-in Color Map
MRI standard option was used to automatically generate color-coded wash-in maps after image acquisition from DCE MRI (12). These maps reflect the percentage enhancement from the signal intensity changes between the first image and the images obtained for one minute after contrast infusion. The highest percentage signal intensity change within one minute was selected for display on the color map. Therefore, the color maps account for the degree of maximal enhancement within one minute regardless of the time when the maximal enhancement appears. The degree of percentage enhancement was coded using different colors; high values were red while low values were blue.
Image Analysis
Two sets of images from the 50 patients were reviewed:
1) T2WI, DWI, and DCE whole images and 2) T2WI and DWI with wash-in color maps. Without patient’s histopathology information, two radiologists reviewed randomly ordered prostate MRI image sets in two different sessions separated
by at least two weeks. Reader 1 (R1) was an expert radiologist with a specialty in genitourinary radiology while reader 2 (R2) was a second-year trainee in radiology. In each patient, reader 1 selected one T2-low signal intensity focal lesion with diffusion restriction. The region corresponded to a pathologically confirmed index malignant lesion. The selected areas were indicated using an arrow on either T2WI or DWI. This focal lesion was selected without reviewing DCE MRI. R1 initiated image review one month after lesion selection and the order of patients was modified to avoid recall bias. Both readers reviewed the selected lesion and
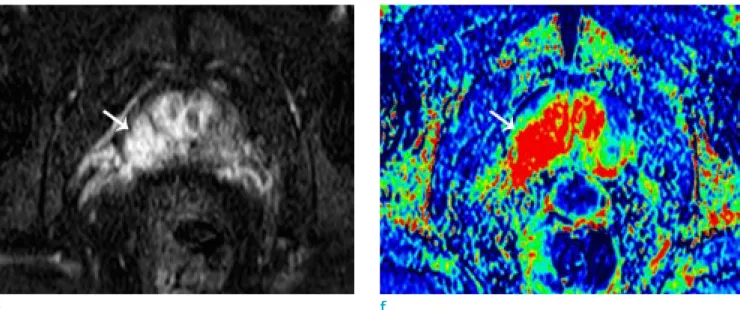
was asked 1) to grade the confidence of the enhancement at the marked focal lesion from grade 1 (definitely no enhancement) to grade 6 (definite enhancement) and 2) to record the time taken for the evaluation. Additionally, since only the presence of early enhancement, not the degree of confidence, was stated in the PI-RAD, the degree of confidence was divided into two groups-grade 1-3 as negative early enhancement group and grade 4-6 as positive early enhancement group. The results of DCE whole images by R1 were regarded as the gold standard. Figure 1 shows images of a representative case.
a b
c d
Fig. 1. A 66-year-old male patient with prostate cancer (Gleason score 8 [4+4]). Focal low signal intensity is shown at the right peripheral zone (arrows) on T2WI (a) and T1WI (b). The lesion showed diffusion restriction on DWI (c) and the ADC map (d).
Statistical Analysis
Agreement in confidence grades of the gold standard (DCE whole images by R1), results of the wash-in color map by the two readers, and DCE whole images by R2 were evaluated using weighted kappa statistics. Kappa values were interpreted as follows: 0-0.20, poor agreement; 0.21- 0.40, fair agreement; 0.41-0.60, moderate agreement;
0.61-0.80, good agreement; 0.81-1.0, excellent agreement.
Times taken to evaluate the two image sets by the two readers were compared using a Wilcoxon signed-rank test. Correlations among prostate cancer Gleason score, confidence grade, and evaluation time was assessed with a Pearson correlation coefficient test. The differences in the confidence grade and evaluation time based on Gleason score were analyzed using a Kruskal-Wallis test. Statistical analysis was performed with SPSS 24.0 (IBM Corporation, Armonk, NY, USA). A p-value less than 0.05 was considered statistically significant.
RESULTS
Fifty prostate cancer patients were included as subjects in this study. The mean preoperative PSA level was 12.0 ng/mL (range, 3.52-62.68 ng/mL). The characteristics of enrolled patients were as summarized in Table 1.
The agreements between gold standard (DCE whole images result from R1) and color map by R1, DCE whole images by R2, and color map by R2 were fair with weighted
kappa values of 0.59, 0.44, and 0.58, respectively (Table 2). For reader 2, the color map results showed higher agreement than DCE whole images to gold standard images.
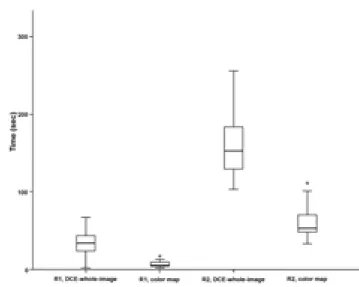
Both readers took a significantly shorter time to review the color map than DCE whole images (P < 0.001). Moreover, R1 evaluation time was significantly shorter than R2 for both image sets (P < 0.001) (Fig. 2). When the degree of
Table 1. Baseline Characteristics
Age (years), mean ± SD (range) 67.1 ± 6.6 (50-79) PSA (ng/mL), mean ± SD (range) 12.0 ± 11.9 (3.52-62.68) Gleason score, n (%)
≤ 6 6 (12.0)
7 (3+4) 15 (30.0)
7 (4+3) 19 (38.0)
8 8 (16.0)
9 or 10 2 (10.0)
T stage, n (%)
T2a 4 (8.0)
T2b 1 (2.0)
T2c 26 (52.0)
T3a 12 (24.0)
T3b 6 (12.0)
T4 1 (2.0)
PSA = prostate specific antigen; SD = standard deviation
Fig. 1. Early enhancement was noted on DCE whole images (e) and the color map (f).
e f
confidence in early enhancement was divided into two groups, the three results (color map by R1, DCE whole images by R2, and color map by R2) showed fair agreement with gold standard, showing kappa values of 0.54, 0.42 and 0.40.
The confidence grade for positive enhancement significantly increased with increase in Gleason score in color map review by both readers and the DCE whole image review by R2 (Fig. 3). Even though the R1 review of the DCE whole images did not show significant differences in confidence scores according to Gleason scores, the confidence scores were elevated in higher Gleason score tumors (P = 0.053). Evaluation time in the two image sets by the two readers tended to decrease with increasing Gleason score. Only the color map review by R1 showed statistical significance (P = 0.010) (Fig. 3).
DISCUSSION
This study introduced a method for evaluating prostate cancer through an automatically generated color-coded wash-in map reflecting the highest value of percent enhancement in each pixel within one minute after contrast injection. From the comparison between DCE whole images and color map, a trainee showed better agreement in reviewing color map than that of reviewing DCE whole images, with an experienced radiologist. Evaluation time was significantly shorter for color map review for both readers. Therefore, color maps may be useful in daily practice for evaluating prostate focal lesions in mpMRI.
PI-RADS v2 recommends obtaining DCE MRI as one of the essential mpMRI sequences. Although there have been many discussions around the usefulness of biparametric MRI without DCE MRI, some studies have demonstrated an important role for DCE MRI. For instance, DCE MRI could stratify prostate cancer aggressiveness and characterize the prostate lesions under suspicion as cancerous (5-8).
Therefore, DCE MRI cannot be dismissed yet. However, since DCE MRI consists of large numbers of images, it takes more time to obtain and read the images. PI-RADS version 2 recommends assessing whether there is early enhancement in a focal lesion corresponding to T2WI and DWI. It also recommends analyzing DCE MRI using direct visual assessment of the individual DCE time-points at each slice location by either manual scrolling or cine mode (2).
Therefore, if reading automatically generated color-coded maps could determine early enhancement and yield similar Table 2. Comparison of Confidence Grades from Two Readers
between DCE Whole Images and Color Maps R1, DCE whole images
1 2 3 4 5 6
R1, color map
1 0 0 0 0 0 0
2 3 2 1 1 1 1
3 1 1 1 0 0 1
4 0 1 0 0 1 1
5 1 1 1 1 3 6
6 1 0 0 0 2 18
R2, DCE whole images
1 0 0 0 0 0 0
2 1 4 0 0 0 1
3 1 0 1 0 0 3
4 2 0 1 0 0 3
5 1 1 1 2 5 9
6 1 0 0 0 2 11
R2, color map
1 0 0 1 0 0 0
2 4 1 0 0 1 3
3 1 1 0 0 1 1
4 1 1 0 0 0 1
5 0 2 2 2 3 8
6 0 0 0 0 2 14
DCE = dynamic contrast enhanced
Fig. 2. Box-whisker plot of the time consumed by two readers for evaluating DCE whole images and color maps.
results to DCE MRI whole image review, it would be useful in daily practice for radiologists.
Since the clinical usefulness of DCE parameters, such as Ktrans and Kvp, in characterizing prostate cancer is still controversial, the use of parametric maps or analysis of time-intensity curves from DCE MRI is no longer recommended in PI-RADS v2 (11, 13-17). Although these parameters could be used for differentiating prostate cancer from benign lesions or aggressive cancer from non- aggressive cancer, they were based on pharmacokinetic models for describing contrast medium in tissue at a cellular level (11, 14, 18). Therefore, color maps of pharmacokinetic parameters do not directly reflect the early enhancement of the tissue, and evaluating those maps cannot achieve the goal of evaluating DCE MRI in PI-RADS v2, i.e. to assess the presence of early enhancement. Another issue with parametric maps and time-intensity curve analysis is that they demand additional effort and time. Therefore, a color map that reflects the percent enhancement in early phases of DCE MRI might be beneficial. Color map in this study displayed a maximum signal intensity percent change during the first minute after contrast material injection. The red areas represented areas with high and early enhancement, and radiologists could more intuitively
evaluate the color map. The greatest advantage of color map was automatically generating the map from the MRI machine as a standard option.
This study evaluated the agreement between color map and DCE whole images by two readers with different experience levels. The experienced radiologist’s review of DCE whole images were considered as the gold-standard, and the color map review by R1 showed fair agreement to the gold-standard. DCE whole image and color map review by the trainee (R2) also showed fair agreement with the gold-standard. The trainee achieved higher agreement with the gold-standard using color map than when using DCE whole images. This result may be supported by the common knowledge that DCE MRI is difficult to interpret and previous studies have shown that there is low inter- observer agreement, even between expert radiologists (19, 20). In this study, it was suspected that less experienced radiologists tended to be more confused when reading DCE whole images and rely more on color maps that can be more intuitively interpreted. Decreased inter-method/
inter-observer agreement in dichotomized analysis can be explained by a paradox of lower kappa value in asymmetrically distributed data even with high agreement rate (21, 22). Therefore, color maps were postulated to be Fig. 3. Differences in confidence scores (a) with respect to evaluation time (b) with respect to Gleason score.
a b
beneficial to less experienced radiologists and help make proper decisions on early enhancement.
Additionally, this study’s results showed that significantly less time was spent interpreting color maps for both expert and trainee than the time taken for DCE whole images, as was expected. Color maps consist of a few dozen images and the number of DCE whole images is ten times that number. Evaluating DCE whole images from beginning to end takes much more time than a color map review. Also, matching the same section between T2WI and DCE whole images is difficult. In this study, an attempt was made to obtain DCE images at planes as similar as possible to T2WI and DWI. The color maps were also obtained similarly to T2WI and DWI. Thus, if a focal lesion could be noted on T2WI or DWI, the same area could easily be found on the color map.
The results of positive early enhancement were different based on Gleason score. Early enhancement is usually positive in prostate cancer when compared to normal prostatic tissue, and a recent study had shown that positive early enhancement might have a role in predicting higher tumor grade (23, 24). In this study, confidence scores for early enhancement, by both readers, increased with increase in Gleason score. The evaluation time tended to decrease as the Gleason score increased; however, statistical significance was only noted in the color map review by R1. The results demonstrated that early enhancement was more apparent in more aggressive cancers, and therefore, radiologists could be more confident about early enhancement in a shorter time with more aggressive cancers.
The following are the limitations of this study. First, it was a retrospective study with a relatively small sample size.
Also, radiologists determined the presence of enhancement in specifically selected areas in one patient. The study evaluated the utility of color maps that represented the percent enhancement in an early phase of prostate cancer, which had not been done previously. Therefore, the variability that results from selecting prostate focal lesions was eliminated. Second, the DCE whole image result from an experienced radiologist was considered the gold standard. There was no definite pathological factor in prostate cancer that could be a gold standard of early enhancement on DCE MRI. Also, the main objective of this study was to compare the agreement between two reading methods.
In conclusion, a trainee could achieve better agreement with an expert in review of wash-in color maps than in review of DCE whole images. In addition, color maps took
a significantly shorter evaluation time than DCE whole images. Therefore, color map may be useful for interpreting prostate mpMRI in daily practice for both experienced radiologists and trainees.
Acknowledgments
This work was supported by the genitourinary MRI study group of the Korean Society of Magnetic Resonance in Medicine (KSMRM).
REFERENCES
1. Futterer JJ, Briganti A, De Visschere P, et al. Can clinically significant prostate cancer be detected with multiparametric magnetic resonance imaging? A systematic review of the literature. Eur Urol 2015;68:1045- 1053
2. Weinreb JC, Barentsz JO, Choyke PL, et al. PI-RADS Prostate Imaging - Reporting and Data System: 2015, version 2. Eur Urol 2016;69:16-40
3. Woo S, Suh CH, Kim SY, Cho JY, Kim SH, Moon MH.
Head-to-head comparison between biparametric and multiparametric MRI for the diagnosis of prostate cancer: a systematic review and meta-analysis. AJR Am J Roentgenol 2018;211:W226-W241
4. Purysko AS, Rosenkrantz AB, Barentsz JO, Weinreb JC, Macura KJ. PI-RADS version 2: a pictorial update.
Radiographics 2016;36:1354-1372
5. Iwazawa J, Mitani T, Sassa S, Ohue S. Prostate cancer detection with MRI: is dynamic contrast-enhanced imaging necessary in addition to diffusion-weighted imaging?
Diagn Interv Radiol 2011;17:243-248
6. Tamada T, Sone T, Higashi H, et al. Prostate cancer detection in patients with total serum prostate-specific antigen levels of 4-10 ng/mL: diagnostic efficacy of diffusion-weighted imaging, dynamic contrast-enhanced MRI, and T2-weighted imaging. AJR Am J Roentgenol 2011;197:664-670
7. Greer MD, Shih JH, Lay N, et al. Validation of the dominant sequence paradigm and role of dynamic contrast-enhanced imaging in PI-RADS version 2. Radiology 2017;285:859- 869
8. Turco S, Lavini C, Heijmink S, Barentsz J, Wijkstra H, Mischi M. Evaluation of dispersion MRI for improved prostate cancer diagnosis in a multicenter study. AJR Am J Roentgenol 2018;211:W242-W251
9. Sanz-Requena R, Marti-Bonmati L, Perez-Martinez
R, Garcia-Marti G. Dynamic contrast-enhanced case- control analysis in 3T MRI of prostate cancer can help to characterize tumor aggressiveness. Eur J Radiol 2016;85:2119-2126
10. Vos EK, Litjens GJ, Kobus T, et al. Assessment of prostate cancer aggressiveness using dynamic contrast-enhanced magnetic resonance imaging at 3 T. Eur Urol 2013;64:448- 455
11. Ocak I, Bernardo M, Metzger G, et al. Dynamic contrast- enhanced MRI of prostate cancer at 3 T: a study of pharmacokinetic parameters. AJR Am J Roentgenol 2007;189:849
12. Kim JK, Hong SS, Choi YJ, et al. Wash-in rate on the basis of dynamic contrast-enhanced MRI: usefulness for prostate cancer detection and localization. J Magn Reson Imaging 2005;22:639-646
13. Oto A, Kayhan A, Jiang Y, et al. Prostate cancer:
differentiation of central gland cancer from benign prostatic hyperplasia by using diffusion-weighted and dynamic contrast-enhanced MR imaging. Radiology 2010;257:715-723
14. Padhani AR, Gapinski CJ, Macvicar DA, et al. Dynamic contrast enhanced MRI of prostate cancer: correlation with morphology and tumour stage, histological grade and PSA.
Clin Radiol 2000;55:99-109
15. Riches SF, Payne GS, Morgan VA, et al. MRI in the detection of prostate cancer: combined apparent diffusion coefficient, metabolite ratio, and vascular parameters. AJR Am J Roentgenol 2009;193:1583-1591
16. Rosenkrantz AB, Kim S, Campbell N, Gaing B, Deng FM, Taneja SS. Transition zone prostate cancer: revisiting the
role of multiparametric MRI at 3 T. AJR Am J Roentgenol 2015;204:W266-272
17. Schlemmer HP, Merkle J, Grobholz R, et al. Can pre- operative contrast-enhanced dynamic MR imaging for prostate cancer predict microvessel density in prostatectomy specimens? Eur Radiol 2004;14:309-317 18. Franiel T, Hamm B, Hricak H. Dynamic contrast-enhanced
magnetic resonance imaging and pharmacokinetic models in prostate cancer. Eur Radiol 2011;21:616-626
19. Rosenkrantz AB, Ginocchio LA, Cornfeld D, et al.
Interobserver reproducibility of the PI-RADS version 2 lexicon: a multicenter study of six experienced prostate radiologists. Radiology 2016;280:793-804
20. Hansford BG, Peng Y, Jiang Y, et al. Dynamic contrast- enhanced MR imaging curve-type analysis: is it helpful in the differentiation of prostate cancer from healthy peripheral zone? Radiology 2015;275:448-457
21. Feinstein AR, Cicchetti DV. High agreement but low kappa: I. The problems of two paradoxes. J Clin Epidemiol 1990;43:543-549
22. Cicchetti DV, Feinstein AR. High agreement but low kappa:
II. Resolving the paradoxes. J Clin Epidemiol 1990;43:551- 558
23. Oto A, Yang C, Kayhan A, et al. Diffusion-weighted and dynamic contrast-enhanced MRI of prostate cancer:
correlation of quantitative MR parameters with Gleason score and tumor angiogenesis. AJR Am J Roentgenol 2011;197:1382-1390
24. Preziosi P, Orlacchio A, Di Giambattista G, et al.
Enhancement patterns of prostate cancer in dynamic MRI.
Eur Radiol 2003;13:925-930
![Fig. 1. A 66-year-old male patient with prostate cancer (Gleason score 8 [4+4]). Focal low signal intensity is shown at the right peripheral zone (arrows) on T2WI (a) and T1WI (b)](https://thumb-ap.123doks.com/thumbv2/123dokinfo/5245660.132325/3.892.83.822.388.1026/patient-prostate-cancer-gleason-focal-intensity-peripheral-arrows.webp)