ISSN 2234-3806 • eISSN 2234-3814
Ann Lab Med 2012;32:171-176
http://dx.doi.org/10.3343/alm.2012.32.3.171
Single-color Multitarget Flow Cytometry Using Monoclonal Antibodies Labeled with Different Intensities of the
Same Fluorochrome
Joonhong Park, M.D. and Kyungja Han, M.D.
Department of Laboratory Medicine, School of Medicine, The Catholic University of Korea, Seoul, Korea Background: We developed a single-color multitarget flow cytometry (SM-FC) assay, a sin- gle-tube assay with graded mean fluorescence intensities (MFIs). We evaluated the repeat- ability of SM-FC, and its correlation with multicolor flow cytometry (MFC), to assess its ap- plication as a routine FC assay.
Methods: We selected CD19, CD3, CD4, and CD8 as antigen targets to analyze a lympho- cyte subset. MFIs were graded by adjusting monoclonal antibody (mAb) volumes to detect several cell populations. Dimly labeled mAb was prepared by decreasing mAb volume and the optimum diluted volume was determined by serial dilution. SM-FC repeatability was an- alyzed 10 times in 2 normal controls. The correlation between SM-FC and MFC was evalu- ated in 20 normal and 23 patient samples.
Results: CV values (0.8-5.0% and 1.3-4.1% in samples 1 and 2, respectively) acquired by SM-FC with CD3-fluorescein α-isothyocyanate (FITC)dim+CD4-FITCbright and with CD19- FITCdim+CD3-FITCbright showed good repeatability, comparable to that acquired by MFC (1.6-3.7% and 1.0-4.8% in samples 1 and 2, respectively). Excellent correlation was ob- served between the 2 methods in the 20 normal samples (B cells, T cells, non-Thelper cells, and Thelper cells; r2=0.87, 0.97, 0.97, and 0.98, respectively; P <0.05). There were also lin- ear relationships between SM-FC with CD19-FITCdim+CD3-FITCbright and CD8-PEdim+ CD4- PEbright, and MFC, in the 23 patient samples (B cells, T cells, Tcytotoxic cells, and Thelper cells;
r2≥0.98, 0.99, 0.99, and 0.99, respectively; P <0.05).
Conclusions: The multicolor, single-tube SM-FC technique is a potential alternative tool for identifying a lymphocyte subset.
Key Words: Monoclonal antibody cocktail, Lymphocyte subset, Single-color multitarget flow cytometry
Received: July 12, 2011
Revision received: January 2, 2012 Accepted: February 1, 2012 Corresponding author: Kyungja Han Department of Laboratory Medicine, School of Medicine, The Catholic University of Korea, Seoul St. Mary’s Hospital, 505 Banpo-dong, Seocho-gu, Seoul 137-701, Korea
Tel: +82-2-2258-1644 Fax: +82-2-2258-1719 E-mail: hankja@catholic.ac.kr
© The Korean Society for Laboratory Medicine.
This is an Open Access article distributed under the terms of the Creative Commons Attribution Non-Commercial License (http://creativecom- mons.org/licenses/by-nc/3.0) which permits unrestricted non-commercial use, distribution, and reproduction in any medium, provided the original work is properly cited.
INTRODUCTION
Multicolor flow cytometry (MFC) is widely used in health research and treatment for a variety of tasks, such as providing the counts of helper-T lymphocytes needed to monitor the course and treat- ment of human immunodeficiency virus (HIV) infection [1-3], diagnosing and monitoring leukemia and lymphoma patients [4, 5], and evaluating peripheral blood hematopoietic stem cell
grafts [6] and a variety of other diseases [7]. The technology is also used to cross-match organs for transplantation [8], and in research involving stem cells, apoptosis [9], phagocytosis [10], and a wide range of cellular properties including phenotype [11], cytokine expression [12], and cell-cycle status [13].
MFC can enumerate mature T, B, and natural killer (NK) cell populations, as well as CD4+ and CD8+ T-cell subsets, using 6 monoclonal antibodies (mAbs), including CD3, CD4, CD8, CD19,
ISSN 2234-3806 • eISSN 2234-3814
CD16, and CD56, in lymphocyte subset analyses [14-17]. Although some clinical laboratories routinely use a single-tube assay with lyse-no-wash methodology, which reduces inter-laboratory vari- ability, a single-tube assay requires complex analysis with a mul- tiple gating strategy [17-20]. The use of complex instruments with multicolor analysis, in which every fluorochrome has to be accurately compensated for, especially in a lyse-no-wash tech- nique, can be problematic for an inexperienced operator [18].
With the goal of alleviating these difficulties, we have devel- oped single-color multitarget flow cytometry (SM-FC), which cir- cumvents the costly and labor-intensive procedures of manual preparation. The process is almost the same as MFC, except for the use of mAbs labeled with different mean fluorescence inten- sities (MFIs) of the same fluorochrome for detecting more than two cell populations, as a single-tube assay. We attempted to an- alyze a lymphocyte subset using this technique with graded MFIs by adjusting mAb volumes to detect several cell populations.
The aim of this study was to estimate the repeatability of SM- FC, evaluate the correlation between SM-FC and MFC, and as- sess the potential of the new technique as a routine flow cytom- etry (FC) approach. We selected CD19, CD3, CD4, and CD8 as antigen targets to demonstrate whether SM-FC is routinely ap- plicable, because these antigens are expressed in a certain lym- phocyte subset. Subset results obtained using SM-FC and MFC were compared in 23 patient samples.
METHODS 1. Subjects
To evaluate the repeatability of SM-FC and the correlation be- tween SM-FC and MFC, we used 20 blood samples, obtained from adults who had visited our hospital for routine medical health check-ups. All individuals had displayed normal blood test results. Another 23 blood samples that had been obtained from patients for lymphocyte analysis were used to assess the potential of the novel technique as a routine FC approach. These patients had been variously diagnosed with aplastic anemia (N=
4), myelodysplatic syndrome (N=3), AML (N=6), ALL (N=3), HIV infection (N=6), and infectious mononucleosis (N=1), but not initially with lymphoid malignancies such as ALL, CLL, and lymphoma. Sixteen patients with hematologic malignancies had a successful post-hematopoietic stem cell transplantation status for at least 6 months. Total white blood cell (WBC) count ranged from 1.33 to 14.54×10⁹/L (median, 5.40×10⁹/L). Lymphocyte count ranged from 0.49 to 6.12×10⁹/L (median, 2.03×10⁹/L). All blood samples were collected in vacutainer tubes coated with
K2-EDTA (Becton-Dickinson, Franklin Lakes, NJ, USA) and were processed within 4 hr of blood collection.
2. Antibodies and flow cytometry for SM-FC
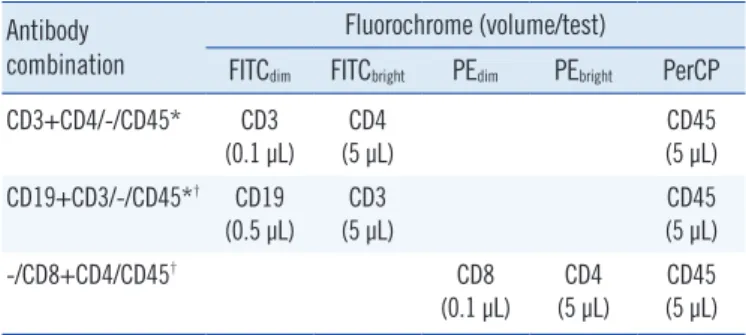
Six mAbs were used to evaluate the repeatability of SM-FC and the correlation between SM-FC and MFC. The mAbs were fluo- rescein α-isothyocyanate (FITC)-conjugated CD4, CD3, and CD19; phycoerythrin (PE)-conjugated CD8 and CD4; and peri- dinin chlorophyll protein complex (PerCP)-conjugated CD45 (BD Biosciences, San Jose, CA, USA). MFIs were graded by adjust- ing mAb volumes for detecting several cell populations (i.e., multitarget). Dimly labeled mAbs were prepared by decreasing mAb volume and the optimal diluted volume was determined using serial mAb dilutions. As a result, CD3 and CD19 FITC (0.1 and 0.5 µL/test, respectively) and CD8 PE (0.1 μL/test) yielded weakly positive cell populations in SM-FC. The mAb cocktails used in lymphocyte subset analysis are listed in Table 1. To compare with MFC, Multitest 6-color TBNK reagent (BD Biosci- ences), which contains 6 Abs, was used to identify and enumer- ate T, B, and NK lymphocyte subsets. A single-tube assay with the lyse-wash method was performed on 50 μL volumes of whole peripheral blood. A 6-color FACSCanto II flow cytometer (BD Biosciences) was used in accordance with the manufac- turer’s recommendation. Data were collected by adjusting the Fourier shell correlation (FSC) threshold to exclude platelets and debris. List mode data of 10,000 cells was collected according to predefined FSC threshold settings. Data analyses were con- ducted using the FACSDiva program (BD Biosciences).
3. Validation of SM-FC
The repeatability of SM-FC was analyzed 10 times in 2 normal controls. The correlation between SM-FC and MFC was evalu-
Table 1. Monoclonal antibody cocktails used for lymphocyte subset analysis
Antibody combination
Fluorochrome (volume/test)
FITCdim FITCbright PEdim PEbright PerCP CD3+CD4/-/CD45* CD3
(0.1 μL) CD4
(5 μL) CD45
(5 μL) CD19+CD3/-/CD45*† CD19
(0.5 μL) CD3 (5 μL)
CD45 (5 μL)
-/CD8+CD4/CD45† CD8
(0.1 μL) CD4
(5 μL) CD45 (5 μL)
*used for a repeatability of SM-FC and a correlation between SM-FC and MFC; †used to assess the potential use of SM-FC as a routine FC.
Abbreviations: FITC, fluorescein α-isothyocyanate; PE, phycoerythrin; Per- CP, peridinin chlorophyll protein complex.
ated in 20 normal samples. SM-FC with CD3-FITCdim+CD4- FITCbright was performed to detect dimly fluorescent non-Thelper
cells and brightly fluorescent Thelper cells (Th cells). SM-FC with CD19-FITCdim+CD3-FITCbright was also achieved to detect weakly fluorescent B cells and strongly fluorescent T cells, respectively.
To assess the potential of this method as a routine FC approach, SM-FC with CD19-FITCdim+CD3-FITCbright and CD8-PEdim+CD4- PEbright was performed to separate dimly fluorescent B cells, dimly fluorescent Tcytotoxic cells (Tc cells), and brightly fluorescent Th cells in 23 patient samples.
4. Statistical analysis
The correlation between cell populations obtained by SM-FC and MFC was assessed using the Pearson correlation coefficient and linear regression analysis. All statistical differences were consid- ered significant if P <0.05. All statistical analyses were performed using MedCalc 12.0 software (MedCalc, Mariakerke, Belgium).
RESULTS
1. Repeatability of SM-FC with CD3-FITC
dim+CD4-FITC
brightand with CD19-FITC
dim+CD3-FITC
brightNegative, dimly fluorescent, and brightly fluorescent cell popu-
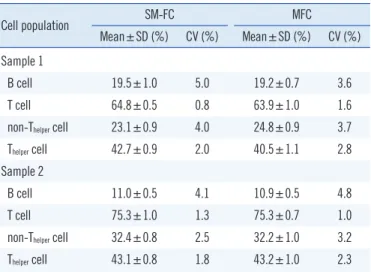
lations were clearly distinguished by SM-FC. SM-FC with CD3- FITCdim+CD4-FITCbright showed negative cells, dimly fluorescent non-Th cells, and brightly fluorescent Th cells. SM-FC with CD19- FITCdim+CD3-FITCbright presented negative cells, weakly fluores- cent B cells, and strongly fluorescent T cells. The contours of the 3 peaks were sufficiently distinguishable and these markers could be readily set in each histogram (Fig. 1). Ten analyses in 2 normal controls revealed good repeatability based on the CV values (0.8-5.0% in sample 1; 1.3-4.1% in sample 2) acquired by SM-FC, comparable to those acquired by MFC (1.6-3.7% in sample 1; 1.0-4.8% in sample 2). The CVs of Th cells and non-Th
cells obtained by SM-FC and MFC were lower than those of B cells (Table 2).
2. Correlation between SM-FC with CD3-FITC
dim+CD4- FITC
brightand with CD19-FITC
dim+CD3-FITC
bright, and MFC
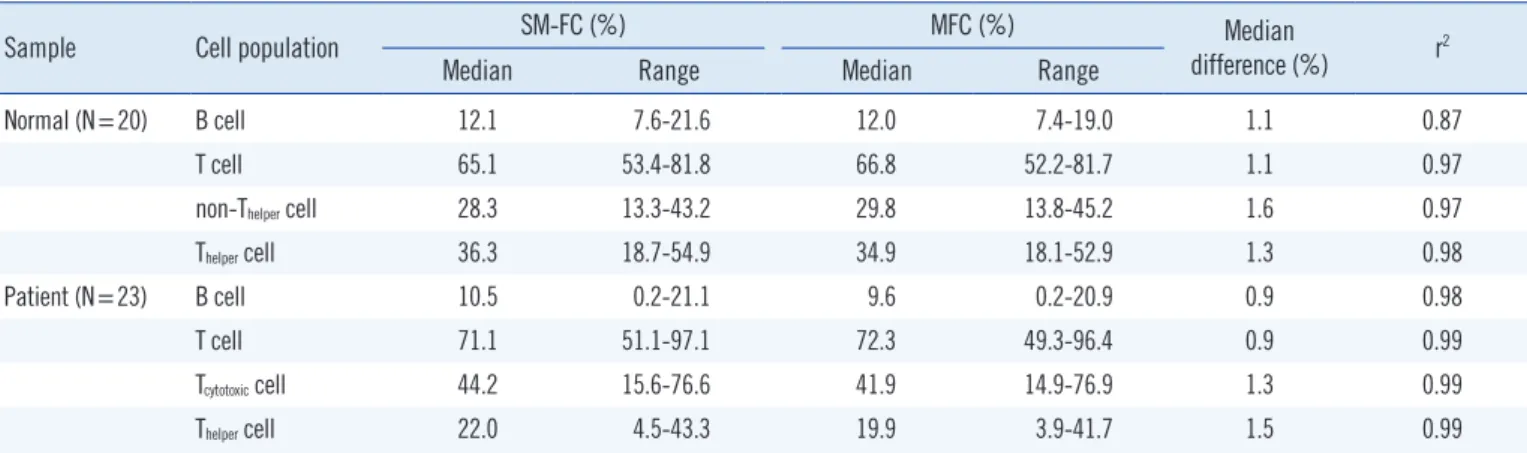
There was excellent correlation between SM-FC and MFC (P <0.05) in the 20 normal samples tested. Median differences be- tween the 2 methods were <2%. SM-FC showed similar results to those of MFC, and agreed well with those obtained by MFC (Table 3).
3. Potential use of SM-FC with CD19-FITC
dim+CD3-FITC
brightand CD8-PE
dim+CD4-PE
brightas a routine FC approach
SM-FC adequately separated the lymphocyte population into 4 subpopulations (negative, dimly fluorescent B cells, dimly fluo- rescent Tc cells, and brightly fluorescent Th cells (Fig. 2). A linear relationship was evident between SM-FC and MFC in the 23 pa-CD19+CD3 FITC-A
105 104 103
102 0 -121
T cell B cell
0 101 102 103 104 105 CD45 PerCP-A SM-FC-Normal 2
CD3+CD4 FITC-A
105 104 103
102 0
-132
Thelper cell
0 101 102 103 104 105 CD45 PerCP-A SM-FC-Normal 2
Not-Thelper cell
Count
125 100 75 50 25 0
50 40 30 20 10 0 102 103 104 105 0
CD19+CD3 FITC-A SM-FC-Normal 2
-121
Count
0 102 103 104 105 CD3+CD4 FITC-A SM-FC-Normal 2
-132
A B
Fig. 1. Representative dot plots and histograms of single-color mul- titarget flow cytometry with CD19-FITCdim+CD3-FITCbright and with CD3-FITCdim+CD4-FITCbright. (A) B cells (CD19-FITCdim, brown) and T cells (CD3-FITCbright, green). (B) Non-Thelper cells (CD3-FITCdim, pink) and Thelper cells (CD3-FITCdim+CD4-FTTCbright, blue).
Abbreviations: SM-FC, single-color multitarget flow cytometry; PerCP, peri- dinin chlorophyll protein complex; FITC, fluorescein α-isothyocyanate.
Table 2. Repeatability of single-color multitarget flow cytometry com- pared to multicolor flow cytometry in 2 normal controls in 10 rounds of analysis
Cell population SM-FC MFC
Mean±SD (%) CV (%) Mean±SD (%) CV (%) Sample 1
B cell 19.5±1.0 5.0 19.2±0.7 3.6
T cell 64.8±0.5 0.8 63.9±1.0 1.6
non-Thelper cell 23.1±0.9 4.0 24.8±0.9 3.7
Thelper cell 42.7±0.9 2.0 40.5±1.1 2.8
Sample 2
B cell 11.0±0.5 4.1 10.9±0.5 4.8
T cell 75.3±1.0 1.3 75.3±0.7 1.0
non-Thelper cell 32.4±0.8 2.5 32.2±1.0 3.2
Thelper cell 43.1±0.8 1.8 43.2±1.0 2.3
Abbreviations: SM-FC, single-color multitarget flow cytometry; MFC, multi- color flow cytometry.
tient samples tested (P <0.05); the median difference between the 2 methods was <2% (Table 3).
DISCUSSION
The recent availability of MFC has allowed the absolute enumer- ation of the lymphocyte subpopulation in a single tube, including B lymphocytes or NK cells, at reduced cost and with shorter as- say times [18-20]. Determination of lymphocyte subpopulations is very important in many kinds of immunological [20] and he- matological disorders [21]. WBC differentiation based on FC rec- ognition of cells has become a routine test [22-25]. However, since one fluorochrome is responsible for detecting only one ex- pressed antigen, the resulting dot plot will only depict negative or positive cell populations in MFC. Because the number of avail-
able fluorochromes may be limited in a single tube, the resolu- tion of MFC may be insufficient for the analysis of a large num- ber of different cell populations in a single-tube assay format. To overcome the limited number of mAbs that can be used in a multicolor, single-tube technique, a sequential gating method has been attempted [17-20]. Although this approach permits enumeration of the lymphocyte subpopulation, the gating strat- egy is complex [17-20]. The separation of more than 2 cell popu- lations using a single fluorochrome in the multicolor single-tube technique format exponentially increases the number of possible differential cell populations that can be enumerated.
The present results demonstrate the favorable repeatability of SM-FC and its correlation with MFC. Lymphocyte subsets includ- ing B cells, Th cells, and Tc cells were successfully verified using SM-FC with CD19-FITCdim+CD3-FITCbright and CD8-PEdim+CD4- PEbright in one dot plot, indicating the potential of SM-FC as a routine FC approach. Lymphocyte subpopulations were exclu- sively determined by antigenic expression; every included lym- phocyte was positive for one or more markers and negative for others.
The most important contribution of SM-FC is that more anti- gen expression profiles can be obtained using multiple mAbs conjugated with the same fluorochromes at different intensities in a multicolor single-tube assay format. This approach is less sensitive to systematic error or bias because it allows for a larger lymphocyte window. This single-tube method approach pro- duces the most complete determination of possible phenotypes, improving clinical interpretation and diagnosis. SM-FC also elim- inates the need to control tube-to-tube population variability (quality control) with duplicate reagents, and excludes tube-to- tube window anomalies. Other practical advantages include de- creased use of reagents and test tubes, which reduce labor-re- Table 3. Correlation of single-color multitarget flow cytometry compared to multicolor flow cytometry in 20 normal and 23 patient samples
Sample Cell population SM-FC (%) MFC (%) Median
difference (%) r2
Median Range Median Range
Normal (N=20) B cell 12.1 7.6-21.6 12.0 7.4-19.0 1.1 0.87
T cell 65.1 53.4-81.8 66.8 52.2-81.7 1.1 0.97
non-Thelper cell 28.3 13.3-43.2 29.8 13.8-45.2 1.6 0.97
Thelper cell 36.3 18.7-54.9 34.9 18.1-52.9 1.3 0.98
Patient (N=23) B cell 10.5 0.2-21.1 9.6 0.2-20.9 0.9 0.98
T cell 71.1 51.1-97.1 72.3 49.3-96.4 0.9 0.99
Tcytotoxic cell 44.2 15.6-76.6 41.9 14.9-76.9 1.3 0.99
Thelper cell 22.0 4.5-43.3 19.9 3.9-41.7 1.5 0.99
Abbreviations: SM-FC, single-color multitarget flow cytometry; MFC, multicolor flow cytometry; r2, the square of the Pearson correlation coefficient.
SSC-A CD8+CD4 PE-A-159
-113
(×1,000) 250
200 150 100 50
105 104 103 102
102 103 104 105 0 102 103 104 105
CD45 PerCP-A CD19+CD3 FITC-A
SM-FC-SAA s/p uPBSCT (Pt5) SM-FC-SAA s/p uPBSCT (Pt5)
Fig. 2. Representative dot plots of single-color multitarget flow cy- tometry with CD19-FITCdim+CD3-FITCbright and CD8-PEdim+CD4- PEbright. B cells (CD19-FITCdim, brown), Tcytotoxic cells (CD3-FITCbright+ CD8-PEdim, pink), and Thelper cells (CD3-FITCbright+CD4-PEbright, blue) in a right dot plot.
Abbreviations: SM-FC-SAA s/p uPBSCT, single-color multitarget flow cytom- etry-severe aplastic anemia after unrelated peripheral blood stem cell trans- plantation; SSC-A, side scatter; PerCP, peridinin chlorophyll protein com- plex; PE, phycoerythrin; FITC, fluorescein α-isothyocyanate.
lated costs. However, the routine use of diluted preparations of mAbs should be avoided, since subsaturation of a cell surface antigen could cause underexpression.
This novel technique has several limitations. First, most malig- nant cells such as leukemic blasts or lymphoma cells could pres- ent variable MFIs or aberrant expression due to their biological abnormalities [26]. The expression level of a particular target anti- gen may vary depending on the loss or gain of typical or aberrant antigen expression in hematological malignancies. This new method may be more useful to analyze cells that constantly ex- press target surface antigens, for example, the lymphocyte sub- set in non-lymphoid malignancies, rather than to immunopheno- type hematological malignancies. Secondly, some surface anti- gens, such as CD45, express different MFIs according to the type of normal leukocytes present [27]. Therefore, it may not be suit- able to use mAbs that express various MFIs according to cell type in SM-FC. Finally, we have to carefully select the combination of dimly and brightly labeled mAbs in SM-FC, since it is not possible to distinguish a cell population stained with only brightly labeled mAbs from a population stained with dimly as well as brightly la- beled mAbs using the same fluorochrome. It is better to combine mAbs like CD3 and CD19, which are not expressed in the same cell population, using the same fluorochrome with different inten- sities. Antigen coexpression may lead to overlap between dimly and brightly labeled mAbs, and cell populations would not be clearly distinguishable, leading to inaccurate results.
In conclusion, SM-FC not only displays acceptable repeatabil- ity and correlation in normal samples, but also has potential as a routine FC technique. Because there are some difficulties to apply to all clinical areas, this method should be applied to ana- lyze cell populations that present constant levels of antigens in non-hematological malignancies or other diseases that do not influence the level of antigen expression. In spite of several cur- rent limitations, SM-FC could be a potential alternative tool, as a multicolor, single-tube technique, for the routine clinical labora- tory detection of a lymphocyte subset.
Authors’ Disclosures of Potential Conflicts of Interest
No potential conflict of interest relevant to this article was re- ported.
REFERENCES
1. Hengel RL and Nicholson JK. An update on the use of flow cytometry in
HIV infection and AIDS. Clin Lab Med 2001;21:841-56.
2. Illoh OC. Current applications of flow cytometry in the diagnosis of pri- mary immunodeficiency diseases. Arch Pathol Lab Med 2004;128:23- 31.
3. Mandy FF. Twenty-five years of clinical flow cytometry: AIDS accelerated global instrument distribution. Cytometry A 2004;58:55-6.
4. Braylan RC. Impact of flow cytometry on the diagnosis and character- ization of lymphomas, chronic lymphoproliferative disorders and plasma cell neoplasias. Cytometry A 2004;58:57-61.
5. Orfao A, Ortuño F, de Santiago M, Lopez A, San Miguel J. Immunophe- notyping of acute leukemias and myelodysplastic syndromes. Cytometry A 2004;58:62-71.
6. Keeney M, Gratama JW, Sutherland DR. Critical role of flow cytometry in evaluating peripheral blood hematopoietic stem cell grafts. Cytometry A 2004;58:72-5.
7. Bagwell CB. DNA histogram analysis for node-negative breast cancer.
Cytometry A 2004;58:76-8.
8. Maecker HT and Maino VC, eds. Manual of Clinical Laboratory Immu- nology. 6th ed. Washington, DC: ASM Press, 2002:338-46.
9. Vermes I, Haanen C, Reutelingsperger C. Flow cytometry of apoptotic cell death. J Immunol Methods 2000;243:167-90.
10. Lehmann AK, Sornes S, Halstensen A. Phagocytosis: measurement by flow cytometry. J Immunol Methods 2000;243:229-42.
11. Krutzik PO, Irish JM, Nolan GP, Perez OD. Analysis of protein phosphor- ylation and cellular signaling events by flow cytometry: techniques and clinical applications. Clin Immunol 2004;110:206-21.
12. Pala P, Hussell T, Openshaw PJ. Flow cytometric measurement of intra- cellular cytokines. J Immunol Methods 2000;243:107-24.
13. Pozarowski P and Darzynkiewicz Z. Analysis of cell cycle by flow cytom- etry. Methods Mol Biol 2004;281:301-11.
14. Gratama JW, Kraan J, Keeney M, Granger V, Barnett D. Reduction of variation in T-cell subset enumeration among 55 laboratories using sin- gle-platform, three or four-color flow cytometry based on CD45 and SSC-based gating of lymphocytes. Cytometry 2002;50:92-101.
15. Alamo AL and Melnick SJ. Clinical application of four and five-color flow cytometry lymphocyte subset immunophenotyping. Cytometry 2000;42: 363-70.
16. Chng WJ, Tan GB, Kuperan P. Establishment of adult peripheral blood lymphocyte subset reference range for an Asian population by single- platform flow cytometry: influence of age, sex, and race and compari- son with other published studies. Clin Diagn Lab Immunol 2004;11:168- 73.
17. Autissier P, Soulas C, Burdo TH, Williams KC. Evaluation of a 12-color flow cytometry panel to study lymphocyte, monocyte, and dendritic cell subsets in humans. Cytometry A 2010;77:410-9.
18. Colombo F, Cattaneo A, Lopa R, Portararo P, Rebulla P, Porretti L. Evalu- ation of a multicolor, single-tube technique to enumerate lymphocyte subpopulations. Clin Vaccine Immunol 2008;15:1124-7.
19. Lambert C, Cristina I, Christian G. Enumeration of peripheral lympho- cyte subsets using 6 vs. 4 color staining: a clinical evaluation of a new flowcytometer. Cytometry B Clin Cytom 2006;70:29-38.
20. Ashman M, Sachdeva N, Davila L, Scott G, Mitchell C, Cintron L, et al.
Influence of 4- and 6-color flow cytometers and acquisition/analysis softwares on the determination of lymphocyte subsets in HIV infection.
Cytometry B Clin Cytom 2007;72:380-6.
21. Szczepa ski T, van der Velden VH, van Dongen JJ. Flow-cytometric im- munophenotyping of normal and malignant lymphocytes. Clin Chem Lab Med 2006;44:775-96.
22. Roussel M, Benard C, Ly-Sunnaram B, Fest T. Refining the white blood cell differential: the first flow cytometry routine application. Cytometry A 2010;77:552-63.
23. Cherian S, Levin G, Lo WY, Mauck M, Kuhn D, Lee C, et al. Evaluation of an 8-color flow cytometric reference method for white blood cell dif- ferential enumeration. Cytometry B Clin Cytom 2010;78:319-28. 24. Björnsson S, Wahlström S, Norström E, Bernevi I, O’Neill U, Johansson
E, et al. Total nucleated cell differential for blood and bone marrow us- ing a single tube in a five-color flow cytometer. Cytometry B Clin Cytom 2008;74:91-103.
25. Faucher JL, Lacronique-Gazaille C, Frébet E, Trimoreau F, Donnard M,
Bordessoule D, et al. “6 markers/5 colors” extended white blood cell differential by flow cytometry. Cytometry A 2007;71:934-44.
26. Swerdlow, SH, Campo, E, et al. eds. WHO classification tumours of hae- matopoietic and lymphoid tissues. 4th ed. Lyon: IARC press, 2008:109- 320.
27. Nicholson JK, Hubbard M, Jones BM. Use of CD45 fluorescence and side-scatter characteristics for gating lymphocytes when using the whole blood lysis procedure and flow cytometry. Cytometry 1996;26:16-21.