1972
( )
, 1992 ,
21 . 1995
(FAO) , 2002
. 1 J. Kor. Soc. Fish. Tech., 45(4), 276 286, 2009
DOI:10.3796/KSFT.2009.45.4.276
Economic analysis of biodegradable snow crab gill net model project
Seong Kwae PARK*, Seong-Wook PARK1and Hyeok-Jun KWON
Faculty of Marine Business & Economics, Pukyong National University, Busan 608-737, Korea
1Fisheries Engineering Division, National Fisheries Research and Development Institute, Busan 619-902, Korea
The main purpose of this research is to analyze economic feasibility of biodegradable sonw crab gill net model project. The results of benefit/cost analysis show that use of the biodegradable gear is economically feasible. Assuming that the rate of gill net lost is 5 percent, net present value was estimated 311,898,282 590,533,375won, benefit-cost ratio 1.816 1.923 and internal rate of return 7.96 10.59%. The development and diffusion of biodegradable fishing gear appear to make a significant contribution to fisheries resource conservation and marine ecosystem protection. In addition, biodegradable gear production firms may have a good opportunity of exporting it to other coastal states, depending on the progress of WTO subsidy negotiation.
Keywords: Benfit-cost analysis, Biodegradable, Gill net, Conservation, Ecosystem
*Corresponding author: [email protected], Tel: 82-51-629-5958, Fax: 82-51-629-5953
. ,
, 1 R&D
. ,
. ,
, LED ,
. ,
(Ayaz et al., 2006; Revill and Dunlin, 2003; Park et al., 2006, 2007a,b).
. ,
.
.
,
.
.
.
,
. ,
.
. 2002
2006 , 2007
.
, WTO OECD, FAO
,
.
,
. R&D
.
,
.
,
.
(KDI, 2004).
1950 The Green Book
,
. KDI(1999)
. Bae(2000)
, Kim(2006)
. Han et
al.(2009) (BTL)
.
, ,
.
. ,
.
, .
,
.
.
.
, .
(KDI, 2004).
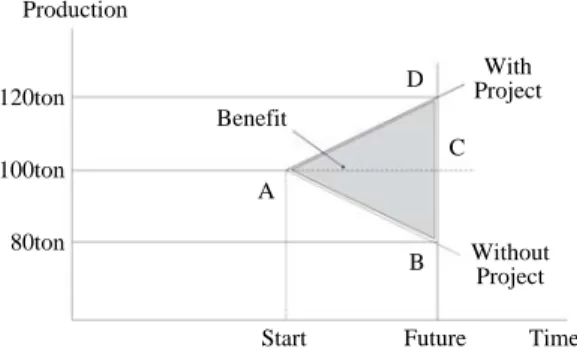
, Fig. 1
. AB
. AD
.
20 .
(without) (with)
20
ABD .
.
,
.
.
, .
Fig. 1. Conceptual benefit with or without project.
Production
Benefit
Start Future Time
With Project
A
D
C
B Without Project 120ton
100ton
80ton
,
, ,
.
.
7%,
(OMB, 1992). 20
3.5%, 30 75
3% (HM Treasury, 2003). EU
5%
, ,
EU 2.5 3% .
4%
(BTE, 1999).
.
. ,
, ,
, ,
.
. ,
, ,
(expected inflation rate) .
, .
.
,
.
.
10
2000 2007 5.6%
. ,
30
30 .
(Net Present Value: NPV),
(Benefit Cost Ratio: BCR), (Internal Rate of Return: IRR)
. NPV
.
B , C , r
, n .
(PB) (PC) (NPV 0)
.
(B C)0 (B C)1 (B C)n
NPV _______ _______ _______
(1 r)0 (1 r)1 (1 r)n (B C)n
Σn
i 0
________ n 1,2, ,n (1)
(1 r)n
. NPV
. BCR
(BCR) .
BCR 1 . Bn
Σn i 0
________
(1 r)n BCR ____________
n 0,1,2, , n (2) Cn
Σn i 0
________
(1 r)n BCR
, ,
. IRR
NPV 0
. IRR (IRR r ),
. IRR
.
. (B C)n
NPV
Σn i 1
_________
(B C)0 n 1,2, , n (3) (1 IRR)n
IRR
. ,
.
, NPV, BCR, IRR
.
2000 2005
.
.
.
, ,
. 1
, 21
,
.
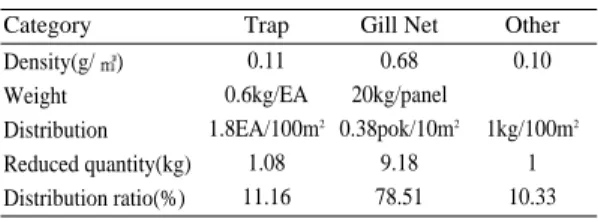
. Table 1
.
, 100 1.8 ,
0.38 (NFRDI, 2007).
0.6kg, 20kg
, 9.18kg
78.5% .
Table 2 .
Table 1. Bottom-stay net scrap distribution density estimation
Category
1 panel number of horizontal mesh number of vertical mesh (mesh size)
2,530 17 (240mm)
Trap Gill Net Other Density(g/ )
Weight Distribution Reduced quantity(kg) Distribution ratio(%)
0.11 0.6kg/EA 1.8EA/100m2
1.08 11.16
0.68 20kg/panel 0.38pok/10m2
9.18 78.51
0.10
1kg/100m2 1 10.33
Table3 , 1kg
2,638.3 . 1
, 2,638.3 20kg 52,766
.
.
2
.
( , ) ,
1 7
(Erzini 1997; Santos et al., 2003).
,
2 ,
,
,
.
,
2002 2006 ,
(860,732,000 ) .
.
.
.
60
(PBS) (PE)
, PBS PE 124
Table 4 .
PBS 30,628 , PE 17,484
.
Table 3. Estimation of snow crab gill nets used in Uljin of Korea
Year 2000 2001 2002 2003 2004 2005
Trap Gill Net Other
Collection(ton) Cost(won) Collection(ton) Cost(won) Collection(ton) Cost(won) 2.3
11.9 8.3 59.8 35.7 26.3
7,907,418 32,750,694 23,552,064 82,781,197 128,582,618 105,423,855
16.5 84.0 58.1 420.8 251.2 185.3
55,628,260 230,399,371 165,687,504 582,361,272 904,571,807 741,651,153
2.2 11.1 7.6 55.4 33.1 24.4
7,319,322 30,314,935 21,800,432 76,624,531 119,019,574 97,583,192 Table 2. Estimation of collection and cost
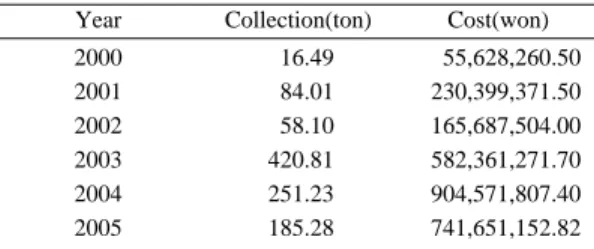
Table 4. Estimation of snow crab gill nets used in Uljin of Korea
Year Collection(ton) Cost(won) 2000
2001 2002 2003 2004 2005
16.49 84.01 58.10 420.81 251.23 185.28
55,628,260.50 230,399,371.50 165,687,504.00 582,361,271.70 904,571,807.40 741,651,152.82
Survey Quantity per ship
Total quantity PBS(Pannel)
PE(Pannel)
14,820 8,460
247 141
30,628 17,484
2006 , 5%
10% .
(i) 5%
100% . (ii)
kg
. (iii) 21
3
. ( )
CPUE Park. et al(2007) ,
. . 1 7
.
,
. ,
3 2007
Table 6. Benefit-cost(lost rate: 10%, discount rate: 5.6%)
Benefit(won) Net benefit (won)
161,611,705 178,176,905 196,440,037 216,575,141 238,774,093 253,867,779
253,867,779 253,867,779 253,867,779
-860,732,000 161,611,705 178,176,905 196,440,037 216,575,141 238,774,093 253,867,779
253,867,779 253,867,779 253,867,779 3,134,916,035 1,996,153,871 Year
2007 2009 2011 2013 2015 2017 2019
2034 2035 2036 PV
Cost 860,732,000
0 0 0 0 0 0
0 0 0 815,087,121
Estimated PBS (Panel)
Esimated PE (Panel)
Lost PBS (Panel)
Lost PE (Panel) 30,628
33,767 37,229 41,044 45,252 48,112 48,112
48,112 48,112 48,112
17,484 14,345 10,883 7,068 2,860 0 0
0 0 0
3,063 3,377 3,723 4,104 4,525 4,811 4,811
4,811 4,811 4,811
1,748 1,434 1,088 707 286 0 0
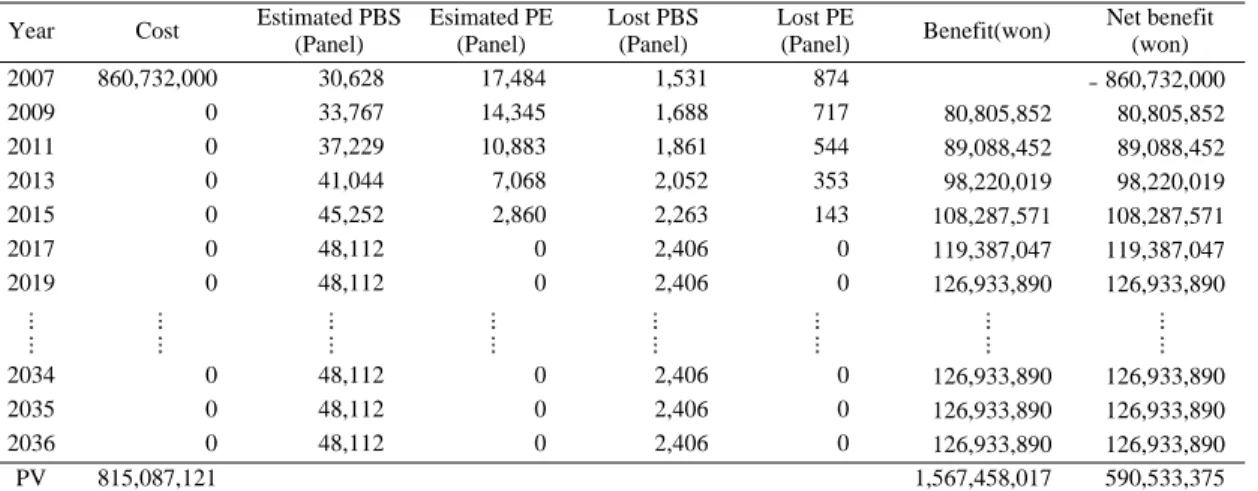
0 0 0 Table 5. Benefit-cost(lost rate: 5%, discount rate: 5.6%)
Benefit(won) Net benefit (won)
80,805,852 89,088,452 98,220,019 108,287,571 119,387,047 126,933,890
126,933,890 126,933,890 126,933,890
860,732,000 80,805,852 89,088,452 98,220,019 108,287,571 119,387,047 126,933,890
126,933,890 126,933,890 126,933,890 1,567,458,017 590,533,375 Year
2007 2009 2011 2013 2015 2017 2019
2034 2035 2036 PV
Cost 860,732,000
0 0 0 0 0 0
0 0 0 815,087,121
Estimated PBS (Panel)
Esimated PE (Panel)
Lost PBS (Panel)
Lost PE (Panel) 30,628
33,767 37,229 41,044 45,252 48,112 48,112
48,112 48,112 48,112
17,484 14,345 10,883 7,068 2,860 0 0
0 0 0
1,531 1,688 1,861 2,052 2,263 2,406 2,406
2,406 2,406 2,406
874 717 544 353 143 0 0
0 0 0
, 3 4 2010
.
.
5% 2017
. 5% 10%
Table 5 Table 6 .
(1), (2), (3)
5% 10%
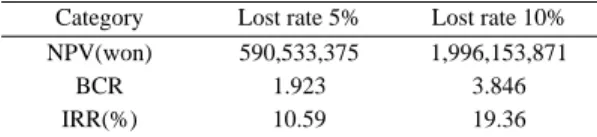
Table 7 . 5% 10%
NPV 590,533,375 1,996,153,871 , BCR 1.923 3.846, IRR
10.59% 19.36% ,
.
.
,
. ,
.
. 5% 10%
3 , 4 , 5
, Table 8 .
5% 5 , BCR
1.816, IRR 8.70% , 10%
2 BCR 3.846, IRR
19.36% . 6
, NPV, BCR, IRR ,
. ,
.
.
.
,
. (TAC),
, Table 7. Result of Economic Analysis.
Category Lost rate 5% Lost rate 10%
NPV(won) BCR IRR(%)
590,533,375 1.923 10.59
1,996,153,871 3.846 19.36
Table 8. Sensitivity analysis by degrading period and lost rate.
Degrading period
2 years 3 years 4 years 5 years
590,533,375 1.923 10.59 1,996,153,871 3.846 19.36
492,550,815 1.898 9.56 1,800,188,751 3.778 17.01
339,765,300 1.953 8.70 1,614,615,721 3.707 15.24
311,898,282 1.816 7.96 1,438,883,685 3.631 13.83 Lost rate Category
5%
10%
NPV(won) BCR IRR(%) NPV(won)
BCR IRR(%)
(Jang, 2008).
.
.
.
.
. ,
.
.
21
.
, ,
.
. ,
, ,
.
.
.
. 1
.
,
.
, (WTO) ,
(SCM) (subsidies negotiations)
. 2006
, 2007
, . 8 6
(i) ( :
) , (ii)
.
( ,
(BCR)) (IRR)
1.816 3.846 7.96 19.36% .
NPV 5% 5
NPV 3 1 .
124
. NPV
BCR IRR ,
BCR 1.816
8 6 1.8
, IRR 7.96%
.
10% BCR IRR 3.631
3.846 13.83% 19.36%
3.6 3.8 ,
13%
.
.
,
,
. ,
. (FAO,
1995, 2000)
,
.
WTO/SCM
.
.
2008 1
.
,
.
( , RP 2009 FE 013)
.
Ayaz, A.D. Acarli, U. Altinagac, U. Ozekinci, A. Kara and A. Ozen, 2006, Ghost fishing by monofilament and multifilament gill nets in izmir bay, Turkey.
Fisheries Research, 79, 267 271.
Bae, Y.J., 2000, On the feasibility analysis of public projects using benefit-cost analysis. The Journal of Industrial Sciences, 8, 21 31.
BTE, 1999, Facts and furphies in benefit-cost analysis:
Transport. BTE Report, 57 78.
Erzini, K., 1997. An experimantal study of gill net and trammel net ghost fhishing off the Algarve (shoutern Portugal). Marine Ecology Progress Series, 158(17), 257 265.
FAO, 1995, Code of conduct for responsible fisheries.
1 41.
FAO, 2000, Expert consultation on economic incentives and responsible fisheries, Final Draft. 3 7.
Han, I.S., D.H. Chang, B.H. Woo and C.H. Lim, 2009, A study on feasibility analysis of sewer rehabilitation.
Journal of Korean Society of Water and Wastewater, 23(1), 89 96.
HM Treasury, 2003, The Grean Book: Appraisal and Ebaluation in Central Gverment. 97 100.
Jung, D.J., 2008. An Economic analysis of agricultural water development: Icheon-si and Yeoju-gun.
Journal of Rural Development, 31(1), 113 136.
Kim, J.S., 2006, A feasibility analysis on the flower marketing complex in Yeoungnam region. Korean Journal of Food Marketing Economics, 23(3), 87 112.
KDI, 1999, A study on standard of preliminary feasibility study(1st), 1 7.
KDI, 2004, A study on standard of preliminary feasibility study / Revision?Complement(4th). 44 150.
OMB, 1992, Guidelines and discount rates for benefit- cost analysis of federal programs. OMB Circular, No. A 94.
Park, S.J., Y.T. Kim, E.S. Hwang, 1998, A study on the proposed comprehensive fund system for agriculture administration. Korea Rural Economic Institute, 7 9.
Park, S.K., K.N. Lee, H.J. Kwon and J.H. Jung, 2008, An economic analysis of biodegradable fishing gear model project. National Fisheries Research &
Development Institute, 79 109.
Park, S.W., C.D. Park, J.H. Bae and J.H. Lim, 2007, Catching efficiency and development of the biodegradable monofilament gill net for snow crab(Chionoecetes opilio). Journal of The Korean Society of Fisheries Technology, 43(1), 28 37.
Park, S.W., H.C. Ahn, Y.S. Yang, J.H. Bae, B.J. Cha, K.H. Lee, E.C. Jung, H.W. Park, B.S. Bae, C.D.
Park., S.K. Cho and H.Y. Kim,, 2006, Development of biodegradable fishing gear material for gill net
and trap. National Fisheries Research &
Development Institute, 21 28.
Park, S.W., J.H. Bae, J.H. Lim, B.J. Cha, C.D. Park, Y.S.
Yang and H.C. Ahn, 2007, Development and physical properties on the monofilament for gill nets and traps using biodegrardable alophatic polybutylene succinate resin. Journal of The Korean Society of Fisheries Technology, 43(4), 281 290.
Revill, A.S. and G. Dunlin, 2003, The fishing capacity of gillnets lost on wrecks and on open ground in UK coastal waters. Fisheries Research, 64, 107 113.
Santos, M.N., H.J. Saldanha, M.B. Gaspar, C.C.
Monterio, 2003, Hake(Merluccius Merluccius L., 1758) ghost fishing by gill nets off the Algarve(southern Portugal). Fisheries Research, 64, 119 128.
UNEP, 1999, Fisheries and the environment: Fisheries subsidies and overfishing: Towards a structured discussion. 4 7.
2009 10 23
2009 11 9 1
2009 11 16