* 이 논문은 2015년 기후변화대응 환경기술개발사업의 지원을 받아 한국환경정책·평가연구원이 수행한 “적응 대책 수립 지원을 위한 영향 및 적응평가 기술개발”과제의 연구결과임(과제번호: 2014001310005).
First author:Koo, Kyung Ah, National Institute of Ecology, 1210, Geumgang-ro, Maseo-Myeon, Seocheon-gun, Chungnam, 33657, Republic of Korea,
Tel:+82-41-950-5805, E-mail:[email protected]
Corresponding author:Jung, Huicheul, Korea Environment Institute, 370, Sicheong-daero, Sejong-si, 30147, Republic of Korea,
Tel:+82-44-415-7813, E-mail:[email protected]
Received:2 September, 2016. Revised:23 December, 2016. Accepted:23 December, 2016.
- 19 -
RCP 기후변화 시나리오에 따른 우리나라 구상나무 잠재 분포 변화 예측*
구경아1)․김재욱2)․공우석3)․정휘철2)․김근한2)
1)국립생태원․2)한국환경정책․평가연구원․3)경희대학교 지리학과
Projecting the Potential Distribution of Abies koreana in Korea Under the Climate Change Based on RCP Scenarios*
Koo, Kyung Ah1)․Kim, Jaeuk2)․Kong, Woo-seok3)․Jung, Huicheul2) and Kim, Geunhan2)
1)National Institute of Ecology,
2)Korea Environment Institute,
3)Department of Geography, Kyung Hee University.
ABSTRACT
The projection of climate-related range shift is critical information for conservation planning of Korean fir (Abies koreana E. H. Wilson). We first modeled the distribution of Korean fir under current climate condition using five single-model species distribution models (SDMs) and the pre-evaluation weighted ensemble method and then predicted the distributions under future climate conditions projected with HadGEM2-AO under four CO2 emission scenarios, the Representative Concentration Pathways (RCP) 2.6, 4.5, 6.0 and 8.5. We also investigated the predictive uncertainty stemming from five individual algorithms and four CO2 emission scenarios for better interpretation of SDM projections.
Five individual algorithms were Generalized linear model (GLM), Generalized additive model (GAM), Multivariate adaptive regression splines (MARS), Generalized boosted model (GBM) and Random
forest (RF). The results showed high variations of model performances among individual SDMs and the wide range of diverging predictions of future distributions of Korean fir in response to RCPs. The ensemble model presented the highest predictive accuracy (TSS = 0.97, AUC = 0.99) and predicted that the climate habitat suitability of Korean fir would increase under climate changes. Accordingly, the fir distribution could expand under future climate conditions. Increasing precipitation may account for increases in the distribution of Korean fir. Increasing precipitation compensates the negative effects of increasing temperature. However, the future distribution of Korean fir is also affected by other ecological processes, such as interactions with co-existing species, adaptation and dispersal limitation, and other environmental factors, such as extreme weather events and land-use changes. Therefore, we need further ecological research and to develop mechanistic and process-based distribution models for improving the predictive accuracy.
Key Words:Abies koreana, Species Distribution Model, Climate Change, Uncertainty
I. 서 론
산업화의 진행으로 지난 100년간 전지구 평 균온도는 0.78℃ 상승하였으며, 앞으로 100년간 1.0∼3.7℃ 상승할 것으로 전망되고 있다(IPCC, 2013). 우리나라는 복잡한 지역적 특성으로 인 해 기후변동성이 매우 크며, 21세기 말까지 기온 이 1.6∼4.5℃까지 상승할 것으로 예측되었다 (Shin and Jung, 2015).
고산 및 아고산 수종들은 한랭하고 습윤한 기 후조건을 선호하기 때문에 한랭한 기후에 적응 한 기후유존종들은 다른 종들에 비해 지구온난 화에 더욱 민감할 것으로 예측되고 있다(Randin et al., 2009; Hampe and Jump, 2011; Bell et al., 2014). 유럽과 북미의 장기생태연구지역에서 이 루어진 연구에 따르면 고산 및 아고산 식물의 분 포지가 축소되고 있으며, 온난한 기후를 선호하 는 식물의 분포지는 확대되는 것으로 나타났다 (Díaz-Varela et al., 2010; Feeley et al., 2011;
Stöckli et al., 2011; Pauli et al., 2012;
Ernakovich et al., 2014; Sproull et al., 2015).
구상나무(Abies koreana E. H. Wilson)는 취약 생태계로 분류되는 고산 및 아고산에 분포하는
우리나라 특산 수종이며, 동시에 기후유존종으 로 지구온난화에 가장 많은 영향을 받을 것으로 예측되고 있다(Kong et al., 2014). 한반도의 모 든 서식지에서 구상나무(A. koreana)의 성장쇠 퇴 및 산림쇠퇴가 관찰되고 있는데, 기존의 연구 들은 지구온난화를 그 원인으로 제시하였다 (Woo, 2009; Koo et al., 2001). 이러한 구상나무 의 쇠퇴에 기반하여 현재 International Union of Conservation of Nature (IUCN) 3.1에서는 구상 나무를 멸종위기종(Endangered species)으로 분 류하고 있다(Kim et al., 2011). 구상나무 분포지 의 변화는 한 수종의 분포 변화를 의미하는 것이 아니라, 우리나라 고산 및 아고산 생태계의 생태 적인 기능과 과정들의 변화를 보여준다고 할 수 있다.
따라서 우리나라 고산 및 아고산 생태계의 기 후변화 영향을 예측하고, 그 대책을 마련하기 위 하여 기후변화에 따른 구상나무 분포에 대한 체 계적인 접근이 필요하다. 본 연구에서는 기후변 화에 따른 구상나무 분포의 변화를 예측하고, 이 러한 예측에서 나타나는 불확실성을 분석하기 위하여 다양한 기후변화 시나리오 및 종분포 모 형을 활용하였다. 특히 다수의 종분포 모형들의
공통된 예측들을 통합하는 앙상블 모형을 활용 하여 구상나무 분포 변화 예측에 대한 정확도를 높이고자 하였다(Araújo et al., 2005).
II. 연구 재료 및 방법 1. 연구 수종
구상나무는 현재 한라산, 지리산, 백운산, 영축 산, 금원산, 덕유산, 가야산 및 속리산에 분포하 며, 이 가운데 속리산과 금원산, 영축산은 최근에 새롭게 발견된 자생 지역이다(Korea National Arboretum, 2015). 구상나무의 수직적 분포는 덕 유산(1,350∼1,590m), 가야산(1,350∼1,420m), 지리산(1,050∼1,900m), 한라산(1,000∼1,950m) 등이며, 정상부나 산 능선부의 암석지대에 주로 분포한다(Lee and Cho, 1993). 해발고도는 온도, 습도 변화에 영향을 미치고 있기 때문에 지형적 인 조건과 함께 구상나무의 분포를 결정하는 주 요한 요인으로 판단된다(Park, 1990). 구상나무가 자라는 지역의 토양은 사질양토나 미사질양토이 며, 연평균기온은 지리산 정상에서 1.3℃, 한라산 정상에서 -4.2℃로 측정되었다(Lee and Hong, 1995).
구상나무의 생장은 전반적으로 기온 및 강수 량과 양의 상관관계를 갖으나 겨울철 기온과는 음의 상관관계가 나타났다. 구상나무가 수분조 건에 매우 민감하기 때문에 기후변화에 따라 겨 울철 기온이 상승하고 겨울철 강수량이 충분히 공급되지 않을 경우, 광합성에 필요한 토양 수분 의 부족으로 인한 수분수지의 불균형이 나타난 다. 이러한 수분수지의 불균형은 구상나무 생장 에 부정적인 영향을 미치는 것으로 조사되었다 (Koo et al., 2001).
2. 연구 지역 및 자료
본 연구의 연구지역은 남한 전체이며, 구상나 무의 출현/비출현 자료는 국립수목원의 관속식 물분포도를 참고하여 14개 출현 지점 및 517개
비출현 지점 등 총 531개 지점을 추출하였다 (Korea National Arboretum, 2004; 2005; 2006;
2007; 2009; 2010a; 2010b; 2011). 기후자료는 Worldclim.org에서 제공하는 현재 및 미래 자료 를 사용하였다. 현재 시기는 1950년부터 2000년 까지의 평균 자료이며, 미래 예측 자료는 2041 년부터 2060년의 20년 예측 자료의 평균값(2050 년)과 2061년부터 2080년까지의 20년 예측 자료 의 평균값(2070년)을 이용하였다. 미래 기후자 료는 RCP2.6, RCP4.5, RCP6.0, RCP8.5 시나리 오를 이용한 HadGEM2-AO 모델의 기후 값을 사용하였다. 현재와 미래의 기후자료는 모두 1km×1km의 공간 스케일을 이용하였다.
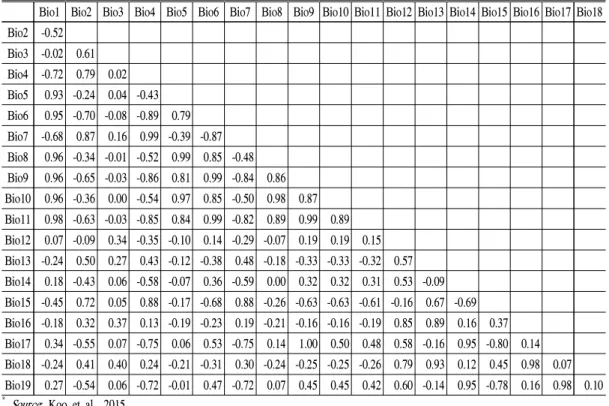
구상나무는 고산지대에 분포하는 아한대성 수종으로 기온 조건이 매우 중요하며, 강한 일사 량과 바람 그리고 추운 환경 때문에 수분 조건에 매우 민감하다(Koo et al., 2001; Song, 2011). 그 러므로 기온과 수분 조건을 함께 고려할 수 있는 Bioclim 19개 변수를 이용하여 종분포 모형을 개발하였다. 변수 간 Pearson’s correlation을 계 산하여 상관관계가 0.7 보다 높은 상관관계를 보 이는 변수들은 두 변수 중 한 변수를 제외시켰다 (Table 1). Bioclim 자료 중 연평균기온인 Bioclim1이 Bioclim5∼11과 높은 상관관계를 보였으며, Bioclim4는 Bioclim2와 높은 상관관 계를 보여 Bioclim1∼3을 기온을 대표하는 변수 로 선정하였다. 또한 연강수량인 Bioclim12는 Bioclim13∼14를 제외한 Bioclim15∼19의 다른 변수들과 높은 상관관계를 보여 Bioclim12∼14 를 강수량 관련 변수로 선정하여 분석에 사용하 였다(Koo et al., 2015).
3. 모형 개발
종분포 모형(Species Distribution Model, SDM)은 종의 출현 유무와 환경 요소와의 관계 를 통해 종의 출현 가능성을 예측하는 모형으로 기후변화에 따른 생물종의 서식지 변화를 예측 하는데 광범위하게 사용되고 있다(Guisan and
Bio1 Bio2 Bio3 Bio4 Bio5 Bio6 Bio7 Bio8 Bio9 Bio10 Bio11 Bio12 Bio13 Bio14 Bio15 Bio16 Bio17 Bio18 Bio2 -0.52
Bio3 -0.02 0.61 Bio4 -0.72 0.79 0.02 Bio5 0.93 -0.24 0.04 -0.43 Bio6 0.95 -0.70 -0.08 -0.89 0.79 Bio7 -0.68 0.87 0.16 0.99 -0.39 -0.87 Bio8 0.96 -0.34 -0.01 -0.52 0.99 0.85 -0.48 Bio9 0.96 -0.65 -0.03 -0.86 0.81 0.99 -0.84 0.86 Bio10 0.96 -0.36 0.00 -0.54 0.97 0.85 -0.50 0.98 0.87 Bio11 0.98 -0.63 -0.03 -0.85 0.84 0.99 -0.82 0.89 0.99 0.89 Bio12 0.07 -0.09 0.34 -0.35 -0.10 0.14 -0.29 -0.07 0.19 0.19 0.15 Bio13 -0.24 0.50 0.27 0.43 -0.12 -0.38 0.48 -0.18 -0.33 -0.33 -0.32 0.57 Bio14 0.18 -0.43 0.06 -0.58 -0.07 0.36 -0.59 0.00 0.32 0.32 0.31 0.53 -0.09 Bio15 -0.45 0.72 0.05 0.88 -0.17 -0.68 0.88 -0.26 -0.63 -0.63 -0.61 -0.16 0.67 -0.69 Bio16 -0.18 0.32 0.37 0.13 -0.19 -0.23 0.19 -0.21 -0.16 -0.16 -0.19 0.85 0.89 0.16 0.37 Bio17 0.34 -0.55 0.07 -0.75 0.06 0.53 -0.75 0.14 1.00 0.50 0.48 0.58 -0.16 0.95 -0.80 0.14 Bio18 -0.24 0.41 0.40 0.24 -0.21 -0.31 0.30 -0.24 -0.25 -0.25 -0.26 0.79 0.93 0.12 0.45 0.98 0.07 Bio19 0.27 -0.54 0.06 -0.72 -0.01 0.47 -0.72 0.07 0.45 0.45 0.42 0.60 -0.14 0.95 -0.78 0.16 0.98 0.10
* Source: Koo et al., 2015
Table 1. Pearson’s correlations on bioclim variables
Thuiller, 2005; Elith and Leathwick, 2009).
본 연구에서는 구상나무의 미래 분포 예측을 위하여 통계를 기반으로 하는 Generalized linear models(GLM), Generalized additive models (GAM), Multivariate adaptive regression splines (MARS) 모형과 기계 학습 모형인 Generalized Boosted Model(GBM), Random forest(RF) 등 총 5가지 모형을 이용하여 종분포 모형을 개발하였 다(Franklin, 2009). 이와 더불어 모형의 불확실 성을 저감하기 위하여 5개 모형 결과에서 도출 된 True Skill Statistics(TSS) 값을 모형별 가중치 로 반영한 TSS weighted 앙상블 모형을 개발하 였다(Kwon, 2014). 개별 모형과 앙상블 모형 개 발은 R package인 BIOMOD2를 이용하였다 (Thuiller et al., 2013).
종분포 모형을 개발하기 위하여 구상나무의 531개 출현/비출현 자료와 각 조사지점들에 대 한 기후 자료 중 70%의 자료는 훈련자료(train-
ing data)로 이용하여 모형을 개발하였고, 30%는 시험자료(test data)로 모형 결과들을 검증하는데 이용하였다. 모형 개발 및 검증을 위한 기후 자 료의 7대 3 분할 과정은 무작위로 이루어졌으며, 자료 분할 과정에서 발생할 수 있는 자료의 편향 에 따른 문제를 최소화하기 위하여 모형 개발과 검증 과정을 10회 반복 실시하였다.
서식지 분포 예측도는 출현과 비출현으로 표 현되는 이항형 지도로 변환하였다. 출현지역의 모형 예측력을 설명하는 Sensitivity(민감도)와 비출현지역의 모형 예측력을 설명하는 Specifi- city(특이도)가 최대가 되는 값을 임계값으로 설 정하였다.
4. 모형 검증
모형 검증은 시험자료(test data)를 이용하여 이루어졌으며, Area Under the Curve(AUC) values of Receiver Operating Characteristic
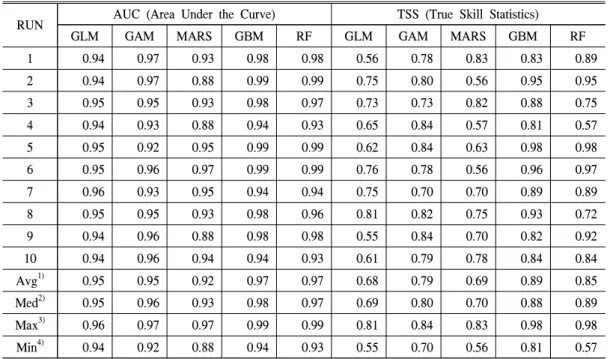
RUN AUC (Area Under the Curve) TSS (True Skill Statistics)
GLM GAM MARS GBM RF GLM GAM MARS GBM RF
1 0.94 0.97 0.93 0.98 0.98 0.56 0.78 0.83 0.83 0.89
2 0.94 0.97 0.88 0.99 0.99 0.75 0.80 0.56 0.95 0.95
3 0.95 0.95 0.93 0.98 0.97 0.73 0.73 0.82 0.88 0.75
4 0.94 0.93 0.88 0.94 0.93 0.65 0.84 0.57 0.81 0.57
5 0.95 0.92 0.95 0.99 0.99 0.62 0.84 0.63 0.98 0.98
6 0.95 0.96 0.97 0.99 0.99 0.76 0.78 0.56 0.96 0.97
7 0.96 0.93 0.95 0.94 0.94 0.75 0.70 0.70 0.89 0.89
8 0.95 0.95 0.93 0.98 0.96 0.81 0.82 0.75 0.93 0.72
9 0.94 0.96 0.88 0.98 0.98 0.55 0.84 0.70 0.82 0.92
10 0.94 0.96 0.94 0.94 0.93 0.61 0.79 0.78 0.84 0.84
Avg1) 0.95 0.95 0.92 0.97 0.97 0.68 0.79 0.69 0.89 0.85
Med2) 0.95 0.96 0.93 0.98 0.97 0.69 0.80 0.70 0.88 0.89
Max3) 0.96 0.97 0.97 0.99 0.99 0.81 0.84 0.83 0.98 0.98
Min4) 0.94 0.92 0.88 0.94 0.93 0.55 0.70 0.56 0.81 0.57
1) Avg: Average, 2) Med: Median, 3) Max: Maximum,4) Min: Minimum
Table 2. The AUC and TSS values for single-model SDMs. The sample-split procedure was repeated ten times.
Accordingly, the modelling and model evaluation process was also repeated ten times for each of the five models and produced ten AUCs and TSSs for each individual SDM.
(ROC) curves와 True Skill Statistics(TSS) 값을 사용하였다(Landis and Koch, 1977; Pearson, 2007; Kwon, 2014). AUC 값은 출현자료에 대한 비출현 자료의 비율에 영향을 받지 않을 뿐 아니 라 출현율에 대한 예측 정확도와 비출현율에 대 한 예측 정확도를 모두 포함하기 때문에 종분포 모형의 검증에 많이 사용된다. 그러나 광범위하 게 분포하는 종들의 경우 AUC 값이 낮게 나오 며, 분석 대상종이 국지적으로 한정된 장소에 분 포할 경우 AUC 값이 높게 나오는 특징이 있다 (Lobo et al., 2008). 이러한 AUC 값의 단점을 보 안하기 위하여 TSS 값을 모형 검증에 사용하는 사례들이 증가하고 있다. TSS 값은 종의 출현율 과 비출현율 예측의 정확성을 모두 포함하며, 출 현과 비출현 자료의 비율이나 자료 수집의 면적 등에 영향을 거의 받지 않아 검증 결과의 신뢰성 이 매우 높은 것으로 나타났다(Allouche et al., 2006).
III. 결과 및 고찰
1. 현재 구상나무의 분포 예측과 모형 불확도 5개의 개별 모형을 이용하여 각각 현재의 구 상나무의 분포를 예측하였다. 10회의 교차 검증 과정에서 각각의 모형마다 10개의 종분포 모형 이 생성되었고, 5개의 개별 모형에 대하여 총 50 개의 종분포 모형이 구축되었다. 모형의 예측력 과 예측값들의 공간적 분포들은 모델링을 시행 할 때마다 개별 모형별로 다르게 나타났다 (Table 2, Figure 1). 가장 낮은 TSS 값은 0.55로 GLM 모형을 적용한 종분포 모형에서 도출되었 으며, 가장 낮은 AUC 값인 0.88을 보인 모형은 MARS였다. 대부분의 모형들은 TSS 값이 0.6 이상, AUC 값이 0.9를 넘는 모형 정확도를 보였 으며, 특히 RF와 GBM 모형은 0.97 이상의 AUC 값과 0.88 이상의 TSS 값을 보여 매우 높은 예측 정확도를 나타내었다.
Model GLM GAM MARS GBM RF TSS weighted Ensemble
AUC 0.95 0.95 0.92 0.97 0.97 0.99
TSS 0.68 0.79 0.69 0.89 0.85 0.97
Table 3. The AUC and TSS values of five single-model SDMs and the TSS weighted ensemble model
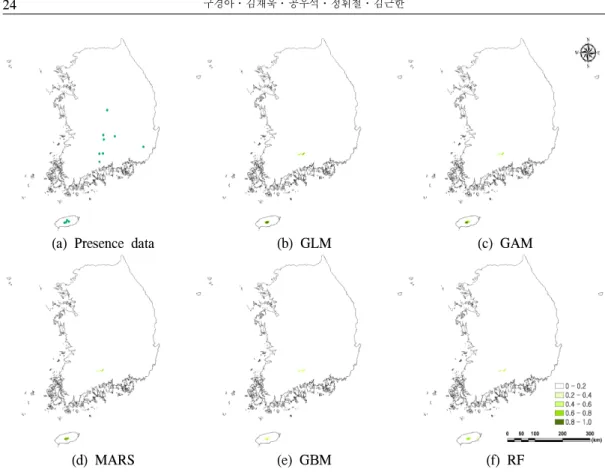
(a) Presence data (b) GLM (c) GAM
(d) MARS (e) GBM (f) RF
Figure 1. Species occurrence data (a) and the fir projections of five single-model SDMs (b-f)
구상나무의 공간적 분포를 살펴본 결과, 5개 의 모형에서 주로 한라산과 지리산에 구상나무 가 분포할 확률이 높게 나타났다. 덕유산 지역은 한라산과 지리산 지역보다 실제 분포를 잘 반영 하지 못한 결과가 도출되었다. 최근에 구상나무 가 발견된 속리산, 금원산 및 영축산 등지는 분 포 확률이 상대적으로 낮게 나왔으며, 이러한 결 과는 다른 지역들 보다 이 지역들에 구상나무의 개체수가 적은 것에 기인한다고 볼 수 있다. 특 히, GAM과 RF 모형에서는 분비나무(Abies nephrolepis (Trautv. ex Maxim.) Maxim.)가 자라 는 설악산 지역도 구상나무가 서식할 수 있는 환
경조건인 것으로 예측되었으며, 앞으로 이식 실 험 등을 통해 구상나무 대체서식지로 설악산의 가능성을 확인해야 할 것이다(Figure 1).
50개의 개별 종분포 모형 가운데 TSS 값이 0.6 이상인 44개 모형에 대하여 앙상블 기법을 적용한 결과, TSS 값이 0.9 이상으로 모형의 예 측력이 향상되어 개별 모형들과 비교해서 더 높 은 모형의 예측 정확도를 나타내었다(Table 3).
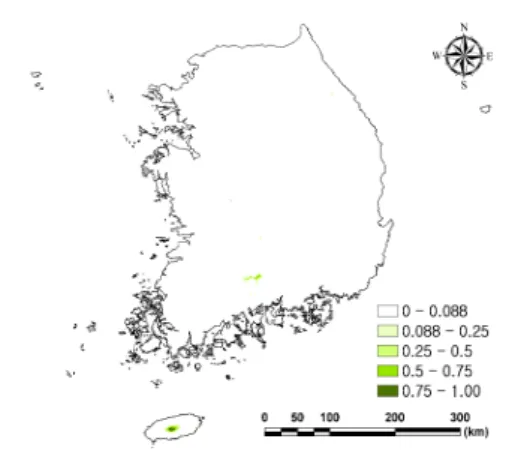
5개 모형의 결과에 TSS 가중치를 부여해서 종합한 결과, 구상나무가 대규모로 분포하는 한 라산과 지리산, 덕유산 이외에도 백운산(21.1%), 신불산과 영축산(17.5%), 가야산(17.2%), 금원
Figure 2. The current distribution of Korean fir projected by TSS weighted ensemble method.
산(13.5%) 지역에서 구상나무가 분포할 것으로 예측되어 실제 분포를 잘 예측하는 것으로 판단 되었다. 그러나 속리산과 설악산에서의 예측은 실제 분포를 잘 반영하지 못하는 것으로 나타났 다. 속리산 지역에서는 분포할 확률이 매우 낮게 나타난 반면에 GAM과 RF 개별 모형 결과에서 예측된 것과 같이 설악산 지역(10.6%)은 상대적 으로 높은 출현 확률을 보여 구상나무가 분포할 것으로 예측되었다(Figure 2).
설악산과 속리산에서 나타난 예측의 불일치 는 본 연구의 공간적 스케일과 모델에서 사용된 기후변수들이 가지고 있는 한계점 때문으로 판 단된다. 속리산의 경우 구상나무의 서식지는 국 지적으로 매우 작은 지역에서 나타나며, 이러한 미소서식지를 예측하기 위해서는 미기후환경을 반영한 미소지역 모형의 개발이 필요하다. 그러 나 본 연구에서 개발된 모형들은 우리나라 전체 를 대상으로 하였기 때문에 이러한 미소서식지 의 환경을 잘 반영하지 못하며, 그 결과 속리산 과 같은 소규모의 미소서식지들을 예측하는데 한계점을 가진다. 또한 설악산의 경우와 같이 서 식지 기후조건이 적합하다고 할지라도, 토양 및 연관종들과의 상호작용 등 다른 인자들에 의해 구상나무의 분포가 제한받을 수 있다. 그러나 본 연구에서는 기후요소들만을 고려하였기 때문에
정확한 실제 구상나무의 분포지를 예측하는 것 에 한계점을 갖는다. 구상나무 분포 모형의 예측 력을 높이기 위해서는 미소서식지 단위의 모형 개발과 다양한 환경인자들과 생물인자들을 고 려한 모형 개발이 필요할 것으로 판단된다.
2. 기후변화에 따른 구상나무의 분포변화와 기후 변화 시나리오에 따른 불확도
TSS 가중치를 고려한 앙상블 모형을 적용하 여 RCP 2.6, 4.5, 6.0, 8.5 시나리오별로 구상나무 잠재서식지에 대한 기후변화의 영향을 예측한 결과, 구상나무의 잠재서식지는 미래에 증가하 는 것으로 나타났다. 이러한 잠재서식지의 확대 는 기후변화 시나리오에 따라 다르게 나타났는 데, RCP 2.6 시나리오를 바탕으로 예측한 경우 분포지가 가장 많이 확대되었고 RCP 6.0 시나리 오에서 가장 적게 확대되었다(Figure 3).
지금까지 구상나무는 고산 및 아고산 지역의 기후유존종으로서 기후변화에 따라 그 분포지 가 축소될 것으로 예측되어 왔다(Park, 1990;
Koo et al., 2001; Woo, 2009; Kim et al., 2011).
그러나 본 연구결과에서 구상나무는 미래에 분 포지가 확장될 수 있다는 것을 보여주었다. 이러 한 예측이 나온 것은 강수량과 관련이 있는 것으 로 판단된다.
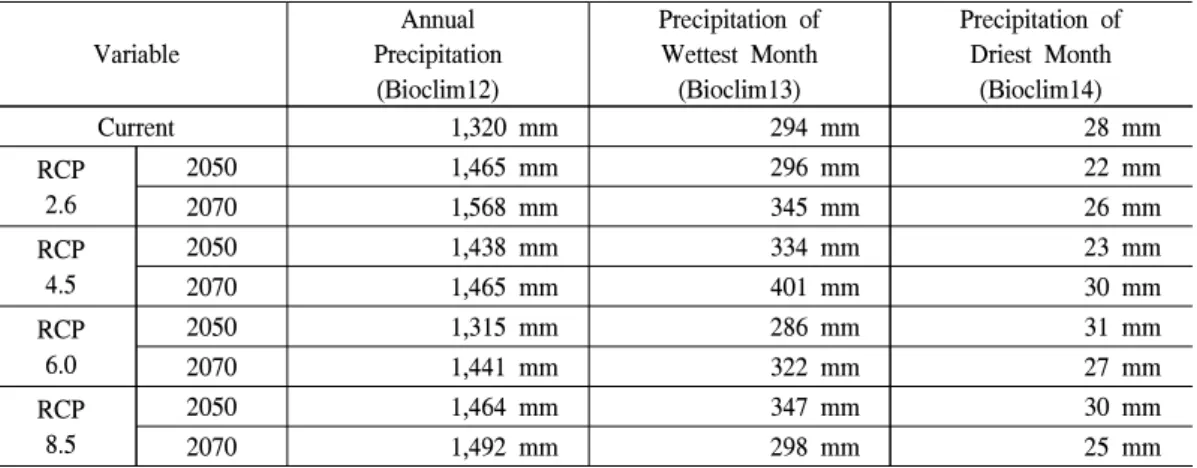
RCP 6.0 시나리오의 2050년은 강수량과 관련 된 Bioclim12∼14 변수가 현재시기와 매우 유사 하게 나타났으며, 나머지 다른 조건에서 Bioc- lim12와 Bioclim13은 모두 증가하였다(Table 4).
이러한 시나리오별 강수량 증가의 차이는 시나 리오별로 예측된 구상나무의 미래 분포지 확대 에 있어서의 차이를 잘 설명한다. 본 연구의 예 측결과는 구상나무의 쇠퇴원인이 온난화에 따 른 건조스트레스인 것을 고려할 때 구상나무가 기온 상승에 따른 부정적인 영향을 수분조건으 로 극복할 가능성을 보여준다(Park, 1990; Koo et al., 2001). 유럽의 여러 나라들에서 이루어진 전나무속에 속하는 Silver fir와 Douglas-fir 등의
2041∼2060(2050) 2061∼2080(2070)
RCP2.6
RCP 4.5
RCP 6.0
RCP 8.5
Figure 3. The future distributions of Korean fir in 2050 and 2070 predicted under RCP 2.0, 4.5, 6.0 and 8.5 scenarios.
쇠퇴 연구에서도 기후요소 중 가뭄스트레스가 쇠퇴의 가장 중요한 원인인 것으로 조사되었다 (Becker et al., 1989; Camarero et al., 2011;
Linares and Camarero, 2012a; 2012b; Sergent et
al., 2014). 특히 Silver fir는 습윤 조건이 좋은 곳 에서는 생장과 군집이 잘 유지되었으나 건조스 트레스가 심한 곳에서는 생장쇠퇴와 고사율이 높게 나타났다(Linares and Camarero, 2012b).
Variable Annual Precipitation (Bioclim12)
Precipitation of Wettest Month (Bioclim13)
Precipitation of Driest Month
(Bioclim14)
Current 1,320 mm 294 mm 28 mm
RCP 2.6
2050 1,465 mm 296 mm 22 mm
2070 1,568 mm 345 mm 26 mm
RCP4.5 2050 1,438 mm 334 mm 23 mm
2070 1,465 mm 401 mm 30 mm
RCP 6.0
2050 1,315 mm 286 mm 31 mm
2070 1,441 mm 322 mm 27 mm
RCP8.5 2050 1,464 mm 347 mm 30 mm
2070 1,492 mm 298 mm 25 mm
Table 5. The current precipitation and the future precipitation projected with HadGEM2-AO under four RCPs.
식물생리학적 선행 연구들에서 겨울의 따뜻 한 기온이 수분 스트레스와 함께 식물생장에 부 정적인 영향을 주는 것으로 나타났다(Sevanto et al., 2006). 이러한 연구 결과들은 미래의 강수량 의 증가에 의한 가용한 수분의 증가가 구상나무 의 성장과 분포에 미치는 기온 상승의 부정적인 요인들을 상쇄할 수 있음을 보여준다. 그러므로 기후변화에 의한 강수량의 증가는 구상나무의 성장 및 생존에 긍정적인 효과를 가져와 생장 및 분포를 증가시킬 수 있을 것이다.
그러나 본 연구에서 예측된 구상나무 서식지 의 변화는 다양한 생태계 요인들을 고려할 때 분 포지 확대를 설명하기에는 한계가 있다. 특히, 기후변화에 따른 외래종과 교란종의 침입은 구 상나무의 서식지 확장을 방해할 수 있다. 한라산 의 경우, 제주조릿대의 확산에 의해 구상나무의 치수들이 성장에 저해를 받아 분포지 축소가 우 려되고 있다(Song, 2011). 또한 구상나무는 주로 토심이 얕은 곳에 자라고 있기 때문에 강수량의 증가가 강수패턴에 따라 부정적인 영향을 미칠 수도 있다(Song, 2011; Korea National Arbore- tum, 2015). 좁은 지역에 단시간에 내리는 집중 호우가 증가할 경우, 토층이 얕은 서식지에 분포 하는 구상나무의 분포는 쇠퇴할 가능성을 배제 할 수 없다. 이러한 인자들을 종합적으로 고려한 다면, 구상나무의 서식지가 미래의 기후변화에
의해 얼마나 긍정적인 영향을 받을 것인지는 분 명하지 않다. 오히려, 외래종 및 교란종의 침입 과 집중호우 등의 증가로 그 분포지가 축소될 수 도 있을 것으로 판단된다. 그러므로 좀 더 정확 한 현재와 미래 분포 변화 예측을 위하여 미소서 식지 단위의 과정기반 동적 서식지 모형의 개발 이 필요하며, 이를 위하여 각 미소서식지 단위의 개체군의 동적 변동과 환경과의 관계를 장기적 이고 종합적으로 연구하는 프로그램의 개발이 필요하다.
IV. 결 론
기후변화에 의해 기온 및 강수량이 증가할 것 으로 예측됨에 따라 생태계에는 많은 변화가 예 상되고 있다. 특히 구상나무와 같이 고산 및 아 고산 지역에 분포하는 식생은 서식환경의 변화 로 인하여 종의 절멸까지 언급되고 있다. 본 연 구에서는 RCP 시나리오 4종과 대표적인 종분포 모형 5개 등 미래 기후변화 불확실성을 고려한 우리나라의 구상나무 분포 변화를 예측하였다.
분석 결과, 구상나무 분포 예측 값의 공간적 분 포와 모형 예측력은 개별 모형들에 따라 다르게 나타났으며, 각 개별 모형보다 TSS 가중치를 고 려한 앙상블 모형이 통계적으로 높은 예측 정확 도를 나타내었다. 미래에는 구상나무의 잠재 분
포지가 확대될 것으로 예측되었으나, 확대 정도 는 기후변화 시나리오에 따라 상이하게 예측되 었다. 구상나무의 서식지 확대 예측은 기온 상승 으로 인한 스트레스를 강수량의 증가가 상쇄하 기 때문인 것으로 판단되었다. 그러나 본 연구에 서 예측된 구상나무 서식지의 변화는 외래종 및 교란종의 침입, 기후변화에 따른 기상재해 등 다 양한 생태계 요인들을 고려할 때 분포지 확대를 설명하기에 한계가 있다. 그러므로 좀 더 정확한 예측을 위하여 각 미소서식지의 특성이 잘 반영 된 각 미소서식지 단위의 종분포 모형 개발과 그 에 따른 미래 서식지 변화 예측에 대한 추가 연 구가 필요하다.
References
Allouche, O.․A. Tsoar and R. Kadmon. 2006.
Assessing the accuracy of species distribution models: prevalence, kappa and the true skill statistic (TSS). Journal of Applied Ecology 43(6): 1223-1232.
Becker, M.․G. Landmann and G. Lévy. 1989.
Silver fir decline in the vosges mountains (France): Role of climate and silviculture.
Water, Air, and Soil Pollution 48(1): 77-86.
Bell, D. M.․J. B. Bradford and W. K. Lauenroth.
2014. Mountain landscapes offer few oppo- rtunities for high-elevation tree species mi- gration. Global Change Biology 20(5):
1441-1451.
Camarero, J. J.․C. Bigler․J. C. Linares and E.
Gil-Pelegrin. 2011. Synergistic effects of past historical logging and drought on the decline of Pyrenean silver fir forests. Forest Ecology and Management 262(5): 759-769.
Díaz-Varela, R. A.․R. Colombo․M. Meroni․
M. S. Calvo-Iglesias․A. Buffoni and A.
Tagliaferri. 2010. Spatio-temporal analysis of
alpine ecotones: A spatial explicit model tar- geting altitudinal vegetation shifts. Ecolog- ical Modelling 221(4): 621-633.
Elith, J. and J. R. Leathwick. 2009. Species dis- tribution models: Ecological explanation and predict- ion across space and time. Annual Review of Ecology, Evolution, and Systemat- ics 40: 677-697.
Ernakovich, J. G.․K. A. Hopping․A. B.
Berdanier․R. T. Simpson․E. J. Kachergi s․H. Steltzer and M. D. Wallenstein. 2014.
Predicted responses of arctic and alpine eco- systems to altered seasonality under climate change. Global Change Biology 20(10):
3256-3269.
Feeley, K. J.․M. R. Silman․M. B. Bush․W.
Farfan․K. G. Cabrera․Y. Malhi․P. Mei r․N. S. Revilla․M. N. R. Quisiyupanqui and S. Saatchi. 2011. Upslope migration of Andean trees. Journal of Biogeography 38(4):
783-791.
Franklin, J. 2009. Mapping Species Distributions Spatial Inference and Prediction. New York:
Cambridge University Press.
Guisan, A. and W. Thuiller. 2005. Predicting spe- cies distribution: offering more than sim- ple habitat models. Ecology Letters 8(9): 993- 1009.
Hampe, A. and A.S. Jump. 2011. Climate relicts:
past, present, future. Annual Review of Eco- logy, Evolution, and Systematics 42: 313- 333.
IPCC. 2013. Climate Change 2013: The Physical Science Basis. Contribution of Working Gro- up I to the Fifth Assessment Report of the Intergovernmental Panel on Climate Change [Stocker, T. F., D. Qin․G.-K. Plattner․M.
Tignor, S. K. Allen․J. Boschung․A.
Nauels․Y. Xia․V. Bex and P. M. Midgley (eds.)]. Cambridge University Press, Cam- bridge, United Kingdom and New York, NY, USA.
Kim YS․Chang CS․Kim CS and M. Gardner.
2011. Abies koreana. The IUCN Red List of Threatened Species 2011: e.T31244A96 18913.
Kong WS․Kim KO․Lee SG․Park HN and Cho SH. 2014. Distribution of high mountain plants and species vulnerability against cli- mate change. Journal of Environmental Im- pact Assessment 23(2): 119-136. (in Korean with English summary)
Koo KA․Kong WS․N. P. Nibbelink․C. S.
Hopkinson and Lee JH. 2015. Potential ef- fects of climate change on the distribution of cold-tolerant evergreen broadleaved woo- dy plants in the Korean Peninsula. PLoS ONE 10(8): e0134043. doi:10.1371/journal.
pone. 0134043
Koo KA․Park WK and Kong WS. 2001. Dendro- chronological analysis ofAbies koreana W.
at Mt. Halla, Korea-Effects of climate change on the growths. Journal of Ecology and En- vironment 24(5): 281-288. (in Korean with English summary)
Korea National Arboretum. 2004. Distribution Maps of Vascular Plants of Korean Peninsu- la; South-Coast Province. (in Korean) Korea National Arboretum. 2005. Distribution Ma-
ps of Vascular Plants of Korean Peninsula;
South Province (Jeolla-do & Jirisan). (in Korean)
Korea National Arboretum. 2006. Distribution Maps of Vascular Plants of Korean Peninsu- la; Central & South Province (Chungcheong -do). (in Korean)
Korea National Arboretum. 2007. Distribution Maps of Vascular Plants of Korean Peninsula;
Central Province (Gyeonggi-do). (in Korean) Korea National Arboretum. 2009. Distribution Maps of Vascular Plants of Korean Peninsu- la; Central Province (Gangwon-do). (in Korean) Korea National Arboretum. 2010a. Distribution Maps of Vascular Plants of Korean Peninsu- la; South Province (Gyeongsangnam-do) and Ulleung-do province. (in Korean)
Korea National Arboretum. 2010b. Distribution Maps of Vascular Plants of Korean Peninsu- la; Jeju-do Province. (in Korean)
Korea National Arboretum. 2011. Distribution Maps of Vascular Plants of Korean Peninsu- la; Western & Southern Coastal Area. (in Korean)
Korea National Arboretum. 2015. Forest of Korea (I)-Conservation of Korean fir(Abies Koreana) in a Changing Environment. (in Korean) Kwon HS. 2014. Applying ensemble model for
identifying uncertainty in the species dis- tribu- tion models. Journal of the Korean Society for Geospatial Information System 22(4): 47-52. (in Korean with English sum- mary)
Landis, J. R. and G. G. Koch. 1977. The measure- ment of observer agreement for categorical data. Biometrics 33(1): 159-174.
Lee CS and Cho HJ. 1993. Structure and dynamics ofAbies koreana Wilson community in Mt.
Gaya. Journal of Ecology and Environment 16(1): 75-91. (in Korean with English sum- mary)
Lee YW and Hong SC. 1995. Ecological studies on the vegetational characteristics of the Abies koreana forest. Journal of Korean Forestry Society 84(2): 247-257. (in Korean
with English summary)
Linares, J. C. and J. J. Camarero. 2012a. Growth patterns and sensitivity to climate predict sil- ver fir decline in the Spanish Pyrenees.
European Journal of Forest Research 131(4):
1001-1012.
Linares, J. C. and J. J. Camarero. 2012b. From pattern to process: linking intrinsic water-use efficiency to drought-induced forest decline.
Global Change Biology 18(3): 1000-1015.
Lobo, J. M.․A. Jiménez-Valverde and R. Real.
2008. AUC: a misleading measure of the per- formance of predictive distribution models.
Global Ecology and Biogeography 17(2):
145-151.
Park JH. 1990. Phytosociological Study on the Abies koreana Forest in Banyabong of Mt.
Chiri, Korea. Master thesis, Chung-Ang University. (in Korean)
Pauli et al. 2012. Recent plant diversity changes on Europe’s mountain summits. Science 336(6079): 353-355.
Pearson, R. G.. 2007. Species’ distribution model- ing for conservation educators and practit- ioners. Lessons in Conservation (LinC) Developing the capacity to sustain the earth’s diversity: 54-89.
Randin, C. F.․R. Engler․S. Normand․M.
Zappa․N. E. Zimmermann․P. B. Pearma n․P. Vittoz․W. Thuiller and A. Guisan.
2009. Climate change and plant distribution:
local models predict high-elevation persis- tence. Global Change Biology 15(6): 1557- 1569.
Sergent, A. S.․P. Rozenberg and N. Bréda. 2014.
Douglas-fir is vulnerable to exceptional and
recurrent drought episodes and recovers less well on less fertile sites. Annals of Forest Science 71(6): 697-708.
Sevanto, S.․T. Suni․J. Pumpanen․T. Grönho- lm․P. Kolari․E. Nikinmaa․P. Hari and T. Vesala. 2006. Wintertime photosynthesis and water uptake in a boreal forest. Tree Physiology 26(6): 749-757.
Shin YH and Jung HC. 2015. Assessing un- certainty in future climate change in Northe- ast Asia using multiple CMIP5 GCMs with four RCP scenarios. Journal of Environmen- tal Impact Assessment 24(3): 205-216. (in Korean with English summary)
Song KM. 2011. Vegetation Structure and Dyna- mics ofAbies koreana Forests on Mt. Halla.
Ph.D dissertation, Jeju National University.
(in Korean)
Sproull, G. J.․M. F. Quigley․A. Sher and E.
González. 2015. Long-term changes in com- position, diversity and distribution patterns in four herbaceous plant communities along an elevational gradient. Journal of Vegetation Science 6(3): 552-563.
Stöckli, V.․S. Wipf․C. Nilsson and C. Rixen.
2011. Using historical plant surveys to track biodiversity on mountain summits. Plant Ecology & Diversity 4(4): 415-425.
Thuiller, W.․D. Georges and R. Engler. 2013.
Biomod2: Ensemble Platform for Species Distribution Modeling. R Package Version 2.7.
Woo SY. 2009. Forest decline of the world: A linkage with air pollution and global warm- ing. African Journal of Biotechnology 8(25):
7409-7414.