기후변화에 따른 송악의 잠재서식지 분포 변화 예측
박선욱*․구경아*†․서창완*․공우석**
*국립생태원 융합연구실, **경희대학교 지리학과
Potential Impact of Climate Change on Distribution of Hedera rhombea in the Korean Peninsula
Park, Seon Uk*, Koo, Kyung Ah*†, Seo, Changwan* and Kong Woo-Seok**
*Division of Ecosystem Services & Research Planning, National Institute of Ecology, Korea
**Department of Geography, Kyung Hee University, Korea
ABSTRACT
We projected the distribution of Hedera rhombea, an evergreen broad-leaved climbing plant, under current climate conditions and predicted its future distributions under global warming. Inaddition, weexplained model uncertainty by employing 9 single Species Distribution model (SDM)s to model the distribution of Hedera rhombea. 9 single SDMs were constructed with 736 presence/absence data and 3 temperature and 3 precipitation data. Uncertainty of each SDM was assessed with TSS (Ture Skill Statistics) and AUC (the Area under the curve) value of ROC (receiver operating characteristic) analyses. To reduce model uncertainty, we combined 9 single SDMs weighted by TSS and resulted in an ensemble forecast, a TSS weighted ensemble. We predicted future distributions of Hedera rhombea under future climate conditions for the period of 2050 (2040∼2060), which were estimated with HadGEM2-AO. RF (Random Forest), GBM (Generalized Boosted Model) and TSS weighted ensemble model showed higher prediction accuracies (AUC > 0.95, TSS > 0.80) than other SDMs. Based on the projections of TSS weighted ensemble, potential habitats under current climate conditions showed a discrepancy with actual habitats, especially in the northern distribution limit. The observed northern boundary of Hedera rhombea is Ulsan in the eastern Korean Peninsula, but the projected limit was eastern coast of Gangwon province. Geomorphological conditions and the dispersal limitations mediated by birds, the lack of bird habitats at eastern coast of Gangwon Province, account for such discrepancy.
In general, potential habitats of Hedera rhombea expanded under future climate conditions, but the extent of expansions depend on RCP scenarios. Potential Habitat of Hedera rhombea expanded into Jeolla-inland area under RCP 4.5, and into Chungnam and Wonsan under RCP 8.5. Our results would be fundamental information for understanding the potential effects of climate change on the distribution of Hedera rhombea.
Key words: Hedera rhombea, Species Distribution Model(SDM), Potential Habitat, Climate Change
†Corresponding author: [email protected]
Received July 18, 2016 / Revised August 23, 2016 / Accepted September 9, 2016
1. 서 론
산업화 이후 인간에 의한 인위적인 이산화탄소 배출은 지구 의 기후 시스템에 영향을 미쳤으며, 그로 인해 지난 100년간 지 구의 지표 평균온도는 약 0.78℃ 상승한 것으로 관측되었다.
또한 미래 기후변화 시나리오에 따라 21세기말에 지구표면온 도는 현재보다 1.0∼3.7℃ 증가할 것으로 예측되었다(IPCC, 2014). 한반도의 경우, 연평균기온은 지난 30년간 1.2℃ 상승
하였고, 미래 기후변화 시나리오에 따라 2071∼2100년의 기온 상승폭이 전 지구 평균 상승 경향의 1.2배, 동아시아 지역 평 균 상승 경향의 1.4배를 상회할 것으로 전망되었다(National Institute of Meteorological Sciences, 2012). 기후변화는 기온 의 상승, 강수량과 강수패턴의 변화, 해수면 상승과 같은 지구 물리적 시스템의 변화가 동반되며, 이로 인해 육상과 해양생태 계의 부정적인 영향을 초래한다. 해양생태계의 경우, 해양 산 성화로 인해 산호초, 갑각류 및 어류가 위험에 직면할 것으로
예측되며, 육상생태계는 고온, 가뭄, 해충과 질병 발생과 같은 영향으로 많은 지역에서 육상생물의 위험이 증가할 것으로 전 망되었다(IPCC, 2014).
기후변화에 대한 다양한 전망이 예측되면서, 기후변화가 생 물의 서식지에 미치는 영향을 연구하고, 대응대책을 수립하는 다양한 연구가 진행되었다(Collins et al., 2008; Feeley et al., 2011; Feeley et al., 2012; Díaz et al., 2015; Koo et al., 2001;
Kong, 1999; Kong, 2005). 많은 연구들이 기온과 강수의 변화 에 따른 식물계절의 변화, 난대성 식물의 서식지 확대, 한대성 식물의 서식지 유실과 멸종의 가능성에 예측하였다(Choi and Jung, 2014; Díaz-Varela et al., 2010; Dullinger et al., 2012;
Ju and Bang, 2008; Jung et al., 2015; Kim and Yon, 2010;
Koo et al., 2015). 고산과 극지역에 서식하는 식물은 기후변화 에 의해 봄철 식물계절현상이 빨라졌으며, 유럽의 산지 부근 에 분포하던 난대성 식물의 서식지도 기후변화에 따라 고도 가 높은 지역까지 확대되었다(Zimmermann et al., 2013). 이와 반대로, 유럽의 고산식물들은 기후변화에 따라 분포지가 쇠퇴 하고 있는 것으로 분석되었다(Randin et al., 2009).
한반도의 전체면적은 220,847 km2이며, 남북으로 길게 뻗 어있는 반도 형태로 면적의 70% 정도가 산지로 분류된다. 특 히 남한의 난대성 상록활엽수림의 경우, 북위 35° 이남의 해안 과 연평균기온 14℃ 이상인 지역에 주로 분포한다(National In- stitute of Forest Science, 2009). 송악(Hedera rhombea(Miq.) Siebold & Zucc. Ex Bean)은 난대성 상록활엽수로 덩굴성 식 물로 분류된다. 줄기와 잎은 상춘등이라고 하여 류마티스 관 절염, 간염 등의 치료제로 사용되었고, 열매에는 Rutin, Kizu- tasaponin K5, Caffeic acid가 함유되어 있어 과거부터 약재로 활용되었다(Kim, 2010). 송악에 관한 연구는 대부분이 실험을 통한 함유물질에 관한 것과 조경에 사용되는 용도로써 식재가 능 범위와 인공광원과 광도에 따른 생육변화에 관한 내용이 대부분이며, 종 분포모형을 사용한 연구는 아직 이루어지지 않 았다(Ju and Bang, 2008; Kim, 2010; Kim, 1997). 송악은 한반 도에서 기후변화에 따른 생태계의 영향을 확인하고, 지속적으 로 관찰하기 위해 선정한 기후변화 100종에 포함되어 있다(Mi- nistry of Environment, 2010). 하지만 기후변화에 대한 영향을 알아볼 수 있는 생태모델링에 관한 연구는 진행되어 있지 못 한 상태이다.
종 분포모형은 1950년대 허치슨의 생태적 지위(Ecological niche)에 기반을 두고 발전된 모형으로 종의 출현은 지역의 서식지 환경에 영향을 받는 것을 전제로 하여 연구지역의 종 출현 가능성을 예측한다(Guisan and Zimmermann, 2000; Hut- chinson, 1957). 이러한 종 분포모형은 생태적 과정을 기반으로
한 과정기반모형(Process based model) (Kleidon and Mooney, 2000; Morin et al., 2007)과 통계기법을 이용한 상관모형(Co- rrelative model) (Guisan and Zimmermann, 2000), 그리고 종 의 분포와 환경변수와의 역학적 작용을 바탕으로 종의 분포를 예측하는 역학모형(Mechanistic model) (Kearney and Porter, 2009)으로 분류된다. 각각은 종의 출현자료와 환경변수를 입 력변수로 사용하여 종의 출현가능성을 예측하기 때문에 기후 변화에 따른 영향평가와 같은 연구에 다양하게 활용된다(Choi et al., 2015; Chun and Lee, 2013; Crossman et al., 2012; Koo et al., 2015; Park et al., 2014; Wang et al., 2016). 특히 통계 기법을 사용하는 상관모형은 GLM, GAM과 같은 회귀모형, RF, GBM과 같은 기계적 학습 등 다양한 알고리즘이 개발되 어 있다. 각 알고리즘은 각기 강조하는 점이 다르기 때문에 이 들의 불확실성을 확인하고, 보다 폭넓은 결과를 보여주기 위 하여 앙상블기법이 사용된다(Ahn et al., 2015; Buisson et al., 2010; Elith and Graham, 2009; Kwon, 2014; Thuiller, 2003;
Thuiller et al., 2009).
송악은 약재로 인간의 생활에 활용되는 약용식물이며, 기후 변화에 따른 생태계 변화를 관찰하기 위해 환경부에서 지정 한 기후변화 100종에 속하는 지표종이다(Ministry of Environ- ment, 2010). 하지만 기후변화에 따른 분포역 변화 예측과 같 은 기후변화 영향에 관한 연구는 아직 국내에서 미비한 실정 이다. 본 연구의 목적은 송악의 현재 분포를 통해 종 분포모 형에 따른 불확실성을 측정하고, 미래 기후변화에 따른 분포 변화를 예측하는 것이다. 이를 위해 9개의 종 분포모형 알고 리즘과 앙상블모형을 활용하여 종 분포모형을 구축하고, 기후 변화에 따른 분포변화를 예측하였다. 본 연구의 결과는 기후 변화 지표종으로 알려진 송악에 관한 기후변화 영향을 평가 함으로써 기후변화에 따른 송악의 미래 서식지 변화 예측에 대한 기초자료를 제공할 것이다. 이와 더불어 본 연구결과는 난대성 상록활엽수림 전체의 분포 변화에 관한 연구에 기초 자료로 활용될 수 있을 것이다.
2. 연구방법 및 자료
2.1 연구종 및 연구지역
송악(Hedera rhombea(Miq.) Siebold & Zucc. Ex Bean)은 두릅나무과의 난대성 상록활엽수로 주로 남해와 서해의 도서 및 해안지역 저지대에 분포한다. 음성식물로 그늘진 숲 속에서 잘 자라며, 생활형은 덩굴성으로 내한성은 강하지 않지만, 중 부해안지역에서 월동이 가능하다(Lee, 1980). 전북 고창의 삼
인리 선운사 입구의 절벽에 위치한 자생지는 내륙북한계지와 가까우며, 노거수인 점에서 천연기념물로 보호 및 관리되고 있 다. 종 분포모델에 사용된 분포자료에서 북한계지는 충남 태안 군의 북격렬비도와 우배도로 나타났다. 송악은 1933년 식생조 사를 통해서 발표된 난대성 상록활엽수 북한계선에 포함되어 있으며, 2009년에 식물표본을 통해 북한계지가 북상한 것으로 확인되었다(Ministry of Environment, 2010; Uyeki, 1941; Yun et al., 2014).
연구지역은 북위 33∼38°, 동경 126∼133°에 위치한 한반도 와 부속도서로 전체면적의 70% 정도가 산림으로 분류된다.
남북으로 길게 뻗은 한반도는 동고서저의 지형적 특징과 함께 해안선이 단조로운 동해안과 복잡한 서해안과 남해안이 비교 되며, 3,400여 개의 부속도서 대부분이 복잡한 해안선을 가지 는 서해안과 남해안에 위치한다. 동일 위도에서 서해안과 동 해안의 기온은 한반도 주변 해류의 영향으로 동해안이 상대적 으로 높게 나타난다(National Geographic Information Institute, 2014). 그렇기 때문에 동해안에 난대성 상록활엽수의 북한계 선이 위치할 것으로 생각되나, 대부분의 북한계선은 서해안 도 서 및 해안에서 나타난다.
2.2 환경변수들
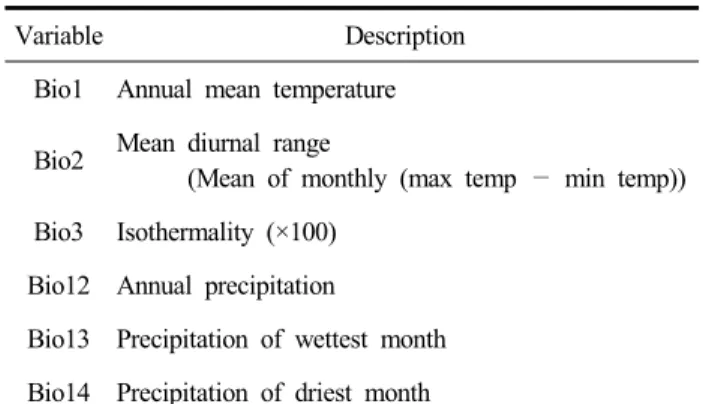
기온과 강수는 식물의 생장에 지배적인 영향을 미치는 기 후요소들로 식물들의 생태적 지위모형(Ecological niche model) 연구에서 중요한 인자들로 고려되어 왔다(Guisan and Zimmer- mann, 2000). 생물기후적 변수들(Bioclimatic Variables, Bio- clim)은 생물의 분포와 성장에 영향을 주는 기후요소들로 이루 어진 19개의 변수로 생물의 분포와 기후요소와의 상관관계를 찾는 연구에서 자주 사용되었다. 본 연구에서는 worldclim에서 제공하는 30-Arc Second(ca. 1 km2) 해상도의 1950∼2000년 기후자료를 통해 생성된 Bioclim 변수를 사용하였다. 19개의 Bioclim 변수들은 각각 상관관계를 가지기 때문에 Pearson’s r correlation을 통해 상관계수가 0.7보다 높은 변수를 제외하 고, 식물의 생장과 서식지 적합도를 설명하는 동시에 다른 변 수들을 대표할 수 있는 기온변수 Bioclim 1∼3과 강수변수인 Bioclim 12∼14를 사용하였다(Table 1) (Koo et al., 2015).
미래 기후변화 예측에서는 미래에 온실가스 절감 정책이 상 당부분 실현되는 RCP(Representative Concentration Pathways) 4.5 시나리오와 현재 온실가스 배출 추세가 계속되는 RCP 8.5 를 선택하였다. 전지구 기후모델(Global Climate Model; GCM) 은 한반도와 유사한 환경을 가지며, 다양한 선행연구에서 사 용된 영국 헤들리 연구소의 HadGEM2-AO(the Fully-coupled atmosphere-ocean version of the Hadley Centre Global Envi-
Table 1. Variables for species distribution model
Variable Description
Bio1 Annual mean temperature Bio2 Mean diurnal range
(Mean of monthly (max temp — min temp)) Bio3 Isothermality (×100)
Bio12 Annual precipitation
Bio13 Precipitation of wettest month Bio14 Precipitation of driest month
ronment Model 2)를 사용하여 예측된 2050년(2040∼2060년) 기후 자료를 사용하였다(Collins et al., 2008; Korea Meteoro- logical Administration, 2012).
2.3 모형개발 및 검증
종 분포모형의 개발에 필요한 송악의 출현/비출현 자료는 Koo(2000), Lee and Yim(2002), 국립수목원의 한반도 관속식 물 분포도(2004; 2005; 2006; 2007; 2008; 2009; 2010a; 2010b;
2011)에 수록된 분포자료를 사용하였다. 식물조사 지점이 동 일하거나 인접한 지점은 통합하여 736개의 식물분포자료를 사 용하였다. 각 지점에 대한 조사 자료들은 조사지역의 서식하는 식물들을 모두 기록한 것으로, 송악이 나타나지 않은 조사지점 은 비출현 자료로 활용하였다.
종 분포모형의 개발을 위해서 736개의 분포지점의 bioclim 1∼3, 12∼14 자료와 종의 출현/비출현 자료는 70대30의 비율 로 훈련자료(training data)와 시험자료(test data)로 나누었다.
훈련자료는 종 분포모형의 개발에 사용되었으며, 시험자료는 종 분포모형의 검증에 사용되었다. 종 분포모형의 개발과 검증 에 사용되는 분포자료는 각각 무작위로 분할되었으며, 분할과 정에서 발생할 수 있는 편향성을 최소화하기 위해 50회 반복 수행하였다. 종 분포모형 개발에는 9개의 종 분포모형 알고리 즘(Generalized Linear Models(GLM), Generalized Boosted Mo- dels(GBM), Generalized Additive Models(GAM), Classification Tree Analysis(CTA), Artificial Neural Networks(ANN), Surface Range Envelope (SRE), Flexible Discriminant Analysis(FDA), Multivariate Adaptive Regression Splines(MARS), Random Fo- rest(RF))을 적용하였고, 각 알고리즘의 종 분포모형 결과는 앙 상블 모형을 개발하는데 사용되었다(Thuiller et al., 2009). 다 양한 알고리즘이 앙상블 모형 개발에 사용되고 있으며, 그 중 가중치를 사용한 앙상블 방법이 모형 정확도가 가장 높은 것
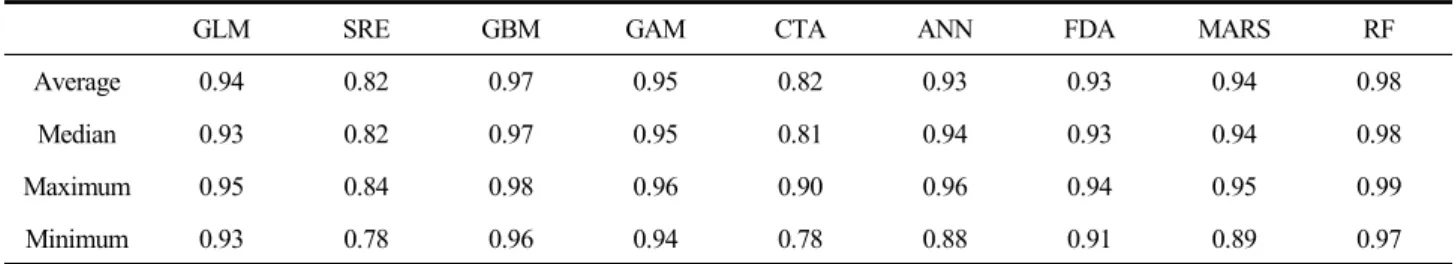
Table 2. AUC values for SDMs
GLM SRE GBM GAM CTA ANN FDA MARS RF
Average 0.94 0.82 0.97 0.95 0.82 0.93 0.93 0.94 0.98
Median 0.93 0.82 0.97 0.95 0.81 0.94 0.93 0.94 0.98
Maximum 0.95 0.84 0.98 0.96 0.90 0.96 0.94 0.95 0.99
Minimum 0.93 0.78 0.96 0.94 0.78 0.88 0.91 0.89 0.97
Table 3. TSS values for SDMs
GLM SRE GBM GAM CTA ANN FDA MARS RF
Average 0.75 0.64 0.82 0.79 0.63 0.77 0.74 0.74 0.85
Median 0.76 0.65 0.83 0.80 0.62 0.77 0.75 0.75 0.86
Maximum 0.81 0.68 0.87 0.82 0.73 0.83 0.78 0.80 0.91
Minimum 0.70 0.57 0.75 0.72 0.57 0.65 0.64 0.65 0.77
으로 보고되었다(Marmion et al., 2009). 이에 따라, 앙상블 모 형은 9개의 개별 종 분포모형 결과를 True Skill Statistics (TSS)값으로 가중치를 주어 구현되었으며, 각 개별 모형과 앙 상블 모형은 R 패키지인 Biomod2를 사용하여 구축되었다 (Thuiller et al., 2009).
잠재서식지는 종의 출현에 적합한 환경 조건을 바탕으로 예 측된 종의 분포 가능 지역을 의미한다. 연구지역에서 종의 출 현 가능성은 확률로 나타나기 때문에, 종의 서식지 변화 예측 을 위해서 종의 출현 여부를 결정짓는 임계점 설정은 매우 중 요하다. 이를 위해 모형에 의해 예측된 종의 출현이 실제 관 찰과 얼마나 일치하는지를 보여주는 Sensitivity(출현율 예측 정확도)와 모형에 의해 예측된 종의 비출현이 실제 관찰과의 일치를 나타내는 specificity(비출현율 예측 정확도)에 의해 산 출되는 TSS 값이 최대가 되는 지점을 임계점으로 설정하였다 (Ruete and Leynaud, 2015). 모형 예측 정확도는 ROC 분석 (Receiver operating characteristic analysis)의 AUC(Area under the curve) 값과 TSS 값을 사용하였다(Landis and Koch, 1977;
Pearson, 2010). AUC 값은 종의 출현과 비출현 자료에 대한 비 율에 영향을 받지 않으며, 출현과 비출현에 대한 정확도가 모 두 포함되어 있기 때문에 종 분포모형의 검증에 많이 사용된 다(Lobo et al., 2008). 하지만 대상종이 광범위하게 분포하는 경우, AUC 값이 낮게 나타나며, 국지적으로 한정된 곳에 분 포하는 경우, AUC 값이 높게 계산된다(Lobo et al., 2008). 이 러한 단점을 보안하기 위해 TSS 값을 모형 검증에 사용한다.
TSS 값은 AUC 값과 마찬가지로 출현과 비출현에 대한 정확
도가 모두 포함되어 있으며 출현과 비출현자료의 비율과 자료 분포의 면적 또는 형태에 영향을 거의 받지 않아 검증 결과의 신뢰도가 높은 것으로 보고되었다(Allouche et al., 2006).
3. 연구 결과 및 고찰
3.1 송악의 잠재서식지 분포 예측과 모형 불확실성 개별 종 분포모형의 불확실성을 분석하기 위해 9개의 개별 모형에 따른 현재 기후에서 송악의 잠재서식지가 예측되었다.
교차검증을 위한 자료 분할 과정에서 발생할 수 있는 불확실 성을 최소화하기 위하여, 분활 과정을 50회 반복 수행하였고, 이를 통해 각 모형에 따라 50개의 종 분포모형이 구축되었다.
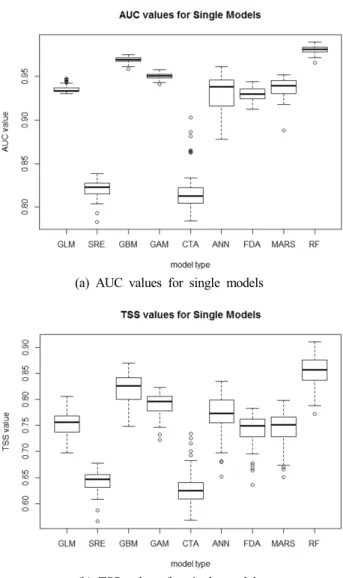
각 모형의 불확실성을 살펴보기 위해 50번씩 반복 수행된 결 과의 AUC 값과 TSS 값의 평균, 중앙 및 최소, 최대값들을 산 출하였다(Table 2 and Table 3). 50회 반복 수행한 AUC 값의 평균에서 SRE와 CTA는 0.82로 상대적으로 낮은 값을 보였 으며, 나머지 7개의 개별 모형들은 모두 0.9 이상의 높은 정확 도를 보였다. TSS 값의 평균에서도 AUC 값과 비슷한 양상을 보였다. SRE와 CTA를 제외한 7개의 개별 모형들이 0.7 이상 의 높은 모형 정확도를 보였다. 9개의 개별 모형의 AUC 값과 TSS 값의 평균들을 종합해 보면 SRE와 CTA는 다른 모형보다 낮은 모형예측력을 보였으며, GBM과 RF는 높은 예측력을 가 지는 것으로 나타났다(Fig. 1).
송악의 종 분포모형에서 RF, GBM과 같은 기계적 학습 알 고리즘이 다른 회귀, 의사결정나무 등의 다른 알고리즘에 비해
(a) AUC values for single models
(b) TSS values for single models Fig. 1. Boxplots for AUC and TSS values.
예측의 정확도가 높은 것으로 나타났으며, 다른 연구들에서도 유사한 결과들이 발표되었다. 특산 식물인 히어리(Corylopsis coreana)를 대상으로 종 분포모형의 불확실성을 연구한 다른 연구에도 RF, GBM, Maxent(Maximum entropy)와 같은 기계 적 학습 알고리즘이 다른 알고리즘에 비해 높은 정확도를 보 이는 것으로 나타났다(Kwon, 2014). 연구종들의 분포 특성에 따라 변동이 있을 수 있지만, 한반도 또는 남한과 같은 지역적 범위에서 종 분포모형은 기계적 학습 알고리즘이 다른 알고리 즘보다 정확도가 높을 것으로 판단된다. 그러나 지역적 범위가 바뀌거나, 분포형태가 특수한 종의 경우 각각의 상황에 맞는 알고리즘을 선택되어야 할 것이다.
종 분포모형을 통한 송악의 잠재서식지 예측에서 개별 종 분포모형의 불확실성을 최소화하기 위해 앙상블모형을 구축
하였다(Fig. 2). 앙상블 모형은 450개의 개별 종 분포모형에서 TSS 값이 0.7보다 높은 335개 모형을 대상으로 TSS 값 가중치 를 적용하여 구축되었다(Fig. 2). 앙상블모형의 정확도를 나타 내는 AUC 값과 TSS 값은 0.96과 0.84로 개별 모형의 정확도 와 비교해서 RF를 제외한 다른 모형보다 우수한 것으로 나타 났다. RF 모형의 TSS 평균값은 앙상블모형의 TSS 값보다 0.01 높게 나타났다. 그러나 RF 모형은 서해안 도서지역과 영남내 륙지역에서 현재 잠재서식지를 부정확하게 예측한 반면, 앙상 블모형은 영동지역을 제외한 서해안과 영남내륙지역에서 송악 분포를 잘 설명하였다. 송악의 잠재서식지는 현재 분포자료에 서 출현지점과 차이를 보였는데, 특히 동해안 지역에서 그 차 이가 두드러지게 나타났다. 동해안은 서해안에 비해 상대적으 로 높은 온도와 강수조건을 보여 북위 38.5°까지 송악의 분포 가 가능할 것으로 예측되었지만, 출현지점은 울릉도와 울산 목 도로 잠재서식지와 출현지점과는 많은 거리적 차이를 보였다.
Fig. 2. Potential habitat of Hedera rhombea in current climate (1950∼2000).
(a) RCP 4.5 (b) RCP 8.5 Fig. 3. Potential habitat of Hedera rhombea in future climate (2040∼2060).
앙상블모형에서 동해안지역은 출현분포자료가 없음에도 잠 재서식지로 예측되었다. 이는 동해안지역이 동해로 흐르는 난 류의 영향으로 동일 위도의 내륙과 서해안 지역에 비해 높은 기온을 보이며, 태백산맥과 같은 지형적 인자에 의해 다른 지 역보다 강수조건이 적합하기 때문이다. 하지만 실제 분포자료 에서는 서해안이 동해안보다 북한계지가 높게 나타나는데, 이 는 동해안지역의 지형적으로 협소한 공간과 난대성 상록활엽 수의 수분매개체의 역할을 하는 조류의 서식지 부재를 원인 으로 볼 수 있다(Choi et al., 2010).
3.2 기후변화에 따른 송악의 잠재서식지 분포 변화 TSS 가중치 앙상블모형을 사용하여 기후변화에 따른 미래 잠재서식지 변화를 예측하였다. 이를 위해 미래기후요소 예측 은 영국 헤들리 연구소에서 개발된 HadGEM2-AO에서 RCP 4.5와 8.5 미래기후 시나리오를 사용하였다. 예측 결과, 송악 의 미래 잠재서식지는 모두 증가하는 것으로 나타났다(Fig. 3).
이러한 미래예측은 RCP 시나리오에 따라 확장 폭과 형태가 다르게 예측되었다. 서해안의 경우, 모든 시나리오에서 북한계 선이 북위 38.5°인 황해도 해안지역까지 북상하였다. 하지만 동해안과 남부 내륙지역은 시나리오에 따라 확장 추세가 다르 게 나타났다. 동해안의 경우, RCP 8.5는 북위 39°인 함경남도 원산까지, RCP 4.5는 강원도 고성까지 확장하였다. 남부 내륙 에서 RCP 4.5의 잠재서식지는 전라도 내륙으로 확장하는데 그쳤지만, RCP 8.5는 충청남도 내륙까지 잠재서식지가 증가하 는 것으로 예측되었다.
한반도 남부 해안에 주로 분포하던 송악의 잠재서식지가 기 후변화에 따라 상승하는 것으로 예측된 것은 기온과 강수량의 증가에 의한 것으로 판단된다. 기온에서는 연평균기온과 더불 어 최한월기온의 상승에 따른 연교차의 감소가 송악의 잠재 서식지 북상에 영향을 주었으며, 강수량에서는 연강수량의 증 가가 주요한 요인으로 분석된다. 미래예측에 있어서 동해안은 현재보다 북위 0.5∼1.0°까지 북상하는 것으로 예측되었지만,
지형적 요인에 따른 공간적 협소함과 수분매개체 역할을 하 는 철새 및 조류의 서식지 부족 등 생태적 요인을 고려했을 때, 잠재서식지만큼 북상하기 힘들 것으로 판단된다. 서해안의 경 우, 지형적 요인과 생태적 조건이 적합하지만, 기후변화에 따 른 해수면 상승은 난대성 상록활엽수의 주요 서식지인 해안 지역의 감소를 초래하여 분포지 증가에 부정적 영향을 줄 것 으로 예상된다. 그러므로 송악의 미래 분포를 좀 더 정확하게 예측하기 위해서는 수분매개체, 지형적 요인, 기후변화에 따 른 해수면 상승과 같은 여러 인자들이 고려되어야 할 것이다.
이를 위해 이러한 인자들을 설명하는 모형들을 종 분포모형 에 연결하는 연구가 진행되어야 할 것으로 판단된다. 이러한 한계에도 불구하고, 본 연구의 결과는 기후변화에 따른 송악 서식지 변화에 관한 미래 연구들의 기초자료로 활용될 수 있 을 것이다.
4. 결 론
본 연구에서는 한반도 남부 해안지역에 주로 분포하는 송악 을 대상으로 기후변화에 따른 잠재서식지 분포 변화를 예측하 였다. 이를 위해, 9개의 개별 모형을 적용한 종 분포모형들이 구축되었고, 이 개별 모형들의 결과는 TSS 가중치를 적용하여 앙상블하였다. 앙상블 모형을 적용한 결과, 송악은 현재 기후 조건에서 서해와 남해 및 동해의 해안지역과 도서지역에 주로 분포하는 것으로 예측되었다. 특히, 동해안의 북한계선이 서해 안보다 고위도까지 나타나는 것으로 예측되었는데, 실제 분포 의 북한계지는 경남 울산으로 예측치와 차이를 보였다. 송악 의 잠재서식지는 기후변화에 따라 현재보다 모두 확장하지만, 시나리오에 따라 확장 추세가 다르게 나타났다. RCP 4.5와 8.5 모두 동해안에서 0.5∼1.0°, 서해안에서 2.0∼2.2° 북상하였고, 남해내륙으로 확장되었다. 동해안의 경우, 현재와 비교해서 지 형적 요인과 생태적 조건에 의해 실제 분포지는 확장되지 못 할 것으로 예측되지만, 서해안의 경우 다른 조건이 적합하여 잠재서식지가 북상할 수 있을 것으로 예측된다. 그러나 기후 변화에 따른 해수면 상승은 해안에 주로 서식하는 난대성 상 록활엽수의 서식지에 악영향을 줄 것으로 예측된다. 본 연구 결과는 기후변화에 따른 송악의 잠재서식지 분포변화를 예측 함으로써 미래 송악의 서식지 변화를 이해하는데 기초자료로 활용될 수 있을 것이다.
5. 사 사
본 연구는 환경부와 한국환경산업기술원 “2014001310009
(기후변화대응 환경기술개발사업)”의 지원으로 수행되었습 니다.
REFERENCES
Ahn Y, Lee D, Kim HG, Park C, Kim J, Kim J. 2015. Esti- mating Korean pine(Pinus koraiensis) habitat distribution considering climate change uncertainty using species distri- bution models and RCP scenarios (in Korean with English abstract). Journal of the Korea Society of Environmental Restoration Technology 18(3):5164.
Allouche O, Tsoar A, Kadmon R. 2006. Assessing the accu- racy of species distribution models: Prevalence, kappa and the true skill statistic (TSS). J Appl Ecol 43(6):1223-1232.
Buisson L, Thuiller W, Casajus N, Lek S, Grenouillet G.
2010. Uncertainty in ensemble forecasting of species dis- tribution. Global Change Biol 16(4):1145-1157.
Choi C, Nam H, Chae H. 2010. Exotic seeds on the feathers of migratory birds on a stopover island in Korea. Journal of Ecology and Environment 33(1):1922.
Choi CH, Jung SG. 2014. Analysis of the MODISbased vege- tation phenology using the HANTS algorithm (in Korean with English abstract). Journal of the Korean Association of Geographic Information Studies 17(3):2038.
Choi J, Lee S, Lee S. 2015. Anticipation of the future suitable cultivation areas for Korean pines in Korean peninsula with climate change (in Korean with English abstract). Journal of the Korea Society of Environmental Restoration Tech- nology 18(1):103-113.
Chun JH, Lee C. 2013. Assessing the effects of climate change on the geographic distribution of Pinus densiflora in Ko- rea using ecological niche model (in Korean with English abstract). Korean Journal of Agricultural and Forest Me- teorology 15(4):219-233.
Collins W, Bellouin N, Doutriaux Boucher M, 2008, Evalu- ation of the hadGEM2 model. Hadley Cent Tech Note 74, Met Office, Exeter, UK, available http://www.metoffice.
gov.uk/publications/HCTN/index. html
Crossman ND, Bryan BA, Summers DM. 2012. Identifying priority areas for reducing species vulnerability to climate change. Divers Distrib 18(1):6072.
Diaz S, Demissew S, Carabias J, Joly C, Lonsdale M, Ash
N, Larigauderie A, Adhikari JR, Arico S, ldi AB. 2015, The IPBES conceptual framework-connecting nature and people. Current Opinion in Eenvironmental Sustainability 14:116.
Diaz Varela RA, Colombo R, Meroni M, CalvoIglesias MS, Buffoni A, Tagliaferri A. 2010. Spatiotemporal analysis of alpine ecotones: A spatial explicit model targeting altitu- dinal vegetation shifts. Ecol Model 221(4):621-633.
Dullinger S, Gattringer A, Thuiller W, Moser D, Zimmer- mann NE, Guisan A, Willner W, Plutzar C, Leitner M, Mang T. 2012. Extinction debt of highmountain plants under twentyfirstcentury climate change. Nature Climate Change 2(8):619-622.
Elith J, Graham CH. 2009. Do they? How do they? WHY do they differ? On finding reasons for differing perfor- mances of species distribution models. Ecography 32(1):
66-77.
Feeley KJ, Malhi Y, Zelazowski P, Silman MR. 2012. The relative importance of deforestation, precipitation change, and temperature sensitivity in determining the future distri- butions and diversity of Amazonian plant species. Global Change Biol 18(8):2636-2647.
Feeley KJ, Silman MR, Bush MB, Farfan W, Cabrera KG, Malhi Y, Meir P, Revilla NS, Quisiyupanqui MNR, Saat- chi S. 2011. Upslope migration of Andean trees. J Bio- geogr 38(4):783-791.
Guisan A, Zimmermann NE. 2000. Predictive habitat distri- bution models in ecology. Ecol Model 135(2):147-186.
Hutchinson GE. 1957. Cold spring harbor symposium on quantitative biology. Concluding Remarks 22:415-427.
IPCC. 2014. Climate change 2014: Synthesis report. Contribu- tion of Working Groups I, II and III to the Fifth Assess- ment Report of the Intergovernmental Panel on Climate Change [Core Writing Team, R.K. Pachauri and L.A.
Meyer (eds.)]. IPCC, Geneva, Switzerland, pp 151.
Ju JH, Bang KJ. 2008. Effects of artificial light sources and light intensities in subway stations on the growth of He- dera rhombea and Saxifraga stolonifera (in Korean with English abstract). Journal of the Korea Society of Envi- ronmental Restoration Technology 11(6):73-80.
Jung M, Shim K, Kim Y, Choi I. 2015. Change of climatic growing season in Korea (in Korean with English abst-
ract). Korean Journal of Environmental Agriculture 34(3):
192-195.
Kearney M, Porter W. 2009. Mechanistic niche modelling:
Combining physiological and spatial data to predict spe- cies’ ranges. Ecol Lett 12(4):334-350.
Kim HR, Yon YH. 2010. Effects of elevated CO2 concentra- tion and temperature on the response of seed germination, phenology and leaf morphology of Phytolacca insularis (Endemic species) and Phytolacca americana(Alien species) (in Korean with English abstract). Korean Journal of En- vironment and Ecology 24(1):62-68.
Kim JH. 2010. A studies on the distribution of Hedera rhom- bea (Miq.) bean in the Korean peninsula and its biological activities. Dissertation(in Korean with English abstract), Jeju National University.
Kim K. 1997. Studies on components and biological acti- vities of Hedera rhombea Bean. Dissertation(in Korean with English abstract), Ewha Womans University.
Kleidon A, Mooney HA. 2000. A global distribution of bio- diversity inferred from climatic constraints: Results from a process based modelling study. Global Change Biol 6 (5):507-523.
Kong W. 2005. Selection of velnerable indicator plants by global warming (in Korean with English abstract). Asia Pacific Journal of Atmospheric Sciences 41(2):263-273.
Kong W. 1999. The vertical distribution on air temperature and thermal amplitude of alpine plants on Mt. Halla, Cheju Island, Korea (in Korean with English abstract).
Journal of Korean Geographical Society 34(4):385-393.
Koo KA. 2000. Distribution of evergreen broadleaved trees and climatic factors. Dissertation(in Korean with English abstract), KyungHee University.
Koo KA, Kong W, Nibbelink NP, Hopkinson CS, Lee JH.
2015. Potential effects of climate change on the distribu- tion of cold tolerant evergreen broadleaved woody plants in the Korean peninsula. PloS one 10(8).
Koo KA, Park WK, Kong W. 2001. Dendrochronological ana- lysis of Abies koreana W. at Mt. Halla, Korea: Effects of climate change on the growths (in Korean with English abstract). Korean J Ecol 24(5):281-288.
Korea Meteorological Administration. 2012. The Korean pe- ninsula climate change outlook report.
Korea National Arboretum. 2004. Distribution maps of vas- cular plants of Korean peninsula I. South coast province.
Korea National Arboretum, Pocheon.
Korea National Arboretum. 2005. Distribution maps of vas- cular plants of Korean peninsula II. South province (Jeolla- do & Jirisan). Korea National Arboretum, Pocheon.
Korea National Arboretum. 2006. Distribution maps of vas- cular plants of Korean peninsula III. Central & South province (Chungcheong-do). Korea National Arboretum, Pocheon.
Korea National Arboretum. 2007. Distribution maps of vas- cular plants of Korean peninsula IV. Central & south province (Gyeongsangbuk-do). Korea National Arboretum, Pocheon.
Korea National Arboretum. 2008. Distribution maps of vas- cular plants of Korean peninsula V. Central province (Geonggi-do). Korea National Arboretum, Pocheon.
Korea National Arboretum. 2009. Distribution maps of vas- cular plants of Korean peninsula VI. Central province (Gangwon-do). Korea National Arboretum, Pocheon.
Korea National Arboretum. 2010a. Distribution maps of vas- cular plants of Korean peninsula VII. South province (Gyeongsangnam-do) and Ulleung-do province. Korea Na- tional Arboretum, Pocheon.
Korea National Arboretum. 2010b. Distribution maps of vas- cular plants of Korean peninsula VIII. Jeju-do province.
Korea National Arboretum, Pocheon.
Korea National Arboretum. 2011. Distribution maps of vas- cular plants of Korean peninsula IX. West & South coast province. Korea National Arboretum, Pocheon.
Kwon HS. 2014. Applying ensemble model for identifying uncertainty in the species distribution models (in Korean with English abstract). Journal of the Korean Society for Geospatial Information System 22(4):47-52.
Landis JR, Koch GG. 1977. The measurement of observer agreement for categorical data. Biometrics pp 159-174.
Lee TB. 1980. Flora of Korea. Hyangmunsa, Seoul.
Lee WC, Yim Y. 2002. Plant geography with special reference to Korea. Kangwon National University Press, Chuncheon.
Lobo JM, Nez Valverde AJ, Real R. 2008. AUC: A mislea- ding measure of the performance of predictive distribution models. Global Ecol Biogeogr 17(2):145-151.
Marmion M, Parviainen M, Luoto M, Heikkinen RK, Thuiller W. 2009. Evaluation of consensus methods in predictive species distribution modelling. Divers Distrib 15(1):59-69.
Ministry of Environment. 2010. 100 Climatesensitive biolo- gical indicator species.
Morin X, Augspurger C, Chuine I. 2007. Processnased mo- deling of species’ distributions: What limits temperate tree species’ range boundaries? Ecology 88(9):2280-2291.
National Geographic Information Institute. 2014. The national atlas of Korea 1st Edition. Human Culture Arirang, Suwon.
National Institute of Forest Science. 2009. The Korea report for sustatinable forest management.
National Institute of Meteorological Sciences. 2012. Global climate change report for response the fifth assessment report of the intergovernmental panel on climate change 2012 predict according to RCP 2.6/4.5/6.0/8.5.
Park HC, Lee JH, Lee GG. 2014. Predicting the suitable ha- bitat of the Pinus pumila under climate change (in Korean with English abstract). Journal of Environmental Impact Assessment 23(5):380-393.
Pearson RG. 2010. Species’ distribution modeling for conser- vation educators and practitioners. Lessons in Conservation 3:54-89.
Randin CF, Engler R, Normand S, Zappa M, Zimmermann NE, Pearman PB, Vittoz P, Thuiller W, Guisan A. 2009.
Climate change and plant distribution: Local models pre- dict high elevation persistence. Global Change Biol 15(6):
1557-1569.
Ruete A, Leynaud GC. 2015. Goaloriented evaluation of species distribution models’ accuracy and precision: True skill statistic profile and uncertainty maps. Peer J Pre Prints (3).
Thuiller W. 2003. Biomod-optimizing predictions of species distributions and projecting potential future shifts under global change. Global Change Biol 9(10):1353-1362.
Thuiller W, Lafourcade B, Engler R, Ara Jo MB. 2009. Bio- mod-a platform for ensemble forecasting of species dis- tributions. Ecography 32(3):369-373.
Uyeki H. 1941. Northern distribution limit of Korean ever- green broadleaved trees. Acta Phytotax Geobot 10:89-93.
Wang T, Wang G, Innes J, Nitschke C, Kang H. 2016. Cli- matic niche models and their consensus projections for
future climates for four major forest tree species in the Asia-Pacific region. For Ecol Manage 360:357-366.
Yun J, Nakao K, Tsuyama I, Higa M, Matsui T, Park C, Lee B, Tanaka N. 2014. Does future climate change facilitate expansion of evergreen broadleaved tree species in the humandisturbed lasndscape of the Korean peninsula? Im- plication for monitoring design of the impact assessment.
Journal of Forest Research 19(1):174-183.
Zimmermann NE, Jandl R, Hanewinkel M, Kunstler G, Klling C, Gasparini P, Breznikar A, Meier ES, Normand S, Ulmer U. 2013. Potential future ranges of tree species in the Alps. in Management Strategies to Adapt Alpine Space Forests to Climate Change Risks, In Tech pp 37-48.