기후변화에 따른 한반도 후박나무의 잠재 생육지 및 변화예측 1a
윤종학2*․中 尾 勝 洋3․박찬호2․이병윤2
Potential Habitats and Change Prediction of Machilus thunbergii Siebold & Zucc.
in Korea by Climate Change
1aJong-Hak Yun
2*, Katsuhiro Nakao
3, Chan-Ho Park
2, Byoung-Yoon Lee
2요 약
본 연구는 기후변화에 따른 한반도 후박나무의 분포를 규정하는 기후요인과 현재기후와 미래기후에서의 잠재 생육지 를 CT모델을 이용하여 예측하였다. 모델 구축을 위한 4개 독립변수로는 최한월최저기온(TMC), 온량지수(WI), 하계강 수량(PRS), 동계강수량(PRW)을 사용하였다. CT분석을 통해 구축된 후박나무 분포 모델(Mth-model)에서 TMC(최한 월최저기온)가 분포를 규정하는 주요요인으로 작용하였으며, TMC(최한월최저기온) -3.3℃이상인 지역에서 후박나무 의 높은 출현확률을 나타냈다. 현재기후에서 한반도 후박나무의 잠재 생육지(PH)는 9,326km²로 예측되었으며, 3종류 미래기후 시나리오(CCCMA-A2, CSIRO-A2, HADCM3-A2)에서 61,074~67,402km²(남한: 58,419~61,137km², 북한:
2,655~6,542km²)로 예측되었다. 미래기후에서 잠재 생육지는 49~51%(남한: 49~51%, 북한: 2~5%) 증가된 면적이 예측되었다. 기후변화에 따라 한반도 후박나무의 잠재 생육지의 확대는 난온대 낙엽활엽수림과 경쟁이 예상된다. 후박 나무는 한반도 기후변화 지표종으로 유효하다고 판단되며 잠재 생육지에 대한 지속적인 모니터링이 중요하다.
주요어: CT모델, 지표종, 분포
1 접수 2011년 10월 17일, 수정(1차: 2011년 11월 21일, 2차: 2011년 11월 30일), 게재확정 2011년 12월 1일
Received 17 October 2011; Revised(1st: 21 November 2011, 2nd: 30 November 2011); Accepted 1 December 2011 2 국립생물자원관 식물자원과 Plant Resources Division, National Institute of Biological Resource, Incheon(404-708), Korea.
3 일본 산림총합연구소 식물 생태학 연구실 Department of Plant Ecology, Forestry and Forest Products Research Institute, Tsukuba, Ibaraki(305-8687), Japan.
a 이 논문은 2011년도 환경부 기후변화 적응 생물 다양성 관리 연구 조성비에 의하여 연구되었음.
* 교신저자 Corresponding author([email protected])
ABSTRACT
The research was carried out in order to find climate factors which determine the distribution of Machilus
thunbergii, and the potential habitats under the current climate and three climate change scenario by using
classification tree (CT) model. Four climate factors; the minimum temperature of the coldest month (TMC), the warmth index (WI), summer precipitation (PRS), and winter precipition (PRW) : were used as independent variables for the model. The model of distribution for Machilus thunbergii (Mth-model) constructed by CT analysis showed that minimum temperature of the coldest month (TMC) is a major climate factor in determining the distribution of M. thunbergii. The area above the -3.3℃ of TMC revealed high occurrence probability of the M. thunbergii. Potential habitats was predicted 9,326km² under the current climate and 61,074~67,402km²(South Korea: 58,419~61,137km², North Korea: 2,655~6,542km²) under the three climatechange scenarios (CCCMA-A2, CSIRO-A2, HADCM3-A2). The Potential habitats was to predicted increase by 51~56%(South Korea: 49~51%, North Korea: 2~5%) under the three climate change scenarios. The potential expand of M. thunbergii habitats has been expected that it is competitive with warm-temperate deciduous broadleaf forest. M. thunbergii is evaluated as the indicator of climate change in Korea and it is necessary for
M. thunbergii to monitor of potential habitats.
KEY WORDS: CLASSIFICATION TREE MODEL, INDICATOR, DISTRIBUTION
서 론
기후변화에 관한 정부간 협의체(IPCC: Intergovernmental Panel on Climate Change)의 제 4차 평가보고서에 의하면 21세기말 (2090~2099년)의 지구 평균기온은 1.8℃〜4.0℃
상승할 것으로 보고하였으며, 생태계 및 생물 생육지 변화 등에 영향을 미칠 것으로 예측하였다(IPCC, 2007). 기후변 화에 따른 산림 생태계의 영향 평가는 IPCC에서 중요한 과제 중의 하나로 대두되었으며(MaCarthy et al., 2001), 최근 기후조건에 의한 식물종의 분포를 예측하기 위해 통계 모델을 구축하여 생육지를 예측하는 연구가 진행되고 있다.
현재 기후조건에서 식물종이 분포하는 지역을 예측하는 통 계 모델을 구축함으로써 미래 기후조건에서 잠재적인 분포 확률을 공간적으로 예측할 수 있다. 또한, 기후변화에 따른 생육지의 면적 변화와 생육지를 특정 할 수 있다(Tsuyama
et al., 2008a; 2008b; Horikawa et al., 2009).
지구 온난화에 의한 식물 분포 예측 연구는 유럽과 미국 을 중심으로 활발히 연구(Huntley, 1991; Huntley et al., 1995; Iverson and Prasad, 1998; Iverson et al., 1999;
Harrison et al., 2001; Berry et al., 2003; Thuiller et al., 2005; Normand et al., 2007)가 진행되고 있다. 일본에서는 자연식생대에 대한 기후요인에 의한 잠재 생육지 예측 연구 (Tsunekawa et al., 1993; Nogami, 1994), Fagus crena (Matsui et al., 2004a, Matsui et al., 2004b), 눈잣나무 (Horikawa et al., 2009), 상록성 참나무류 2종(Nakao et
al., 2009), 상록성 침엽수 10종(Tanaka et al., 2009), 조릿
대류 2종(Tsuyama et al., 2008a; Tsuyama et al., 2008b) 등의 기후조건과 분포 예측에 관한 연구가 보고되었다. 한 국에서는 분포 예측 모델을 이용한 난온대 상록활엽수의 기후조건 및 생육지의 분포변화에 대한 연구(Yun et al., 2011a; 2011b)가 있으나, 기후변화에 따른 각 식물종에 대 한 분포를 규정하는 기후요인 및 분포 변화 예측 연구는 진행되고 있지 않다.현재 기후변화에 따른 급속한 기온상승은 한반도의 남부 해안 및 제주도, 울릉도 저지대에 분포하는 난온대 상록활
엽수림의 분포 확대에 영향을 미칠 것으로 예측되고 있으며 (Yun et al., 2011b), 난온대 상록활엽수림을 구성하는 주요 수종 중의 하나인 후박나무는 해안내륙으로 세력을 확대할 것으로 판단된다. 후박나무의 개체 및 개체군 분포에 대한 연구로는 Lee and Choi(2011), Yun et al.(2011a), Yun et
al.(2011b) 등이 있으며, 후박나무의 자생북한계지로 인천
시 대청도 고주동 남사면 해안절벽에 한 개체가 자생하며, 덕적군도(광대도, 하고도, 멍애섬)에 개체군이 생육하고 있 다(Lee and Choi, 2011). 후박나무는 기후변화에 따라 분포 를 확대하여 낙엽활엽수림을 구성하는 졸참나무 및 신갈나 무와의 세력 경쟁이 예상됨과 동시에 식생대를 구성하는 산림군락의 군락구조 변화에 영향을 미칠 것으로 판단된다.따라서, 후박나무의 분포를 규정하는 기후조건 및 잠재 생 육지를 밝히는 것은 한반도 산림 식생 분포 변화 및 자생지 의 보전 관리에 매우 중요하다.
본 연구는 후박나무를 대상으로 기후요인을 독립변수로 하는 통계모델을 구축하여 현재기후에서 후박나무의 분포 를 규정하는 기후조건을 정량적으로 밝히고, 현재기후 및 미래기후에서의 잠재 생육지를 예측하고자 하였다.
재료 및 방법
1. 연구 대상지
연구 대상지는 동아시아 지역의 북동쪽에 위치하며, 북위 33°~38°, 동경 126°~132°에 놓여 있는 한반도, 제주도, 울 릉도를 포함하는 지역을 대상으로 하였다. 지리적으로는 동 해를 사이에 두고 일본과 마주하여 위치하고 있으며, 황해 를 사이에 두고 중국과 마주하여 위치하고 있다. 한반도의 산지는 태백산맥을 중심으로 동쪽으로는 급경사를 이루고 서쪽으로는 완만하며, 남서쪽으로는 소백산맥이 이어져 있 다. 한반도 남서쪽에는 대표적인 도서지역으로 제주도가 위 치하며, 동해에는 울릉도가 위치하고 있다. 한반도의 기후 는 전반적으로 연교차가 큰 대륙성 기후의 지배를 받고 있 으며, 최근 한반도의 10년 평균기온 평년값은 13.7℃
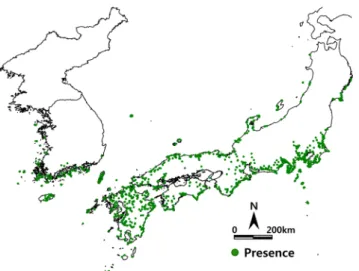
Figure 1. Actual distribution of Machilus thunbergii in Korea and Japan. The number of the presence of Machilus thunbergii was 2,050 records
Figure 2. Maps of four climatic variables under the current climate(1961-1990) and future climate scenarios, i.e., the CCCMA-A2, CSIRO-A2 scenario and HADCM3-A2 scenario of 2081-2001(Yun et al., 2011b). (A) WI:
Warmth index. (B) TMC: Mean minimum temperature of the coldest month. (C) PRS:
Summer(May-September) precipitation. (C) PRW: Winter(December-March) precipitation (1991~2000년), 제주도 14.4℃(1991-2000년), 울릉도 11.
8℃(1991~2000년)를 나타내고 있다(Yun et al., 2011a).
2. 식물분포 자료
식물분포 자료는 한반도에 분포하는 후박나무를 대상으로 조사되어 수장된 국립생물자원관(KB)의 식물 표본 자료에 서 채집 정보를 추출하여 이용하였다. 한반도 식물 분포 자료 만으로 난온대 상록활엽수의 식물종의 생육지를 예측할 경 우, 과소평가되어 축소되어 예측될 수 있으며, 이를 보정하기 위해서는 일본의 식물분포 자료를 추가하여 생육지 분포를 예측할 필요가 있다. 일본 식물분포 자료는 식물사회학적 조 사 자료를 근거하여 작성된 PRDB(Phytosociological Relevé Data Base)(Tanaka, 2007)를 이용하였다. 추출된 후박나무 위치정보 자료 2,050(한국 1,229; 일본 1,821)지점 대하여 한국과 일본 지역을 대상으로 약 1km²의 격자로 구분하여 후박나무의 실제 분포도를 작성하였다(Figure 1)
3. 기후자료
기후자료는 Worldclim-Global Climate Data(www.
worldclim.org)에서 제공하는 동아시아 지역의 한반도와 일 본의 기후값을 30 arc-seconds(〜1km) 격자에 대하여 추출 하여 식물 생육에 중요한 온량지수(WI: Warmth Index) (Kira, 1977), 최한월최저기온(TMC: Mean minimum temperature of the coldest month), 하계강수량(PRS:
Summer precipitation), 동계강수량(PRS: Summer precipitation)
의 4개 기후변수에 대한 30년(1961∼1990년) 평균 기후값 을 현재기후 자료(Current climate data)로 적용하였다. 온 량지수(WI)는 식물 생육기의 열량 지표이며, 동아시아 지 역의 광역적 식물분포를 해석함에 있어 중요한 요인이다 (Kira, 1977; Ohsawa, 1990). 최한월최저기온(TMC)은 동 계의 저온 극값 지표이며, 상록활엽수의 분포 제한요인이다 (Ohsawa, 1991; Ohsawa, 1993). 강수요인으로는 생육기의 수분공급 지표로서 5〜9월의 하계강수량(PRS: Summer precipitation), 동계의 건조정도 및 적설량의 지표로서 12〜
3월의 동계강수량(PRW: Winter precipitation)을 이용하였 다(Figure 2).
미래기후 자료는 2000년 IPCC(Intergovernmental Panel on Climate Change)의 배출 시나리오에 관한 특별보고서 (SRES: Special Report on Emissions Scenarios)에서 인정 하고 있는 전지구 기후모델(GCM: Global Climate Model)
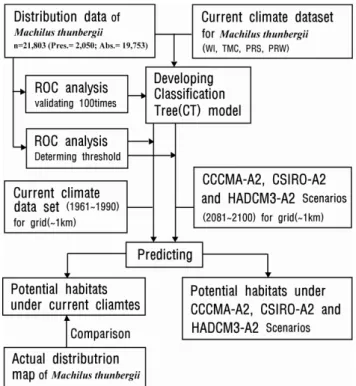
Figure 3. Flowchart of analysis 중 CCCMA(Canadian Centre for Climate Modelling and
Analysis), CSIRO(Commonwealth Scientifiec and Industrial Reserch Organisation), HADCM3(Hadley Centre Coupled Model, version3)의 A2(경제성장 및 지역주의 중심) 시나리 오에서 예측된 기후자료에서 20년(2081~2100)년 평균 기 후값을 적용하였다(Figure 2). GCM의 각 모델 상세내용으 로 CCCMA의 CO₂농도 Control run과 Transient run이 각각 295ppmv, 1%/yr, CO₂배증시 평형상태에 도달하는 지표면온도를 나타내는 기후감도(△T) 3.5℃, CSIRO는 330ppmv, 0.9%/yr, 4.3℃, HADCM3는 323ppmv, 1%/yr, 2.5℃이다(Takahashi et al., 2001).
한반도 지역에 대한 현재기후 30년(1961∼1990년) 평균 기후값은 WI 95.0, TMC -.7.7℃, PRS 955.6mm, PRW 157.9mm로 산출되었다. 또한, 미래기후 시나리오에 의한 한 반도 지역 평균 기후값(2081~2100년)은 CCCMA-A2에서 WI 126.8, TMC -2.6℃, PRS 1163.3mm, PRW 134.8mm, CSIRO-A2에서 WI 131.7, TMC -2.5℃, PRS 1093.0mm, PRW 148.8mm, HADCM3-A2에서 WI 133.4, TMC -2.3℃, PRS 1477.8mm, PRW 220.1mm로 예측되었다.
4. 통계해석
통계해석은 식물의 분포와 기후와의 관계를 해석하기 위 하여 자료를 최대한 균등하게 반복하여 자료(Data)가 무의미 할 때 까지 2분할되도록 구축되는 CT-model(Classification tree Model)을 이용하였다(Clark and Pregibon, 1992).
CT-model은 식물종의 분포 유/무(有/無)를 종속변수, 4개 기후값을 독립변수로 적용하여, 독립변수 간의 복잡한 상호 작용에 의한 모델 구축으로 식물 분포와 환경 경도와의 관 계를 해석하는데 이용되며 생태학적 해석이 상당히 용이하 다(De’Ath and Fabricius, 2000). CT-model의 구축시 교차 확인법(Clark and Pregibon, 1992)을 통하여 최적의 분리회 수를 확인하였다. 교차 확인법은 자료를 10개 그룹으로 나 누어 9개 그룹을 이용하여 모델을 구축하고 나머지 1개 그 룹으로 모델을 평가하여, 최적의 분리회수를 판정하는 것으 로 100회 반복하여 분리회수를 판정하였다. 기후변수에 대 한 분리 공헌도(DWS: Deviance weighted score)(Matsui
et al., 2004a)를 산출하여 모델 구축에 영향을 미치는 기후
요인을 확인하였다.구축된 모델의 예측정도(豫測精度)를 판정하기 위해 ROC(Receiver operating characteristic)해석(Metz, 1978;
Hanley and McNeil, 1982; Zweig and Campbell, 1993)에 의해 얻은 AUC(Area under the curve)값으로 평가하였다.
AUC값은 0.5이상, 1.0이하의 값으로 1.0에 근접 할수록 모 델구축이 적합하다고 판정된다. AUC의 평가기준은
0.9~1(excellent), 0.8∼0.9(good), 0.7∼0.8(fair), 0.6∼
0.7(poor), 0.5∼0.6(fail)으로 구분하였다(Swets, 1988;
Thuiller, 2003).
CT분석을 통해 구축된 모델에서 생육 적지(Suitable habitat)는 식물종의 생육에 적합한 환경을 갖는 지역으로 모델의 적합도가 최고점일 때 분포확률의 역치 이상인 지역 으로 판단하였다(Tsuyama et al., 2008a; 2008b). 생육 적지 의 역치는 모델의 예측정도 평가를 위한 ROC(Receiver operating characteristic)의 해석(Zweig and Campbelll, 1993)에서 감도(Sensitivity)와 특이도(Specificity)가 서로 1.0에 가까운 이상점(理想点)과 1.0과의 거리이며, 계산식 은 MinROC dis.= √[(1-Se)² + (1-Sp)²] 이다(Zweig and Campbell, 1993; Yun et al., 2011b). 잠재 생육지(PH:
Potential habitat)는 95%의 감도(Sensitivity)일 경우 정의 되어지는 출현확률을 역치로 적용하였다(Tsuyama et al., 2011b). 또한, 생육 적지의 역치(閾値)보다는 낮고 잠재 생 육지의 분포확률 보다는 높은 지역으로 식물종의 생육에 그다지 적합하지 않은 환경을 갖는 지역을 분포 변록지 (MH: Marginal habitat)로 판단하여 분석하였다. Figure 3 은 본 연구에서 기후변화에 따른 한반도 후박나무(Machilus
thunbergii)의 잠재 생육지에 대한 분석 흐름도이다. 모델
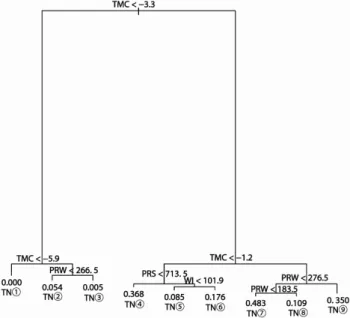
해석 프로그램으로는 R2.11.1(R Development Core Team, 2011)을 사용하였다.Figure 4. Classification tree for Machilus thunbergii trees based on the four climatic variables.
Splitting conditions and probability of occurrence of M. thunbergii are shown at the first few major nodes. If the conditions shown at the top of a branch are met, follow the left branch, otherwise follow the right branch.
resulting in 10 terminal nodes (TN). The length of the vertical lines below each true-false split corresponds to the change in the magnitude of deviance between parent and children nodes. TMC: the minimum temperature of the coldest month, WI: warmth index, PRS: summer (May-September) precipitation. PRW: winter (December-March) precipitation
결과 및 고찰
1. 모델 구축 및 기후조건 분석
한반도에 분포하는 후박나무(Machilus thunbergii)에 대 한 분포와 기후요소의 관계를 CT-model을 이용하여 후박 나무의 분포 모델(Mth-model)을 구축하였다(Figure 4).
Mth-model의 예측정도를 확인하기 위해 ROC분석을 실시 한 결과, AUC값이 0.89로 산출되었으며, Swets(1988)의 모 델 판정기준 AUC>0.8에 의하면 good으로 판정되었다.
ROC분석에서 모델의 적합도가 최고점일 경우의 분포확률 을 역치(閾値)로 한 값(MinROCdistance)은 0.140이며, 후 박나무의 분포 모델(Mth-model)에서 출현확률 0.140이상 의 지역을 생육적지(Suitable habitat)로 판단하였다. 분포 재지점(在地点)의 95%를 포함하는 최대 출현확률을 나타 내는 분포확률 0.084이상의 지역을 잠재 생육지(Potential habitats), 역치값 0.084~0.140의 지역을 분포 변록지 (Marginal habitats)로 판단하여 분석하였다.
Mth-model의 구축 결과, 9개의 terminal node는 최한월 최저기온(TMC) -3.3℃를 기준으로 크게 제 1그룹(TN①~
③)과 제 2그룹(TN④~⑨)으로 나뉘어졌다. 제1그룹은 최 한월최저기온(TMC) -5.9℃를 기준으로 node ①과 node②,
③으로 구분되어지며, 제2그룹은 최한월최저기온(TMC) -1.2℃기준으로 node④~⑥와 node⑦~⑨로 구분되었다. 또 한, 각 분기된 그룹은 기후요인에 의해 다시 분기되어 각 terminal node(TN)에 대한 기후조건이 산출되었다.
한반도 후박나무의 분포와 기후요인에 대한 생육적지는 분포확률 0.140 이상의 지역으로 TN④, TN⑥, TN⑦, TN
⑨이며, 분포 변록지는 분포확률 0.084~0.140의 지역으로 TN⑤, TN⑧로 예측되었으며, 잠재 생육지(생육적지와 분 포 변록지)는 TN④~⑨의 6개 terminal node로 예측되었다.
구축된 Mth-model에서 가장 높은 출현확률을 나타내는 TN
⑦의 기후조건은 -1.2℃≦TMC, PRW<183.5mm이며, 그 다음으로 출현확률이 높은 TN④은 -3.3℃≦TMC<-1.2℃, PRS<713.5mm, TN⑨는 -1.2℃≦TMC, 276.5mm≦PRW, TN⑥은 -3.3℃≦TMC<-1.2℃, 713.5mm≦PRS, 101.9≦
WI의 기후조건이다. 분포 변록지로 판단되는 TN⑧의 기후 조건은 -1.2℃≦TMC, 183.5mm≦PRW<276.5mm이며, TN⑤은 -3.3℃≦TMC<-1.2℃, WI<101.9의 기후조건으로 분석되었다.
Mth-model의 구축시 terminal node(TN) 분리에 공헌한 독립변수의 분리공헌도(DWS: Deviance weighted score) 는 TMC(최한월최저기온)가 92.5%, PRW(동계강수량)가
5.5%, WI(온량지수)가 1.1%, PRS(하계강수량)가 0.9%로 분석되었으며, 후박나무의 분포를 결정하는 제1요인으로 TMC(최한월최저기온) -3.3℃는 Yun et al.(2011a)에서 산 출한 한반도의 TMC(최한월최저기온)와 CMT(최한월평균 기온)와의 회귀 관계식 y=0.815x+3.384 (r²=0.99)에 의하면 0.9℃에 대응되었다. Yun et al.(2011a)은 한반도의 난온대 상록활엽수의 분포에 대한 기후조건에 관한 연구에서 난온 대 상록활엽수의 분포를 결정하는 제1기후요인으로 TMC (최한월최저기온) -5.95℃로 분석하였으며, 한반도 최한월 평균기온(CMT: the coldest month mean temperature) -1.
7℃에 대응한다고 밝힌 바 있다. Ohsawa(1990; 1991;
1993)는 동아시아 지역의 위도 20~30° 이북지역에서 상록 활엽수 분포에 대한 내성한계는 최한월평균기온(CMT) - 1℃에 제한된다고 하였다. 또한, 잔차우리도(RMD)가 0.404를 나타내고 있는 것으로 보아 본 연구에서 적용한 4개 기후요인(WI, TMC, PRS, PRW) 외에 인간간섭, 지형,
Figure 5. Predicted distribution of Machilus thunbergii under the current climate and under the climate change scenarios (CCCMA-A2, CSIRO- A2 and HADCM3-A2) conditions based on CT-model (Mth-model). The optimal threshold probability of occurrence was 0.140 from the ROC analysis, which was used to divide the potential habitats into suitable (red area) and marginal habitats(green area)
Climate Suitable habitats (km²) Maginal habitats (km²) Potential habitats (km²) condition South Korea North Korea South Korea North Korea South Korea North Korea
Current 8,153 0 1,173 0 9,326 0
CCCMA-A2 55,921 2,655 2,497 0 58,419 2,655
CSIRO-A2 54,035 6,542 4,921 0 58,955 6,542
HADCM3-A2 35,407 6,048 25,730 217 61,137 6,265 Table 1. Comparison between the area of habitats under th current climate and that under the climate change
scenarios
토양 등의 다른 환경변수가 분포에 영향을 미치고 있는 것 으로 판단된다.
2. 현재기후에서 생육지 예측
현재 후박나무 실제 분포는 한반도 서해안 도서지역과 서남부해안 지역, 제주도, 울릉도 지역에서 분포하고 있다.
구축된 분포 모델(Mth-model)을 토대로 현재기후에서 후 박나무의 잠재 생육지(Potential habitats)는 한반도 남해안 지역과 울릉도 해안지역, 제주도 해안 내륙으로 예측되었 다. 한반도 전역을 지도화 할 경우 남한지역은 약 30″의 격자수 총 145,012개이며, 면적은 약 99,898km²이며, 북한 지역은 총 186,720개, 면적은 약 128,631km²이다. 한반도 후박나무의 생육적지(TN④, TN⑥, TN⑦, TN⑨)로 판단 되는 면적은 8,153km², 분포 변록지(TN⑤, TN⑧)은 1,173km²로 예측되어 잠재 생육지 9,326km²으로 분석 되 었다. 생육적지는 한반도 남부해안 지역과 서남부 지역의 나주, 동남부 지역의 부산, 울산, 포항 등의 해안내륙 지역, 제주도 동부지역이 예측되었으며, 분포 변록지는 제주도 서 부지역에서 예측되었다(Table 1, Figure 5-A). 또한, 현재 기후에서 잠재 생육지는 남한지역에서만 예측되었으며 9,326km²로 남한 면적의 9.3%를 차지하였다. 현재기후에 서 Mth-model을 통해 예측된 후박나무의 잠재 생육지와 한반도 수평적 식생대의 관계를 살펴보면, Yim(1977)은 한 반도 수평적 식생대의 난온대 상록활엽수림에 대하여 한랭 지수(CI: Coldness Index) -10℃․month을 상부한계선으로 한반도 해안 및 해안지역의 무안, 장흥, 하동, 하남, 울산을 경계로 하고 있다. 또한, 내한성에 강한 동백나무군락이 난 온대 상록활엽수림의 분포 한계를 대표함으로 본 연구에서 예측된 후박나무의 잠재 생육지보다 북상하여 한계선을 나 타내고 있는 것으로 판단된다.
3. 기후변화에의한 생육지 변화 예측
기후변화로 인한 한반도 후박나무의 생육지 변화를 예측 하기 위해 미래기후(2081~2100) 시나리오 CCCMA-A2, CSIRO-A2, HADCM-A2를 이용하여 예측한 결과, CCCMA-
A2에서 잠재 생육지는 남한지역 58,419km², 북한지역 2,655km²으로 총 면적 61,074km²으로 예측되었다(Table 1, Figure 5-B). CSIRO-A2에서 잠재 생육지는 남한지역 58,955km², 북한지역 6,542km²으로 총 면적 65,497km²으 로 예측되었으며(Table 1, Figure 5-C), HADCM-A2에서 는 남한지역, 북한지역 각각 61,137km², 6,265km²으로 총 면적 67,402km²으로 예측되었다(Table 1, Figure 5-D). 미 래기후에서 한반도 후박나무의 잠재 생육지는 남한지역에 서 49~51%, 북한지역에서 2~5% 증가된 면적이 예측되었 다. 미래기후 시나리오에 대한 불확실성에 대한 의견은 있 지만 기후변화의한 후박나무의 분포확대는 예측되며, 미래 기후 시나리오에 따라 잠재 생육지 면적은 다소 차이를 나 타내고 있으나, 인천, 청주, 안동을 잇는 중부지역까지 분포 를 확대하고 있다. 또한, 3종류 기후시나리오에서 예측된 잠재 생육지는 유사한 분포 변화 경향을 나타내고 있다. 기 후변화에 따라 한반도 후박나무의 잠재 생육지의 분포는 점차 북쪽으로 확대하여, Yim(1977)의 WI 100~105℃․
month를 상부한계선으로 하는 한반도 난온대 낙엽활엽수
림(남부)과 유사한 분포를 나타내고 있다. 따라서, 후박나무 는 난온대 낙엽활엽수림(남부)을 구성하는 졸참나무군락, 소사나무군락, 서어나무군락, 굴참나무군락, 갈참나무군락 등과 강한 세력 경쟁이 예상된다. 또한, 기후변화가 진행됨 에 따라 난온대 낙엽활엽수림대는 북상할 것이며, 대신하여 후박나무를 비롯한 구실잣밤나무, 참식나무, 동백나무 등의 난온대 상록활엽수림을 형성할 것으로 판단된다.
본 연구에서 기후변화에 따라 후박나무의 잠재 생육지의 북상 및 분포확대 결과를 통해 후박나무는 한반도 기후변화에 대한 주요한 식물 지표종으로 유효하다고 판단되며, 환경부에 서 발표한 국가 기후변화 생물지표(CBIS: Climate-sensitive Biological indicator Species) 100종에 후박나무가 선정 발 표 되었다(Lee et al., 2010). 후박나무는 기후변화에 따라 남부내륙의 저지대에 안정적 생육지를 확보 할 것으로 예상 됨으로 지속적인 모니터링이 중요하며, 식물의 잠재 생육지 변화와 식물의 이동은 차이가 있음으로 식물 이동을 예측 하기 위한 식물 이동에 대한 동적 모델의 개발이 필요하다.
또한, 식물종의 분포역 이동에는 연속적인 생육지 분포가 중요하므로 식물의 이동 속도와 토지이용을 고려한 분포 예측 연구가 함께 수행 될 필요가 있다. 기후변화에 따른 후박나무에 대한 잠재 생육지 예측은 식물의 지리분포를 규정하는 요인을 해석하는 기초 자료 및 현재 및 미래의 생육 가능 지역을 평가할 때 중요한 자료로 활용 될 수 있을 것으로 판단된다.
인용문헌
Berry, P.M., T.P. Dawson, P.A. Harrison, R. Pearson and N.
Butt(2003) The sensitivity and vulnerability of terrestrial hab- itats and species in Britain and Ireland to climate change.
Journal of Nature Conservation 11: 15-23.
Clark, L.A. and D. Pregibon(1992) Tree-based models. In: J. M.
Chambers and T. J. Hastie, eds., Statistical Models in S, California, Wadsworth and Brooks/Cole Advanced Books and Software, Pacific Grove, pp. 377-419.
De’Ath, G. and K.E. Fabricius(2000) Classification and regression trees: A powerful yet simple technique for ecological data analysis. Ecology 81(11): 3,178-3,192.
Hanley, J. and B. McNeil(1982) The meaning and use of the area un- der a receiver operating characteristic (ROC) curve. Radiology 143: 29-36.
Harrison, P.A., P.M. Berry and T.P. Dawson, eds.(2001) Climate Change and Nature Conservation in Britain and Ireland:
Modelling Natural Resource Responses to Climate Change(the MONARCH project), UKCIP Technical Report, Oxford.
Horikawa, M., I. Tsuyama, T. Matsui, Y. Kominami and N.
Tanaka(2009) Assessing the potential impacts of climate
change on the alpine habitat suitability of Japanese stone pine (Pinus pumila). Landscape Ecology 24: 115-128.
Huntley, B.(1991) How plants respond to climate change:
Migration rates, individualism and the consequences for plant communities. Annals of Botany 67: 15-22.
Huntley, B., P.M. Berry, W. Cramer and A.P. McDonald(1995) Modelling present and potential future ranges of some European higher plants using climate response surfaces.
Journal of Biogeography 22: 967-1001.
IPCC(2007) Climate Change 2007: the Physical Science Basis, Contribution of Working Group I to the Fourth Assessment Report of the Intergovernmental Panel on Climate Change.
Cambridge University Press.
Iverson, L.R. and A.M. Prasad(1998) Predicting abundance of 80 tree species following climate change in the eastern United States. Ecological Monographs 68: 465-485.
Iverson, L.R., A.M. Prasad, B.J. Hale and E.K. Sutherland(1999) An Atlas of Current and Potential Future Distributions of Common Trees of the Eastern United States, Gen. Tech. Rep.
NE-265, US. Department of Agriculture, Forest Service, Northeastern Research Station.
Kira, T.(1977) A Climatological interpretation of Japanese vegeta- tion zones. In Miyawaki, A. and Tuxen, R. (eds.) Vegetation science and environmental protection. Maruzen, Tokyo, pp.
21-30.
Lee, B.Y., G.H. Nam, J.H. Yun, G.Y. Cho, J.S. Lee, J.H. Kim, T.S.
Park, K.K. Kim and K.H. Oh(2010) Biological indicators to monitor responses against climate change in Korea. Korean J.
Pl. Taxon. 40: 202-207.
Lee, J.H. and B.H. Choi(2010) Distribution and northernmost limit on the Korean Peninsula of three evergreen trees. Korean J. Pl.
Taxon. 40: 267-273. (in Korean with English abstract) MaCarthy, J.J., O.F. Canziani, N.A. Leary, D.J. Dokken and K.S.
White, eds.(2001) Cimate Change 2001: Impacts, Adaptation, and Vulnerability. Cambridge: Cambridge University Press.
Matsui, T., T. Yagihashi, T. Nakaya, H. Taoda and N. Tanaka (2004a) Climatic controls on distribution of Fagus crenata for- ests in Japan. Journal of Vegetation Science 15: 57-66.
Matsui, T., T. Yagihashi, T. Nakaya, H. Taoda S. Yoshinaga, H.
Daimaru and N. Tanaka(2004b) Probability distributions, vul- nerability and sensitivity in Fagus crenata forests following predicted climate changes in Japan. Journal of Vegetation Science 15: 605-614.
Metz, C.E.(1978) Basic principles of ROC Analysis. Seminars in Nuclear Medicine 8: 283-298.
Nakao, K., T. Matusi, N. Tanaka and T. Hukusima(2009) Climatic controls of the distribution and abundance of two evergreen Quercus species in Japan. Jpn. J. For. Environment 51(1):
27-37. (in Japanese with English abstract)
Nogami, M.(1994) Thermal condition of the forest vegetation zones and their potential distribution under different climates in Japan. J. of geography 103: 886-897. (in Japanese with English abstract)
Normand, S., J.C. Svenning and F. Skov(2007) National and European perspectives on climate change sensitivity of the hab- itats directive characteristic plant species. 15: 41-53.
Ohsawa, M.(1990) An interpretation in latitudinal patterns of limits in south and east Asian mountains. J. Eco. 78: 326-339.
Ohsawa, M.(1991) Structural comparison of tropical mountain rain-forests along latitudinal and altitudinal gradients in south and east-Asia. Vegetatio 97:1-10.
Ohsawa, M.(1993) Latitudinal pattern of mountain vegetation zo- nation in southern and eastern Asia. Journal of Vegetation Science 4: 13-18.
R Development Core Team(2011) R: A language and environment for statistical computing. R. Foundation for Statistical Computing, Vienna, Austria. ISBN 3-900051-07-0, URL://www.R-project.org.
Swets, K.A.(1988) Measuring the accuracy of diagnostic systems.
Science 240: 1285-1293.
Takahashi, K., Y. Matsuoka, T. Okamura and H. Harasawa(2001) Development of climate change secnarios for impact assess- ment using results of General Circulation Model simulations.
Journal of Global Environmental Engineering 7: 31-45.
Tanaka, N.(2007) PRDB (Phytosociological Relevé Data Base).
Environment change impact team, Forestry and Forest Products Research Institute. Available at URL://www.ffpri.affrc.go.jp/
labs/prdb/index-e.html.
Tanaka, N., E. Nakazono, I. Tsuyama and T. Matsui(2009) Assessing impact of climate warming on potential habitats of ten conifer species in Japan. Global Environmental Research 14: 153-164.
Thuiller, W.(2003) BIOMOD-optimizing predictions of species distributions and projecting potential shifts under global
change. Global Change Biology 9: 1,353-1,362.
Thuiller, W., S. Lavorel, M.B. Araújo, M.T. Sykes and I.C.
Prentice(2005) Climate Change threats to plant diversity in Europe. Proceeding of the National Academy of Sciences of the United States of America 102: 8,245-8,250.
Tsunekawa, A., H, Ikeguchi and K. Omasa(1993) Effects of cli- matic change on the vegetation distribution in response to cli- matic change. In: Omsa, K., K. Kai, H. Taoda, Z. Uchijima and M. Yoshino eds., Climate change and Plant in East Asia, Springer 57-65.
Tsuyama, I., T. Matsui, M. Horikawa, Y. Kominami and N.
Tanaka(2008b) Habitat prediction and impact assessment of climate change on dwarf bamboo of the Section Sasa in Japan.
Theory and Applications of GIS. 16(2): 11-25. (in Japanese with English abstract)
Tsuyama, I., T. Matsui, M. Ogawa, Y. Kominami and N.
Tanaka(2008a) Habitat prediction and impact assessment of climate change on Sasa Kurilensis in eastern Honshu, Japan.
Theory and Applications of GIS. 16(1): 11-25. (in Japanese with English abstract)
Yim, Y.J.(1977) Distribution of forest vegetation and climate in the Korea Peninsula. IV. Zonal distribution of forest vegetation in relation to thermal climate. Jap. J. Ecol. 21: 269-278.
Yun, J.H., J.H. Kim, K.H. Oh and B.Y. Lee(2011a) Distributional change and climate conditions of warm-temperate evergreen broad-leaved trees in Korea. Kor. J. Env. Eco. 25: 47-56. (in Korean with English abstract)
Yun, J.H., K. Nakao, C.H. Park, B.Y. Lee and K.H. Oh(2011b) Change prediction for Potential Habitats of Warm-temperate Evergreen Broad-leaved Trees in Korea by Climate Change.
Kor. J. Env. Eco. 25: 590-600. (in Korean with English abstract) Zweig, M.H. and G. Campbell(1993) Receiver-operating charac- teristic (ROC) Plots: a fundamental evaluation tool in clinical medicine. Climical Chemistry. 39: 561-577.