1. Introduction
Around 50% (or 3.5 billion) of world population is now living in urban areas, which is expected to be 60%
(4.9 billion) by 2030 (Mutizwa-Mangiza et al., 2011) and this percentage will reach 69.6% (6.62 billion) by 2050 (United Nation, 2010). This increasing trend in global urbanization influenced many researchers to
investigate the potential impacts of man-made activities on urban thermal environment such as Land Surface Temperature (LST) and Urban Heat Island (UHI) effect (Ye et al., 2010). Unplanned and haphazard urbanization coupled with the poor building design are the biggest causes of heat islands in cities. Research has shown that UHI is primarily caused by the built environment in urban areas, in which natural areas are replaced with
The impact of land use and land cover changes on land surface temperature
in the Yangon Urban Area, Myanmar
Khin Mar Yee, Hoyong Ahn, Dongyoon Shin and Chuluong Choi† Department Spatial Information Engineering, Pukyong National University
Abstract :Yangon Mega City is densely populated and most urbanization area of Myanmar. Rapid urbanization is the main causes of Land Use and Land Cover (LULC) change and they impact on Land Surface Temperature (LST). The objectives of this study were to investigate on the LST with respect to LULC of Yangon Mega City. For this research, Landsat satellite images of 1996, 2006 and 2014 of Yangon Area were used. Supervised classification with the region of interest and calculated change detection. Ground check points used 348 points for accuracy assessment. The overall accuracy indicated 89.94 percent. The result of this paper, the vegetation area decreased from 1061.08 sq km2(24.5%) in 1996 to 483.53 sq km2(11.2%) in 2014 and built up area clearly increased from 485.33 sq km2(11.2%) in 1996 to 1435.72 sq km2(33.1%) in 2014.
Although the land surface temperature was higher in built up area and bare land, lower value in cultivated land, vegetation and water area. The results of the image processing pointed out that land surface temperature increased from 23˚C, 26˚C and 27˚C to 36˚C, 42˚C and 43.3˚C for three periods. The findings of this paper revealed a notable changes of land use and land cover and land surface temperature for the future heat management of sustainable urban planning for Yangon Mega city. The relationship of regression experienced between LULC and LST can be found gradually stronger from 0.8323 in 1996, 0.8929 in 2006 and 0.9424 in 2014 respectively.
Key Words : Yangon Mega City, Land Use and Land Cover (LULC), Land Surface Temperature (LST)
Received February 5, 2016; Revised February 16, 2016, Accepted February 29, 2016.
†Corresponding Author: Chuluong Choi ([email protected])
This is an Open-Access article distributed under the terms of the Creative Commons Attribution Non-Commercial License (http://creativecommons. org/licenses/by-nc/3.0) which permits unrestricted non-commercial use, distribution, and reproduction in any medium, provided the original work is properly cited
Article
non-permeable and high temperature surface of concrete and asphalt (Jones et al., 1990).
Global environmental change and management practices in the urban environment because LST is closely related to the distribution of Land Use and Land Cover (LULC) characteristics. Cities are characterized by increased air and surface temperatures as compared to their rural surroundings. This so called UHI effect is caused by the specific urban structure, the set of physical features which can be described by land-use patterns and other structural indicators, such as the degree of surface sealing (Thinh et al., 2002). LULC changes induced by human or natural processes drive biogeochemistry of the earth influencing the climate at global as well as regional scales. LULC information is essential for managing natural resources and monitoring of environmental changes (Setturu et al., 2013). Currently, urbanization is considered the most important driver of climate change (McCarthy et al., 2010). As addressed in previous studies, intensive and rapid urbanization is an example of human-induced LULC change, which has exacerbated the ongoing impacts on the climate system (Jin et al., 2005). The distinct behaviors of the urban thermal environment are related to LULC both in natural and anthropogenic surface (Lo et al., 1997 and Weng 2001) as different surfaces modify the structure, composition, and energy balance of the environment.
LULC change associated with urbanization is the essential cause of global change and often results in remarkable UHI effect, which will influence the regional climate and socioeconomic development.
Numerous programs have been devoted to studies of LULC change, UHI effects and possible mitigation strategies (Su and Yang, 2007). Land surface temperature observations acquired by remote sensing technologies have been used to assess the UHI, to develop models of land surface atmosphere exchange, and to analyze the relationship between temperature and LULC changes in urban areas (Voogt and Oke,
2003) recent studies have addressed the relationship between LST and surface characteristics such as vegetation indices (Carlson et al., 1994 and Owen et al., 1998). Remote sensing is extremely useful for understanding the spatiotemporal land cover change in relation to the basic physical properties in terms of the surface radiance and emissivity data. Since the 1970s, satellite derived (such as Landsat Thematic Mapper- TM) surface temperature data have been utilized for regional climate analyses on different scale (Tran et al., 2006 and Carlson et al., 1977). Accurate land surface emissivity values aid in reliable inferences among different land covers for retrieving LST from Thermal Infrared (TIR) data (Ramachandra and Kumar, 2010, Becker and Li, 1995 and Dash et al., 2005). Qualitative studies on the correlation between LULC and LST help us in appropriate land use planning and UHI mitigation (Chen and Jim, 2003).
The topic of climate change has become the great interest both among the academicians and governing bodies at present. Many researchers try to find out the various aspect of this phenomenon including its causes, impacts and complexity. The same thing is improving population and changing urbanization is main driver of land use and land cover change and it is effect on the land surface temperature, seriously effect especially urban and its surrounding area. Nowadays, most of the cities area are facing with the urban micro climate and changing their environment. IPCC focus on the global temperature will be 1˚C to 3.5˚C by the end of the 21th century. Although the various changing temperature, some cities of Southeast Asia will be 4˚C and 5˚C (IPCC, 2002).
Based on the above discussion, the main contributions of this paper is to study the interplay on the serious changes of the land use and land cover were related with land surface temperature of the Yangon Mega City area, Myanmar. The relationship between LULC changes and land surface temperature changes are very important for urban planning and
environmental protection.
2. Study Area
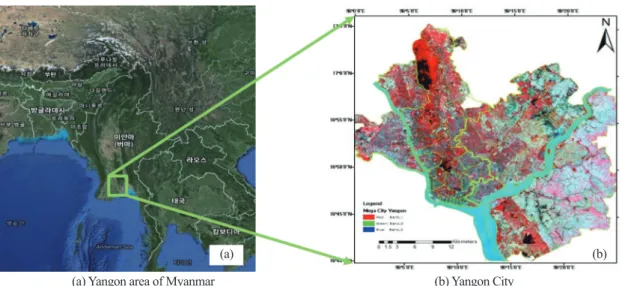
Yangon Mega city is former capital of Myanmar. It lies between 16˚ 35’ N to 17˚ 06’ N and 96˚ 00’ E and 96˚ 25’ E longitude (Fig. 1). This area is located 34 km upstream from the mouth of Yangon River and an average height of 30 m and degenerates gradually into delta plain in eastwards and westwards. Yangon is still the largest urban agglomeration and the most densely populated area in Myanmar. It is the home of more than 7.3 million and the total area of approximately 4333.45 km2. At present, Yangon is very important as a center
of politics and culture in Myanmar, which is one of the most economically prosperous region, especially at the same time, Yangon city is rapidly increasing in population rapidly since the last two decades. The results of this paper, land use and land cover changes and the issue of increasing land surface temperature catches more attention during the urban development.
3. Data and Methodology
1) Landsat satellite imagery
Landsat satellite images (1996, 2006 and 2014) were obtained from the official website of U.S. Geological Fig. 1. Location of study area.
(a) Yangon area of Myanmar
(a) (b)
(b) Yangon City
Table 1. Image Metadata
File_ Date LT51320481996085CLT00 LE71320482006072PFS00 LC81320482014086LGN00
Spacecraft_ ID LANDSAT_5 LANDSAT_7 LANDSAT_8
Sensor_ ID TM ETM+ OLI_TIRS
Cloud_ Cover 0 0.0 0.31
Image_ Quality_ OLI 9 9 9
Time (UTC) 03:03:30 03:45:36 03:55:46
Date 1996-03-25 2006-03-13 2014-03-27
Earth-sun distance 0.997 0.993 0.998
Solar-Zenith 107.72 122.29 60.84
Solar-Azimuth 48.81 54.64 117.44
Sensor-angle Nadir (roll:-0.001’) Nadir (roll:-0.001’) Nadir (roll:-0.001’)
Survey (USGS) and used in order to reach the research objectives. For the processing of Landsat Thematic Mapper (Landsat 5 TM) dated March 25, 1996 and Landsat Enhanced Thematic Mapper (ETM+) dated March 13, 2006 and Landsat 8 Operational Land Imager (OLI) dated March 22, 2014, were used very good quality, with almost no cloud (< 1% cloud cover) for this study (Table 1). The procedures of this paper consist of three steps. The first step is LULC classification with training sample and calculation of change area by change detection for three periods and calculate accuracy assessment with the 58 sample points of ground check survey for each LULC class.
The second step is retrieval of the land surface temperature of 1996, 2006 and 2014. The third step is the data analysis of the relationship between the land use and land cover and land surface temperature changes.
2) Derivation of LULC
The using satellite images were classified into six LULC types and chosen Visible Near InfraRed (VNIR) composite for Landsat 5 and 7 for 1996 and 2006, and Landsat 8 for 2014 were used with training sample sites for land cover classification. For the making map of LULC classification, the LULC spatial distribution pattern was mapped by supervised classification with the Support Vector Machine (SVM) classification algorithm. SVMs is a supervised non-parametric statistical learning technique. In its original formulation
the method is presented with a set of labeled data instances and the SVM training algorithm aims to find a hyperplane that separates the dataset into a discrete predefined number of classes in a fashion consistent with the training examples (Cortes and Vapnik, 1995).
The six classes of land cover classification considered for the study area are built up area, cultivated land, vegetation, river and stream, lake and pond, and bare land. The detail description of LULC classification can be seen in (Table 2) in detail.
3) Retrieval of LST
Land Surface Temperature is derived from geometrically corrected Landsat Thematic Mapper (TM 5), Landsat 7 TM and Enhanced Thematic Mapper Plus (ETM+) TIR channel (band 6) and Landsat 8 Operational Land Imager (OLI) Thermal InfRared (TIR) channel (band 10 and 11). The geometrically rectified images are free from distortions related to the sensors (e.g., jitter, view angle effect etc.,), satellite (e.g., attitude deviations from nominal), and the Earth (e.g., rotation, curvature, relief) (Landsat 7 Science Data Users Handbook, 2010).
The Land Surface Temperature was measured with the individual thermal images and were compared between different time periods. Based on the literature, different retrieval methods of brightness temperature from the TM and ETM+ and OLI images were applied for the land surface temperature processing. Based on (Chen et al., 2002), a two-step process was followed to Table 2. Description of LULC classification
Land cover Type Description
River and Stream Water body of river and stream area
Lake and Pond Water body of permanent open water, lakes, ponds, canals, seasonal wetland, low lying areas, mushy land,and swamps Vegetation Trees, natural vegetation, mixed forest, gardens, gardens, parks and playgrounds, grassland, vegetated lands Cultivated land Crops fields, pastures, orchards, vineyards and nurseries
Built up area All infrastructure-residential, commercial mixed use and industrial areas, villages, settlements, road network,pavements, and man-made structures Bare land Scatter Vegetation and mixed vegetation which has a scattered distribution, mostly shrubs and rangeland
derive brightness temperature from the Landsat 5 TM images in this research (Chen et al., 2002).
The first step, the Digital Numbers (DNs) of band 6 were converted to radiation luminance (RTM6) for the Landsat 5 TM using by Equation 1 for 1996.
RTM6= (Rmax_ Rmin) + Rmin (1) Where, V is the DN of Band 6, the value of maximum radiance is 1.896 (m W × cm-2× sr -1) and the value of minimum is 0.1534 (m W × cm-2× sr -1).
Retrieval of LST from the Landsat 7 ETM+ Images (LST for 2006) based on the literature (Chen et al., 2002 and Chen X-L, et al., 2006). The first step, the DNs of band 6 were converted to radiance, and could be obtained by the following equation (2):
Radiance = x (QCAL _ QCALmin) + Lmin (2) Where, the information can be obtained from the metadata of the images, QCALmin= 1, QCALmax= 255, QCAL = DN, and Lmaxand Lmin(also given in the header file of the images) are the spectral radiances for band 6 at digital numbers 1 and 255, respectively (Chen et al., 2002).
Retrieval of LST from the Landsat 8 OLI Images, the first step of the calculation for the TOA spectral radiance for the 2014 based on the following equation (3).
Lλ= MLQcal+ AL (3) Where, Lλmeans TOA spectral radiance and MLis band specific multiplicited rescaling factor from the metadata, AL indicates for band specific additive rescaling factor from the metadata and Qcal can be Qyabtuzed and calibrated standard product pixel
values. Brightness temperature (TB) is the microwave radiation radiance traveling upward from the top of Earth’s atmosphere. The calibration process has been done for converting thermal DN values of thermal bands of TIR to TB. For finding TB of an area the Top of Atmospheric (TOA) spectral radiance of (Lλ) was needed.
The second step, the radiation luminance of the all satellite images were converted to at-satellite brightness temperature in Kelvin, T (K), using the following formula (4) for all Landsat images.
T = (4)
Where, T defines the meaning of at satellite brightness temperature in Kelvin, Lλis TOA spectral radiance and K1and K2are the band specific thermal conversion constant from metadata. The following Table 3 distinguishes the respective value of band specific thermal conversion constant from metadata.
4. Results and Discussion
1) Changes of LULC
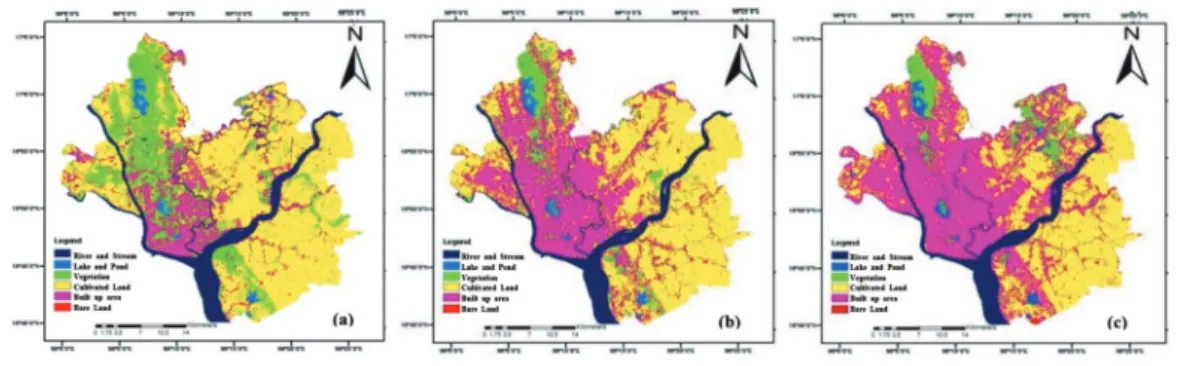
Fig. 2 shows the distribution of land use and land cover in the Yangon City area for three time periods considered for this research. Table 3 and 4 indicate the area of LULC classes and the change area of 1996, 2006 and 2014 for study area.
The post image classification comparisons were employed to perform LULC change detection and which showed the quantitative data of the overall 255V
Lmax_ Lmin QCALmax_ QCALmin
K2
In ( +1)K1
Lλ
Table 3. The Value of Band Specific Thermal Conversion Constant from metadata
Sensor K1(watt/ (m2× ster × μm)) K2(watt/ (m2× ster × μm))
Landsat 5 TM 1260.56 607.76
Landsat 7 ETM+ 666.09 1282.71
Landsat 8 OLI BAND_10 = 774.8853 BAND_10 = 1321.0789
BAND_11 = 480.8883 BAND_11 = 1201.1442
Fig. 2. LULC Distribution of (a) 1996, (b) 2006 and (c) 2014.
Table 4. Area of LULC Classes of Mega City Yangon (1996, 2006 and 2014) (unit : km2)
LULC 1996 2006 2014
River & stream 170.2 179.7 153.1
Lake and pond 54.9 63.5 69.5
Vegetation 1061.1 566.2 483.5
Cultivated land 2525.3 2403.6 2154.5 Built up area 485.4 1066 1435.7
Bare land 36.5 54.4 37.1
4333.4 4333.4 4333.4
Table 5. LULC Change area (unit: km2) LULC 1996-2006 2006-2014 1996-2014 River and stream 9.54 -26.65 -17.11
Lake and pond 8.54 5.97 14.51
Vegetation -494.88 -82.67 -577.55 Cultivated land -121.88 -248.91 -370.79 Built up area 580.68 369.71 950.39
Bare land 17.98 -17.42 0.56
Table 6. Accuracy assessment of 1996, 2006 and 2014
Period LULC build up
area cultivated
land vegetation river andstream lake and
pond bare land Total Accuracy (%)
1996
built up area 45 7 2 1 1 2 58 77.58
cultivated land 7 47 3 0 0 1 58 81.03
vegetation 2 3 45 1 1 6 58 77.58
river and stream 1 0 1 55 0 1 58 94.82
lake and pond 1 0 1 0 55 1 58 94.82
bare land 2 1 0 1 2 52 58 89.65
85.91
2006
built up area 48 4 2 1 1 2 58 82.75
cultivated land 4 50 1 0 0 3 58 86.20
vegetation 2 1 53 1 0 1 58 91.37
river and stream 1 0 1 55 1 0 58 94.82
lake and pond 1 0 0 1 54 2 58 93.10
bare land 2 3 1 0 2 50 58 86.20
89.08
2014
built up area 56 1 0 1 0 0 58 96.55
cultivated land 1 54 1 0 1 1 58 93.10
vegetation 0 1 54 1 1 1 58 93.10
river and stream 1 0 1 56 0 0 58 96.55
lake and pond 0 1 1 0 55 1 58 94.82
bare land 0 1 1 0 1 55 58 94.82
94.82 Overall accuracy 89.94%
LULC changes between 1996, 2006 and 2014. Area of LULC classes are distinguished by Table 4, Table 5 is clearly distinguishable that built up area rapidly increased over all the periods and vegetation area declined gradually. Built up area increased from 485.33 km2to 1066.01 km2between 1996 and 2006. In 2014, build up area replaced again to 1435.72 km2 respectively. More specifically built up area increased by km2within three time series because of the urban expansion.
On the other hand, the vegetation area decreased from 1061.1 km2to 483.5 km2within 1996 and 2014 because of extension of cultivated land and residential area. For the accuracy assessment, the 58 samples for each land use class were selected using random method to check ground survey and present different LULC classes of the study area. The total overall accuracy of the classified images for 1996, 2006 and 2014 is 89.94 % and the calculation is shown by Table 6.
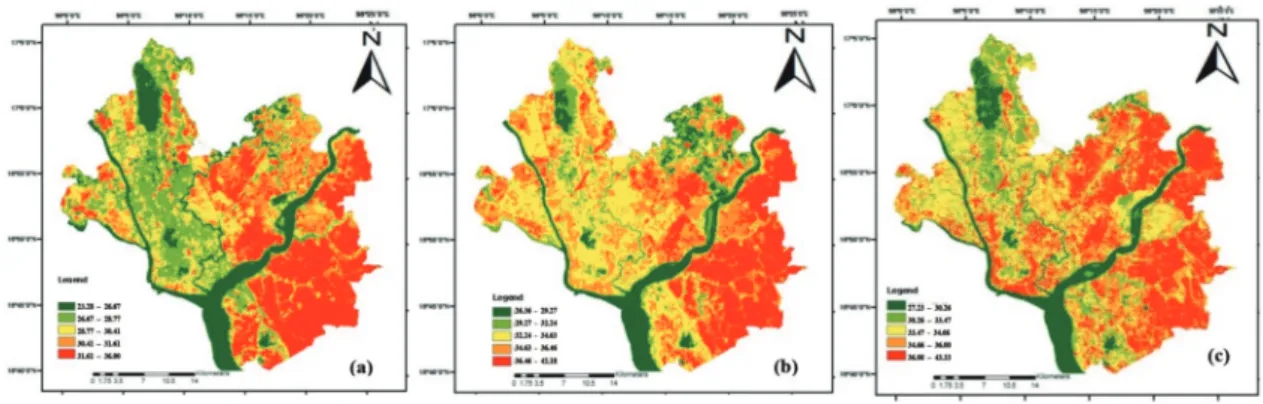
2) Change in Land Surface Temperature Fig. 3 shows clearly the distribution and changes in the three periods of land surface temperature of Yangon Mega City from 1996, 2006 and 2014 and changes of land surface temperature. The Table 7 is the results of the image processing point out that land surface temperature ranged from 23˚C, 26˚C and 27˚C to 36˚C, 42˚C and 43.3˚C within three periods. The average temperature increased from 29.64˚C to 34.18˚C between
1996 and 2006, and increased again to 35.28 ˚C on 2014. So, 5.64˚C of the land surface temperature increased from 1996 to 2014 period.
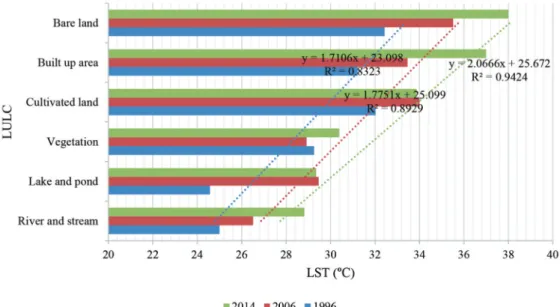
3) Relationship between LULC and LST The different levels of Land Surface Temperature located in the certain regions corresponding to the location of the land cover classes. Fig. 4 and Table 8 indicate the relationship between various kinds of LULC and LST situation of the study area within the three periods of 1996, 2006 and 2014.
According to the table, the results represent that the LST increased for all LULC classes all over the study periods. The LST of small bare land and built up area
Fig. 3. LST Distribution of (a) 1996, (b) 2006, (c) 2014.
Table 7. Average, Minimum and Maximum Land Surface Temperature of 1996, 2006 and 2014(ºC)
Year Minimum LST Maximum LST Average LST
1996 23.28 36 29.64
2006 26.36 42.18 34.18
2014 27.23 43.33 35.28
Table 8. The Relationship between LULC and LST of 1996, 2006 and 2014
LULC 1996 (˚C) 2006 (˚C) 2014 (˚C)
River and stream 25 26.51 28.82
Lake and pond 24.57 29.46 29.35
Vegetation 29.26 28.92 30.39
Cultivated land 32.03 34 33.87
Built up area 31.22 33.46 37
Bare land 32.43 35.52 38
of three periods were associated with higher LST from 32.43 ºC and 31.22 ºC in 1996 to until 38 ºC and 37 ºC in 2014. The result of regression value between LULC and LST were gradually increased from 0.8323 in 1996, 0.8929 in 2006 and 0.9424 in 2014 respectively.
4. Conclusion
By using multi-temporal remotely sensed data and statistical analysis, this paper presented better results for the spatiotemporal patterns of land use and land cover classification and land surface temperature using fewer remotely sensed data images focusing on the relatively the Yangon Mega City and surrounding area.
The study investigated the relationships between the LULC and LST in Yangon Mega City. The analysis carried out found that a notable decrease of vegetation area because of conversion to the increasing over double up of the built up area over the study periods.
The spatial distribution pattern of LST increase was correlated with the pattern of urban expansion. This is particularly true when all these distribution patterns were referenced along the major roads. The LST of the
all of the LULC classes also were higher and higher within 29 years. For the further understanding the effect of the changes of the various types of LULC and LST, the correlation value were becoming higher.
References
Becker, F. and Z.L. Li, 1995. Surface temperature and emissivity at various scales: definition, measurement and related problems. Remote Sensing Reviews, 12(3-4): 225-253.
Carlson, T.N., J.A. Augustine, and F.E. Boland, 1977.
Potential application of satellite temperature measurements in the analysis of land use over urban areas, Bulletin of the American Meteorological Society, 58(12): 1301-1303.
Carlson, T.N., R.R. Gillies, and E.M. Perry, 1994. A method to make use of thermal infrared temperature and NDVI measurements to infer surface water content and fractional vegetation cover, Remote Sensing Reviews, 9(1-2): 161- 173.
Chen, X.L., H.M. Zhao, P.-X. Li, and Z.Y. Yin, 2006.
Fig. 4. The Correlation and Relationship between LULC and LST of Yangon City (1996, 2006 and 2014)
Remote sensing image-based analysis of the relationship between urban heat island and land use/cover changes. Remote Sensing of Environment, 104(2): 133-146.
Chen, Y., J. Wang, and X. Li, 2002. A study on urban thermal field in summer based on satellite remote sensing. Remote Sensing for Land and Resources, 14(4):55?59.
Chen, S. and C.Y. Jim, 2003. Quantitative assessment of the tree scape and cityscape of Nanjing, China. Landscape Ecology, 18(4): 395-412.
Cortes, C. and V. Vapnik, 1995. Support-vector networks. Machine Learning 20.3 (1995):273- 297.
Dash P., F.M. Gottsche, F.S. Olesen, and H. Fischer, 2005. Separating surface emissivity and temperature using two-channel spectral indices and emissivity composites comparison with a vegetation fraction method. Remote Sensing of Environment, 96(1): 1-17.
IPCC, 2002. Managing the Risks of Extreme Events and Disasters to Advance Climate Change Adaptation. A Special Report of Working Groups I and II and the Intergovernmental Panel on Climate Change, Cambridge University Press. Cambridge, UK.
Jin, M., R.E. Dickinson, D.L. Zhang, 2005. The footprint of urban areas on global climate as characterized by MODIS. Journal of climate, 18(10): 1551-1565.
Jones, P.D., P.Y. Groisman, M. Coughlan, N. Plummer, W. Wang, and T.R. Karl, 1990. Assessment of urbanization effects in time series of surface air temperature over land. Nature, 347(6289): 169- 172.
McCarthy, M.P., M.J. Best, and R.A. Betts, 2010.
Climate Change in cities due to global warming and urban effects. Geophysical Research Letters, 37(9): L09705.
Lo, C.P., D.A. Quattrochi, J.C. Luvall, 1997.
Application of high resolution thermal infrared remote sensing and GIS to assess the urban heat island effect. International Journal of Remote Sensing, 18(2), 287-304.
Mutizwa-Mangiza, N.D., B.C. Arimah, I. Jensen, E.A.
Yemeru, and M.K. Kinyanjui, 2011. Cities and Climate Change: Global Report on Human Settlements 2011, Earthscan Ltd, London, UK, Owen, T.W, T.N. Carlson, and R.R. Gillies, 1998. An assessment of satellite remotely-sensed land cover parameters in quantitatively describing the climatic effect of urbanization. International Journal of Remote Sensing, 19(9), 1663-1681.
Ramachandra T.V. and U. Kumar, 2010. Greater Bangalore: Emerging Urban Heat Island. GIS Development, 14(1): 86-104.
Setturu B., KS. Rajan, and T.V. Ramachandra, 2013.
Land Surface Temperature Responses to Land Use Land Cover Dynamics, Geoinformatic &
Geostatistics: An Overview, 1(4).
Su, W.Z., and Y.B. Yang, 2007. Study on urban spatial structure based on landscape ecology. Science Press, Beijing, China.
Thinh, N. X., G. Arlt, B. Heber, J. Hennersdorf, and I.
Lehmann, 2002. Evaluation of urban land-use structures with a view to sustainable development.
Environmental Impact Assessment Review, 22(5): 475-492.
Tran, H., D. Uchihama, S. Ochi, and Y. Yasuoka, 2006.
Assessment with satellite data of the urban heat island effects in Asian mega cities, International journal of Applied Earth Observation and Geoinformation, 8(1): 34-48.
United Nation, 2010. World urbanization prospects:
The 2009 revision population database. http://
esa.un.org/unpd/wup/index.htm.
USGS, 2010. Landsat 7 Science Data Users Handbook, NASA’s Goddard Space Flight Center.
Greenbelt, MD, USA.
Vapnik, V. 1979. Estimation of Dependences Based on
Empirical Data Nauka. Moscow:Nauka. (in Russian)
Voogt. J.A., and T.R. Oke, 2003. Thermal remote sensing of urban climate. Remote Sensing of Environment, 86(3): 370-384.
Weng Q, 2001. A remote sensing? GIS evaluation of urban expansion and its impact on surface temperature in the Zhujiang Delta, China.
International Journal of Remote Sensing,
22(10): 1999-2014.
Ye, H., K. Wang, S. Huang, F. Chen, Y. Xiong, and X.
Zhao, 2010. Urbanisation effects on summer habitat comfort: A habitat comfort: A case study of three coastal cities in southeast China.
International Journal of Sustainable Development and World Ecology, 17(4): 317- 323.