INTRODUCTION
Spatial heterogeneity plays a governing role in determining biological communities and subse- quently causes complex environment-commu- nity relationships (Turner and Gardner, 1991;
Levin, 1992; Tilman, 1994). The environment factors produce spatial heterogeneity in different scales in rivers and streams (Hynes, 1970;
Minshall et al., 1983; Minshall, 1984; Giller et al.,
1994). Specifically for mobile macro-inverte- brates, substratum patches and habitat types could form units in 1-10 m scale respectively in temperate region (Hubbell and Foster, 1986).
The previous studies on the habitat-communi- ty relationship, however, were mainly conducted in large scales (Frissell et al., 1986; Coddington, 1988; Resh et al., 1988; Fisher, 1990). Benthic macro-invertebrates were generally surveyed in the range of 1-10 km. Geomorphology and wa- tershed environments are highly different in this
─
─ 295 ──
Characterization of Benthic Macro- - Invertebrate Communities and Hydraulic Factors in Small- - Scale Habitats in
a Polluted Stream
Kwak, Inn-
-Sil, Guangchun Liu
1, Young Seuk Park2, Mi--Young Song and Tae Soo Chon*
(Division of Biological Sciences, Pusan National University, Busan, 609-735, Korea
1Department of Agriculture, Shenyang University, P.R. China
2CESAC UMR 5576, CNRS-Universite Paul Sabatier, 118 route de Narbonne, 31062 Toulouse, France)
Benthic macro--invertebrates were collected in a 200 m reach located in the 3rdorder Yangjae Stream, a tributary of the Han River, Seoul, from April 1996 to March 1998.
Although species richness was relatively low due to organic pollution, community abundance patterns appeared to be different depending upon location of the sampling sites. At the sample sites in the straight zone with high water velocity and large substrates, species richness was high and species relatively less--tolerant to organic pollution was additionally present. At the sample sites in the pool zone with lower velocity and high sedimentation, species richness was low and a few tolerant species to organic pollution were abundantly collected. The principle component analysis indicated that some sample sites in the straight zone appeared to be related to water velocity and shear velocity, and associated with diverse taxa less tolerant to organic pollution. Additionally the sample site transplanted with large substrates was associated with hydraulic characters such as substrate diversity and roughness, and was related to species indicating partial recovery of water. The sample sites located at the pool zone tended to be associated with organic matter that had sedi- mented on to the substrates and the taxa tolerant to organic pollution, including Oligochaeta and Chironomus.
Key words : Community structure, benthic macro-- invertebrates, stream, habitats, multivariate analysis
* Corresponding Author: Tel: 051) 510-2261, Fax: 051) 581-2962, E-mail: [email protected]
case and community composition is correspond- ingly diverse in the large scale of space. Conse- quently, species traits in different survey area have been useful for community characterization (e.g., Resh et al., 1994).
In small scale in space, however, environment and community would not be distinctively differ- ent among sample sites, and species traits could not characterize community efficiently. There have been various accounts of studying benthic macro-invertebrate communities in a relatively small scale in hundred-meter distance (e.g., Cummins and Lauff, 1969; Hildrew et al., 1980).
In this case, however, the total sampling periods have usually been short while sampling frequen- cies were relatively sparse with seasonal or year- ly collections. Community variations have been rarely covered in 10 m distance scale with mon- thly collections. In this study, we intended to characterize communities and their relationships to hydraulic variables in a small-scale of 10 m, especially when the streams were polluted in an urban area.
MATERIALS AND METHODS
Study area and sample sites
The survey was carried out in a 200 m reach (Hakyeoul) located in the 3
rdorder downstream of the Yangjae Stream, a tributary of the Han River in south of Seoul, Korea (37�24′-37�29′ N, 126�57
′-127�04
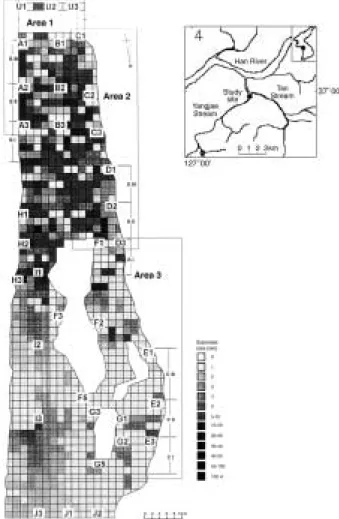
′E) (Fig. 1). It flows through the metropolitan and agricultural area in the city, and has been mainly polluted with organic mat- ter (KICT, 1997). The stream has a year-round flow in 20-30 m width and 10-60 cm in depth.
Water discharges are rapidly increased in the period of summer flooding, while decreased in dry winter season.
Based on topography of the surveyed area, four sub-areas were conventionally categorized, generally covering 30-50 m in longitude and 5- 10 m in transverse (Fig. 1): 1) the upstream Area I, 2) the downstream Area II, 3) the outer con- cave bank Area III and 4) the pool Area IV (Table 1). Some parts of the edge area in the surveyed reach were reconstructed for the purpose of restoration of the stream.
Usually water velocities and depths were relatively high in the straight upstream Area I, while the reverse situation occurred in the pool
Area IV. The other environmental factor such as substrate composition was correspondingly con- trasted between these areas: substrates were larger and diverse in Area I while smaller and less diverse in Area IV (Fig. 2). In Area III locat- ed at the outer concave bank (Fig. 1), velocity was in intermediate range (20-30 cm/s) and sub- strates mainly consisting of middle-sized peb- bles occurred abundantly (Table 1). Area II was wide, and velocity was in intermediate range while relatively small-sized gravels were mainly present.
For sampling of benthic macro-invertebrates, each area was further divided into two to three sample sites in 5-10 m distance based on loca- tion, geomorphic characters and sampling direc- tion. Except the sites of JHU and JHJ, which were the beginning and end points of the survey-
Fig. 1. Map of the sampling sites at the Hakyeoul reach in the Yangjae stream, Han River (Surveyed in March, 1996).
ed reach respectively, longitudinal or curvilinear sampling was conducted (Table 1).
For the purpose of restoration, vegetation channel revetment technique was conducted in the riparian zone close to JHA (Fig. 1; KICT, 1997). The stream bed was artificially planted with large-sized cobbles approximately 5 cm in diameter (Fig. 2). The upstream islet, where JHF was located nearby, was artificially constructed for management of siltation as well as for pro- viding habitats for birds and other animals, while the downstream islet, around which JHG was sampled, was naturally formed. Restoration was also conducted on the riparian zone close to
JHD, but stream bed was not affected by the restoration project in this case. JHE was located close to the edge area at the pool zone, and silts were highly accumulated.
Sample collection and environmental measurement
At each sample site three to four benthic samples were collected with the Surber sampler (30 cm×30 cm, 500
µm mesh; Surber, 1937;
APHA et al., 1985) in about 10 cm depth at mon- thly intervals for two years from April 1996. The collected macro-invertebrates were preserved in
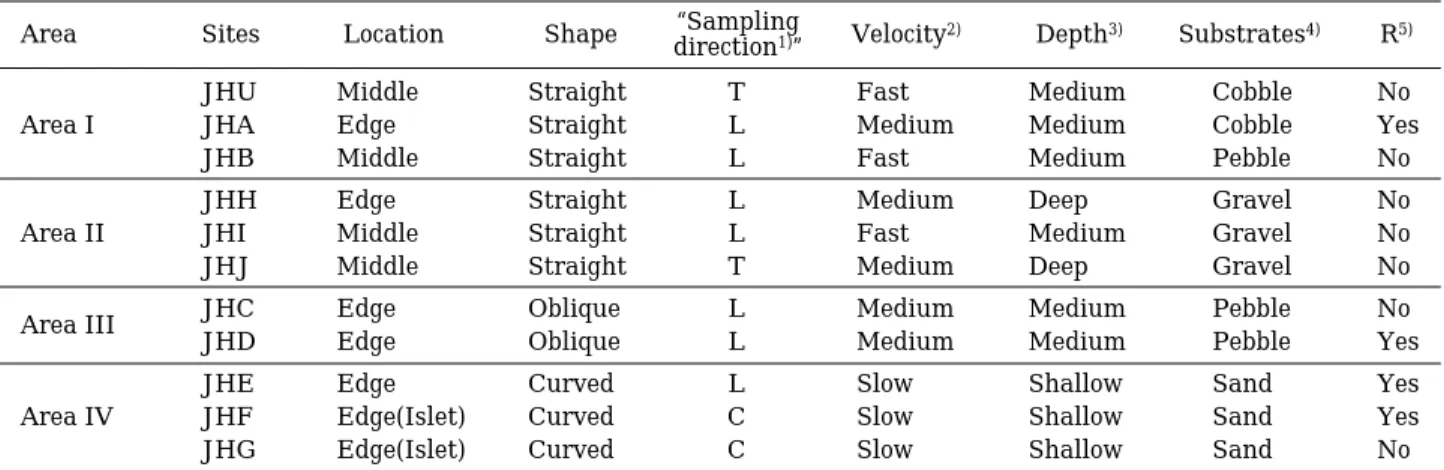
Table 1. Description of the sample sites located at the Hakyeoul reach in the Yangjae Stream, Han River.
Area Sites Location Shape direction“Sampling1)” Velocity2) Depth3) Substrates4) R5)
JHU Middle Straight T Fast Medium Cobble No
Area I JHA Edge Straight L Medium Medium Cobble Yes
JHB Middle Straight L Fast Medium Pebble No
JHH Edge Straight L Medium Deep Gravel No
Area II JHI Middle Straight L Fast Medium Gravel No
JHJ Middle Straight T Medium Deep Gravel No
Area III JHC Edge Oblique L Medium Medium Pebble No
JHD Edge Oblique L Medium Medium Pebble Yes
JHE Edge Curved L Slow Shallow Sand Yes
Area IV JHF Edge(Islet) Curved C Slow Shallow Sand Yes
JHG Edge(Islet) Curved C Slow Shallow Sand No
1)T; Transverse, L; Longitudinal, C; Curvlinear
2)Slow; lsee than 20 cm/s, Medium; equal to or greater than 20 cm/s and less than 30 cm/s, Fast; greater than 30 cm/s
3)Shallow; lsee than 10 cm, Medium; equal to or greater than 10 cm and less than 15 cm, Deep; greater than 15 cm
4)Substrate size category by Minshall (1984)
5)R; The project of reconstruction conducted
Fig. 2. Substrate composition (%) in different sizes (diameter; mm) collected at the sample sites of the Hakyeoul Reach in the Yangjae stream, Han River, at monthly intervals from April 1996 to March 1998. a) Overall size, b) Small size (⁄8 mm).
7% Formalin solution. In the laboratory the invertebrate specimens were sorted, identified and counted under microscopes. Identification was based on Yun (1988), Brighnam et al. (1982), Merritt and Cummins (1984), Pennak (1978) and Quigley (1977). Chironomidae was separately identified based on Wiederholm (1983), while Oligochaeta was checked with Brinkhurst et al.
(1971) and Brinkhurst (1986).
At each site of collection, volume of substrate was measured in different diameters (D): coarse cobbles (mean D sizes≥100 mm), fine cobbles (100 mm¤D≥50 mm), pebbles (50 mm¤D≥30 mm), fine pebbles (30 mm¤D≥16 mm), coarse gravel (16 mm¤D≥8 mm), and the smaller sub- strates (8 mm¤D≥4 mm, 4 mm¤D≥2 mm, 2 mm¤D≥1 mm, 1 mm¤D≥0.5 mm, 0.5 mm¤D
≥0.25 mm, 0.25 mm¤D≥0.1 mm and 0.1 mm¤
D≥0.062 mm) (Cummins and Lauff 1969). The volumes of larger substrates (≥8 mm) were de- termined by the volumetric bucket in the field, while substrates smaller than 8 mm in diameter were separately sampled into plastic containers (50 ml) in triplications. Subsequently dry weights were estimated in the laboratory and volumes were calculated in different mesh sizes. Sub- strate heterogeneity was expressed by diversity using Simpson’s index (Simpson, 1949; Minshall, 1984). The total sediment organic matter at the sampled sites was additionally determined by the ashing method, after being dried at 550� C for 4 h (Wrona et al., 1986).
The hydraulic variables were estimated for each sample site according to Statzner et al.
(1988). Roughness was expressed as K = (5C
1± 3C
2±C
3)/9 where the subscripts 1, 2 and 3 repre- sent the 1st, 2nd and 3rd most dominant sub- stratum type, respectively. Coarseness value C was correspondingly assigned to the size of domi- nant substrates; 1, 2, 3 and 4 if the size, k, is in the range of k⁄0.125 mm, 0.5 mm≤k⁄4 mm, 8 mm≤k⁄30 mm, k≥30 mm respectively. The coarse classes have been slightly modified from those given by Statzner et al. (1988) to the size used in this study. The other hydraulic parame- ters were obtained as follows:
Froude number (Fr) = U/ (g D)
∙∙∙∙∙∙∙∙∙∙∙∙∙∙∙∙∙∙∙∙∙∙∙∙∙∙∙(1) Reynold number (Re) = U D/v
∙∙∙∙∙∙∙∙∙∙∙∙∙∙∙∙∙∙∙∙∙∙∙∙∙∙∙∙∙(2) Shear velocity (U*) = U/5.57log
10(12D/K)
∙∙∙∙∙∙(3) Viscous sublayer thickness (VST) = 11.5v/U*
∙∙(4)
where U is mean water velocity (cm/s), D is depth (cm), g is acceleration due to gravity (981 cm/s
2), and v is kinematic viscosity (0.011 cm
2/s at 15� C).
Data analysis
The Principal Component Analysis (PCA) was conducted to examine associations among vari- ables and sample sites. The abundance of the selected taxa in community and the values of en- vironmental factors were separately provided as input to PCA. Taxa collected with extremely low densities were not used for input and abundant 6 taxa were provided as input: Oligochaeta, Chi- ronomus, Orthocladius, Cricotopus, Hirudinae and Gastropoda. Densities in benthos were log- transformed as ln(x±1) where x is density of the selected taxa. Log transformed densities and hydraulic data were normalized between 0.0- 1.0. All analyses were carried out by using the MVSP (Multi Variate Statistical Package) soft- ware, which was available on the internet at
“http://www.kovcomp.com/mvsp/index.html”.
RESULTS AND DISCUSSION
Characterization of sampling sites
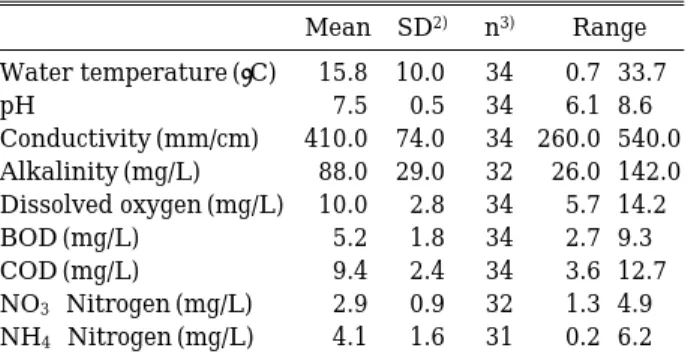
Values of BOD (Biochemical Oxygen Demand) measured during the survey period were in the range of 2.7-9.3 mg/L (Table 2). These values were generally matched to
α-meso saprobity (Sláde ˇcek, 1979). Biological indicators were also correspondingly low. The index of BMWP (Bio- logical Monitoring Working Party; Hellawell, 1986) was in the lower range of 3-43 (Kwak, 2001). Nitrate and COD levels in the water were relatively high, probably originated from the agricultural runoff and the urban sewage pro- duced in the watershed area. However, the stream was fairly well oxygenated throughout the year with dissolved oxygen mostly exceeding 8 mg/L.
Although general environmental condition was
similar in the survey area (Table 2), hydraulic
parameters at each sample site appeared to be
diverse according to location (Table 3). Water
was deeper in Area II (13.35-17.90 cm) and Area
I (11.99-14.15 cm) in the straight zone, while
shallow at the pool Area IV (6.40-8.53 cm). Velo-
city was correspondingly higher at the straight
zone in Area I (22.59-31.77 cm/s) and Area II
(21.59-30.65 cm/s), while slow in Area IV (13.14 -18.02 cm/s). In Area III at the outer concave bank (Fig. 1) water was relatively shallower than Area I and Area II, while deeper than Area IV.
Water velocity in Area III was similar to Area IV, while slower than in the straight zone.
Roughness (K) was highest in Area I (2.44- 3.10), while mostly low at the other sites in the range of 1.48-2.12 (Table 3). Especially at JHA in Area I, where substrates in larger size were artificially planted through the restoration pro- ject as mentioned before, roughness was highest with K = 3.10. Although located in the straight zone, the sites of JHH and JHJ in down-stream showed relatively lower roughness (1.50). The
sample sites in Area III and Area IV also showed lower values of roughness (1.48-1.77).
Froude numbers (Fr) (Equation 1) showed a narrow range of 0.16-0.28. The values were rela- tively higher in Area I while JHH showed the lowest value with 0.16. In contrast, Reynold numbers (Re), which were represented by multip- lication of water velocity and depth (Equation 2), varied widely depending upon location of the sample sites. At the straight Area I and Area II, Reynold numbers were high (31043-48882), while the values were lowest at the curved Area IV (9600-17924) followed by Area III (29308- 33736). The shear velocities (U*) (Equation 3) showed the similar trend with the Reynold num- bers, but with less variation: high at the straight Area I (2.47-3.22 cm/s) and Area II (1.79-2.95 cm/s) while low in Area III (1.98-2.16 cm/s) and Area IV (1.45-1.93 cm/s). Viscous sublayer thic- kness (VST) appeared in the reverse manner:
high in Area IV (0.08-0.10 cm) and Area III (0.07 -0.08 cm) while low in Area I (0.04-0.06 cm) (equation 4). Substrates diversities (H) were relatively invariable, slightly higher in Area I (0.81-0.87) than in the other areas (0.71-0.82).
Values in substrate diversity were also consis- tent with values of Roughness (K).
Sediment organic matter (SOM) was accumu- lated highly in Area III and Area IV (3.66-5.82 mg/100 mL), especially high at JHE (5.82 mg/100 mL). In Area I, sediment organic matter was relatively low with 2.46-3.83 mg/100 mL. At JHA
Table 2. Physico-chemical measurements at the Hak- yeoul reach in the Yangjae stream, Han River, from March 1996 to October 19971).
Mean SD2) n3) Range Water temperature (�C) 15.8 10.0 34 0.7-33.7
pH 7.5 0.5 34 6.1-8.6
Conductivity (mm/cm) 410.0 74.0 34 260.0-540.0 Alkalinity (mg/L) 88.0 29.0 32 26.0-142.0 Dissolved oxygen (mg/L) 10.0 2.8 34 5.7-14.2
BOD (mg/L) 5.2 1.8 34 2.7-9.3
COD (mg/L) 9.4 2.4 34 3.6-12.7 NO3-Nitrogen (mg/L) 2.9 0.9 32 1.3-4.9 NH4-Nitrogen (mg/L) 4.1 1.6 31 0.2-6.2
1)The data are obtained from the second report (KICT, 1997).
2)SD; standard deviation
3)n; number of samples
Table 3. Averages in hydraulic measurements at different sample sites at the Hakyeoul reach in Yangjae stream, Han River, from April 1996 to March 1998 (Methods of measurements are listed in the text.).
Area Sites D U K Fr Re U* VST H SOM
Area I JHU 13.83 31.77 2.75 0.28 47799 3.22 0.04 0.87 2.60
JHA 11.99 22.59 3.10 0.21 31043 2.47 0.06 0.87 3.83
JHB 14.15 30.87 2.44 0.26 48882 3.02 0.05 0.81 2.46
Area II JHH 17.90 21.59 1.50 0.16 46683 1.79 0.09 0.73 2.94
JHI 13.35 30.65 2.12 0.27 45160 2.95 0.05 0.82 2.68
JHJ 17.67 24.29 1.50 0.19 46677 2.04 0.07 0.73 2.68
Area III JHC 10.97 21.08 1.52 0.21 29308 1.98 0.08 0.71 3.83
JHD 11.68 22.55 1.77 0.22 33736 2.16 0.07 0.76 4.42
Area IV JHE 8.53 18.02 1.48 0.20 17924 1.76 0.08 0.75 5.82
JHF 7.55 18.01 1.76 0.22 15824 1.93 0.08 0.79 4.23
JHG 6.40 13.14 1.58 0.18 9600 1.45 0.10 0.73 3.66
Sum 134.06 254.27 21.70 2.39 372638 24.75 0.76 8.57 39.15
Mean 12.19 23.14 1.97 0.22 33876 2.25 0.07 0.78 3.56
SD 3.76 5.93 0.56 0.04 14397 0.58 0.02 0.06 1.03
CV 0.31 0.26 0.28 0.18 0.42 0.26 0.25 0.07 0.29
D; Depth (cm), U; Velocity (cm/s), K; Roughness, Fr; Froude number, Re; Reynold number, U*; Shear velocity (cm/s), VST; Viscous sublayer thickness (cm), H; Substrate diversity, SOM; Sediment Organic Matter (mg/100 mL)
where large substrates were artificially planted, however, sediment organic matter was higher with 3.83 mg/100 mL compared with the nearby site JHH with 2.94 mg/100 mL.
Large substrates occurred abundantly at the straight Area I in upstream (Fig. 2(a)), most highly collected at JHA followed by JHU and JHB, while small substrates were abundantly present at the other sample areas. Considering substrates smaller than 8 mm (Fig. 2(b)), sub- strates ranging 0.062-0.5 mm were present abundantly at all sites and appeared to be in dif- ferent patterns according to location (Fig. 2(a)).
Substrates in 0.062-0.5 mm were most highly accumulated in Area III at the outer concave bank followed by Area IV at the pool zone: dis- tinctively high at ‘JHC, JHD and JHE’ followed by ‘JHF and JHG’. While substrate larger than 8 mm were relatively more present in JHD com- pared with JHC, substrates in 0.062-0.5 mm were equally present between JHC and JHD. At JHI, in contrast, substrates in these sizes less occurred (Fig. 2(b)), although substrates less than 8 mm were dominantly collected (Fig. 2(a)).
The reason why distribution pattern is different in smaller sizes is unknown for the present time.
However, the location of the sample sites and water velocity appeared to play an important role in determining sedimentation of smaller substrates. JHE in Area IV and additionally JHC and JHD at Area III are located at the pool zone and at the outer concave bank respectively, and are consequently good positions to receive water current (Fig. 1). Water velocity was also
lower (Table 3), and sedimentation would occur with a higher chance at these sample sites.
Invertebrate community structure
Due to organic pollution, species richness ap- peared to be low, and 10-20 species were collect- ed during the survey period (Table 4). Oligo- chaeta, mainly consisting of Limnodrilus and Tubifex, was distinctively dominant, making up 70-91% of relative abundance in total (Fig. 3).
The second dominant taxon was genus Chirono- mus, occupying 8-17% of the total abundance.
Although species richness was generally low, densities in the collected taxa were characteri- stically different at different sample sites (Table 4). Specimens were most abundantly collected in Area IV at the pool zone with low species rich- ness. In contrast, total densities were low at JHB, JHI and JHJ in the straight areas. In Area III at the outer concave bank benthic macro- invertebrates were also more abundantly collect- ed, compared with those in the sample sites in the straight area. As previously mentioned this may be due to the fact that the outer concave bank was located in the position of receiving water flow, and consequently benthic macro- invertebrates may be more frequently drifted to this area. But this needs further confirmation.
Densities at the sample sites of JHH were also higher compared with the other sample sites located in the straight area (Table 4). This may be due to hydraulic characters of JHH. JHH was located at the edge area and showed lower water
Fig. 3. Mean relative abundance (%) of the selected taxa of benthic macro-invertebrates collected at the sample sites of the Hakyeoul Reach in the Yangjae stream, Han River, collected monthly from April 1996 to March 1998.
velocity compared with JHB and JHI. In con- trast, JHB and JHI were low in densities (Table 4). These sample sites were not in the place of receiving water current and their water velocity was relatively high. JHI was also distributed frequently due to the restoration project conduct- ed at the area near JHF. The low density in Chi- ronomus in JHJ located at the end point of the survey area in downstream (Fig. 1) may be partly due to its location; drifting invertebrates may be landed in Area IV at the pool zone before they reach JHJ.
Species richness was higher (11-20) in Area I at the straight zone than in the other areas (10- 16) (Table 4). Especially species richness was distinctly high at JHA where large substrates were abundantly present. At JHA roughness and viscous sublayer thickness were correspondingly high. Additionally sediment organic matter was highly accumulated at JHA. This revealed the effects of transplanting large substrates in the restoration project as mentioned previously.
Diverse Chironomids including Orthocladius, Cricotopus and Tanypus were additionally col- lected in Area I, especially at JHA and JHU.
Genus, such as Baetis, Orthocladius and Crico- topus are indicators for partial recovery of water quality (Ferringto and Crisp, 1989). Chironomus flaviplumus and other taxa including Hirudinea and Gastropoda were more abundantly collected at JHA. This was clearly contrasted with low
diversity observed at the nearby site JHH (Table 4, Fig. 3), where the restoration project was not conducted. This indicated that the artificial plan- ting of stones could provide refugia for benthos and consequently could be utilized for monitor- ing.
Relative abundance patterns of the selected taxa were also different at different sample sites (Fig. 3). Dominant taxa, Oligochaeta were especi- ally abundant in Area IV (86.62-90.71%) follow- ed by Area III (83.84-87.63%), while less abun- dantly collected in Area I (69.55-81.42%). At JHJ relative abundance of Oligochaetes were ex- ceptionally high with 87.67% among the sample sites in the straight area. The fact that lowest number of Oligochaeta was collected in Area I may be related to environmental conditions. En- vironmental factors such as high water velocity and large substrates composition are in general not favourable to Oligochaeta (Brinkharst, 1971).
Chironomids, the second dominant group, tend- ed to be more abundant in Area I (11.00-16.57%) than in Area III (9.31-13.52%) in contrast with the case of Oligochaeta. Chironomids further showed different abundance patterns among different sample sites in Area I and II at the straight zone (Fig. 4). Orthocladius was collected in higher densities at JHU and JHA in Area I, however, it was not much present at JHB. Cri- cotopus occurred more abundantly collected at JHU, JHA and JHB in the straight area, where
Table 4. Mean density (indi,/m2) of selected taxa, and species richness, and diversity indices of benthic macro-inver- tebrates sampled monthly at the sample sites at the Hakyeoul reach in Yangjae stream, Han River, from April 1996 to March 1998.
Area Area I Area II Area III Area IV
Sites JHU JHA JHB JHH JHI JHJ JHC JHD JHE JHF JHG
Chironomus 671 429 272 571 294 240 507 612 835 536 601
Orthocladius 73 19 2 8 1 13 13 1 17 4
Cricotopus 246 115 110 33 57 18 21 41 10 17 2
Tanypus 4 5 1 2 0 0 2 0 0 1 0
Diptera 0 2 0 0 0 0 2 0 0 1 1
Odonata 0 3 0 1 0 0 1 1 1 1 0
Baetis 2 3 1 0 0 0 1 5 0 0 0
Oligochaeta 2433 2949 1508 3705 1469 1643 4463 5207 6058 4976 5354
Hirudinea 19 142 7 17 4 4 23 5 16 3 2
Gastropoda 40 74 2 5 4 1 9 10 20 7 2
Richness 15 20 11 16 12 11 15 15 15 15 10
Diversity (H′) 0.97 1.03 0.64 0.52 0.58 0.45 0.55 0.53 0.48 0.43 0.41 Total density
(indi/m2) 3525 3795 1920 4335 1837 1907 5042 5895 6942 5560 5966
substrate diversity appeared to be high (Table 4).
The sites, JHC and JHD in Area III at the outer concaved bank and additionally JHE in Area III at the pool zone were favourable to sedi- mentation processing and consequently showed high amount of small substrate with low sub- strate diversity (Table 3 and Fig. 2). Thus this condition was preferred by burrowing types such as Oligochaeta (Fig. 3). Although located closely, community composition was also contrasted be- tween JHC and JHD. While Hirudinea were more abundantly present at JHC, Cricotopus and Baetis were collected in higher densities at JHD (Table 4 and Fig. 3). The differences in Hiru- dinea, Gastropoda and species richness were observed between JHU and JHB. This may be due to the sampling method. While macro-inver- tebrates were collected longitudinally at JHB, the samples were collected transversely for the case of JHU (Fig. 1).
Principle component analysis (PCA)
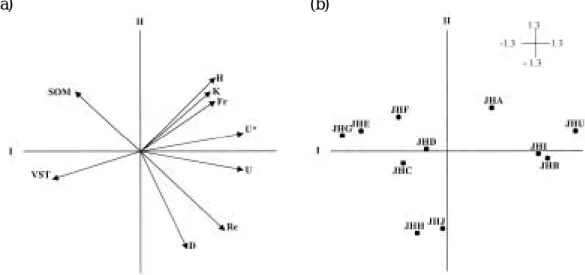
As PCA was conducted on environmental fac- tors (Eigenvalues: Axis I; 6.070 (67.45%), Axis II;
1.965 (21.83%)) (Fig. 4), SOM and VST were located against the other groups of hydraulic variables along the Axis I (Fig. 4(a)). On the positive side of the Axis I, U and U* were highly associated. Also H, K and Fr were grouped and were located in opposite to the group of Re and D. On the positive side of the Axis II, SOM was
located in opposite to VST on the negative side.
As compared with sample sites (Fig. 4(b)), JHB, JHI and JHU tended to be associated with U*
and U. JHA was located relatively apart from the other sites of Area I on the positive side (Fig.
4(b)), and tended to be associated with H, K and Fr (Fig. 4(a)). Although the degree was not strong, JHF was located in the similar area in the PCA where SOM was placed, while JHC was located in the position related to VST.
When the data of taxa were analyzed with the PCA, the group of Orthocladius, Cricotopus, Hirudinae and Gastropoda were located closely on the positive side of the Axis I (Eigenvalues:
Axis I; 2.818 (46.97%), Axis II; 2.294 (38.23%)) (Fig. 5(a)). Chironomids in this group were indi- cators of partial water recovery (Ferringto and Crisp 1989). On the negative side of the Axis II, Oligochaeta and Chironomus were located close- ly (Fig. 5(b)). The sample site of JHE tended to be associated with Oligochaeta and Chironomus.
In contrast JHU and JHA were more closely re- lated to the group of species indicating water recovery (Figs. 4(a) and 4(b)).
Considering Figs. 4(a) and 4(b) together the sample sites located in the straight area (Area I and Area II) appeared more strongly related to water velocity and shear velocity. Similarly JHA and JHU in the straight area strongly associated the group of diverse taxa including species indi- cating water recovery such as Orthocladius and Cricotopus (Figs 5(a) and 5(b)). Especially, it is
Fig. 4. Principle component analysis on average values of hydraulic measurement at eleven sample sites at the Hakyeoul reach in Yangjae stream, Han River, from April 1996 to March 1998. a) Hydraulic measurements and b) Sample sites. (Eigenvalues: Axis I; 6.070 (67.45%), Axis II; 1.965 (21.83%))
(a) (b)
notable that JHA, where large substrates were artificially transplanted for the project of res- toration, was associated with species indicating water recovery. Additionally, the sample site located in Area IV tended to be associated with SOM (Fig. 4), and JHE was located correspon- dingly to the group of Oligochaeta and Chiro- nomus (Fig. 5). However, the degree of associa- tion appeared to be not as strong as shown in the case of the sample sites, JHA and JHU associat- ed with U and U* (Fig. 4) and the taxa such as Orthocladius, Cricotopus, Hirudinae and Gastro- poda (Fig. 5). This indicated that the habitats with large substrates and high velocity in the straight area have higher association with the corresponding taxa mentioned above. In this case, however, we only used average data with 11 sample sites (cases) for the PCA. Thus the number of sample sites exceeds the number of hydraulic characters (9) and the number of taxa (6) used for the analyses. This may not provide efficient grouping on the sample sites (Q-mode).
Additionally non-linearity may be resided in the data. Further study is required to verify these associations by increasing the number of sample units as well as by development of analytical tools applicable to non-linear data. Also the de- tailed description among the sample collected in curvilinear shape in the islets at the pool zone needs to be further investigated, and this will be discussed elsewhere.
CONCLUSION
In small-scale survey in 10 m in distance in a polluted stream, hydraulic parameters and com- munity abundance patterns of benthic macro- invertebrates were differently characterized according to location of sample sites. At the sam- ple sites in the straight zone with high water velocity and large substrates, species richness was relatively higher and species less-tolerant to organic pollution was additionally present. At the sample sites in the pool zone with lower velo- city and high sedimentation, species richness was lower and a few tolerant species to organic pollution were abundantly collected. The prin- ciple component analysis indicated that the sam- ple sites in the straight zone appeared to be related to water velocity and shear velocity, and correspondingly to diverse taxa less tolerant to organic pollution. Especially the sample site transplanted with large substrates was associat- ed with hydraulic characters such as substrate diversity and roughness, and further related to indicator species for partial recovery of water.
Additionally the sample sites located at the pool zone were associated in some degree with sedi- ment organic matter and taxa tolerant to organic pollution such as Oligochaeta and Chironomus.
Fig. 5. Principle component analysis on densities (individuals per square meter plus 1) benthic macro-invertebrate communities collected at the Hakyeoul reach in Yangjae stream, Han River, from April 1996 to March 1998. a) Selected taxa and b) sample sites. (Eigenvalues: Axis I; 2.818 (46.97%), Axis II; 2.294 (38.23%))
(a) (b)
ACKNOWLEDGEMENTS
This research was supported by a G7 project (1996-1999), ‘Development of Conservation, Re- habilitation and Creation Techniques of Natural Environment for the Coexistence of Man with Nature’, funded by the Ministry of Environment, Korea.
REFERENCES
APHA, AWWA and WPCF. 1985. Standard methods for the examination of water and waste (16th ed.).
Washington D.C. 1134p.
Brighnam, A.R., W.U. Brighnam and A. Gnika. 1982.
Aquatic insects and Oligochaetea of North and South Carolina. Midwest Aquatic Enterprise.
Brinkhurst, R.O. and B.G.M. Jamieson. 1971. Aqua- tic Oligochaeta of the World. Oliver & Body Edin- burgh.
Brinkhust, R.O. 1986. Guide to the Freshwater Aqu- atic Microdrile Oligachaetes of North America.
Canadian Special Publication of Fidheries and Aquatic Sciences 84. 259p.
Coddington, J.A. 1988. Cladistic tests of adaptational hypotheses. Cladistics. 4: 3-22.
Cummins, K.W. and G.H. Lauff. 1969. The influence of substrate particle size on the microditribution of stream macrobenthos. Hydrobiologia. 34: 145- 181.
Ferringto, L.C., Jr. and N.H. Crisp. 1989. Water che- mistry characteristics of reveiving streams and the occurrence of Chironomus riparius and other chironomidae in Kansas. Acta Biol. Debr. Oecol.
Hung. 3: 115-126.
Fisher, S.G. 1990. Recovery processes in lotic ecosys- tems : limits of successional. Environmental Ma- nagement. 14: 725-736.
Frissell, C.A., W.J. Liss, C.E. Warren and M.D.
Hurley. 1986. A hierarchical framework for stre- am habitat classification: viewing streams in a watershed context. Environmental Management.
10: 199-214.
Giller, P.S., A.G. Hildrew and D.G. Raffaelli. (Edi- tors). 1994. Aquatic ecology: scale, pattern, and process. Blackwell Scientific Publications, Lon- don.
Hellawell, J.M. 1986. Biological indicators of fresh- water pollution and environmental management.
Elsevier, London and New York. 546p.
Hildrew, A.G., C.R. Townsend and J. Henderson.
1980. Interactions between larval size, microdi- stribution and substrate in the stoneflies of an iron-rich stream. Oikos. 35: 387-396.
Hubbell, S.P. and R.B. Foster. 1986. Biology, chance,
and history and the structure of tropical rain for- ests. Pages 314-330 in J. Diamond and T. Case (editors). Community ecology. Harper and Row, New York.
Hynes, H.B.N. 1970. The ecology of running waters.
Liverpool University Press, Liverpool. 555p.
KICT (Korea Institute of Construction Technology) 1997. Development of close-to-nature river im- provement techniques (CTNRIT) adapted to the Korean streams. Report 2.
Kwak, I.S. 2001. Implementation of artificial neural network on spatio-temporal variation and bio- indicator study on benthic macro-invertebrates.
Ph.D Thesis in Pusan National University. 186pp.
Levin, S.A. 1992. The problem of pattern and scale in ecology. Ecology. 73: 1942-1967.
Merritt, R.W. and K.W. Cummins. 1984. An Intro- duction to the Aquatic Insects of North America.
Hunt Publishing Company, Dubugue. 722p.
Minshall, G.W., R.C. Petersen, K.W. Cummins, T.L.
Bott, J.R. Sedell, C.E. Cushing and R.L. Vannote.
1983. Interbiome comparison of stream ecosystem dynamics. Ecol. Monogr. 53: 1-25.
Minshall, G.W. 1984. Aquatic insect-substratum relationships. Pages 384-400 in V.H. Resh and D.
M. Rosenberg (editors). The ecology of aquatic insects. Praeger Publishers, New York.
Pennak, R.W. 1978. Fresh-water Invertebrates of the United States. John Wieley & Sons, Inc., New York. 803p.
Quigley, M. 1977. Invertebrates of streams and ri- vers. Edward Arnord (publishers) Ltd., Colche- ster. 84p.
Resh, V.H., A.V. Brown, A.P. Covich, M.E. Gurtz, H.W. Li, G.W. Minshall, S.R. Reice, A.L. Sheldon, J.B. Wallace and R. Wissmar. 1988. The role of disturbance in stream ecology. Journal of the North American Benthological Society. 7: 433- 455.
Resh V.H., Hildrew A.G., Statzner B. and C.R.
Townsend. 1994. Theoretical habitat templets, species traits and species richness: A synthesis of long-term ecological research on the Upper Rho- ne River in the context of concurrently developed ecological theory. Freshwater Biology. 31: 539- 554.
Simpson, E.H. 1949. Measurement of diversity. Na- ture, 163: 688
Sláde ˇcek, V. 1979. Continental systems for the asse- ssment of river water quality, p. 3.1-3.32. In: Bio- logical indicators of water quality (A. James and L. Evison, eds.), John Wiley and Sons, Chichester, Great Britain.
Statzner, B., J.A. Gore and V.H. Resh. 1988. Hydra- ulic stream ecology: observed patterns and poten- tial applications. Journal of North American Ben- thological Society. 7: 307-360.
Surber, E.W. 1937. Rainbow trout and fauna produc-
tion in one mile of stream. Trans. Amer. Fish.
Soc., 1-66.
Tilman, D. 1994. Competition and biodiversity in spatially structured habitats. Ecology. 75: 2-16.
Turner, M.G. and R.H. Gardner. (Editors) 1991. The analysis and interpretation of landscape hetero- geneity. Springer-Verlag, New York.
Wiederholm, T. 1983. Chironomidae of the Holactic Region. Keys and Diagnoses. (Part 1. Larvae).
Ent. Scand. Suppl. 19. 457p.
Wrona, F.J., P. Calow, I. Ford, D.J. Baird and L.
Maltby. 1986. Estimating the abundance of stone -dwelling organisms: a new method. Canadian Journal of Fisheries and Aquatic Sciences. 43:
2025-2035.
Yun, Il-Byong. 1988. Illustrated Encyclopedia of Fauna and Flora of Korea Vol. 30. (Aquatic in- sects), Ministry of Education, Seoul. 840p.
(Received 25 Oct. 2002, Manuscript accepted 10 Dec. 2002)
⁄ ¤
오염하천 소규모 서식처에서의 저서성 대형 무척추 동물군집과 수리학적 인자의 특성화
곽인실∙
Guangchun Liu
1∙박용석2∙송미영∙전태수*(부산대학교 생물학과, 1Dept. of Agriculture, Shenyong Univ. P.R. China,
2CESAC UMR, CNRS-Universite Paul Sabatier, France)
1996년 4월부터 1998년 3월까지 서울의 한강지류3차 하천인 양재천 200 m 구간에서 저서성 대 형 무척추동물을 채집하였다. 유기물 오염으로 인해 종풍부도가 상대적으로 낮았지만 군집 풍부도 양상은 조사지점에 따라 다르게 나타났다. 유속이 높고 큰 하상구성물이 많은 직류부 조사지점에 서는 종풍부도가 높았고, 유기물오염에 상대적으로 내성이 낮은 종들이 추가적으로 출현하였다. 반 대로 유속이 느리고 퇴적이 많이 이루어진 소(pool)에 위치한 조사지점에서는, 종풍부도는 낮았고, 유기오염물에 내성이 강한 수 종이 많이 채집되었다. 중요요인분석에서 직류부의 조사지점은 유속, 마찰유속(shear velocity)과 관련성이 있었고, 유기물오염에 내성이 비교적 낮은 다양한 종들과 연 관성을 나타냈다. 특히 큰 하상구성물을 심은 지점은 하상구성물의 다양도나 조도(roughness)와 같은 수리학적(hydraulics) 특징과 관련되었고, 하천의 부분적 회복을 나타내는 종들과 관계가 있 었다. 소에 위치하는 조사지점은 하상구성물에 퇴적한 유기물과 유기물오염에 내성이 강한 빈모류 나 깔따구류와 연관을 나타내었다.
(부산대학교 생물학과, 1Dept. of Agriculture, Shenyang Univ. P.R. China,
2CESAC UMR, CNRS-Universite Paul Sabatier, France)