필지단위 관개용수 공급에 따른 농업가뭄진단 평가
Agricultural Drought Assessment and Diagnosis Based on Spatiotemporal Water Supply in Irrigated Area
신지현a⋅남원호b,†⋅김하영a⋅문영식c⋅방나경d⋅이정철e⋅이광야f Shin, Ji-Hyeon⋅Nam, Won-Ho⋅Kim, Ha-Young⋅Mun, Young-Sik⋅
Bang, Na-Kyoung⋅Lee, Jueng-Chol⋅Lee, Kwang-Ya ABSTRACT
Agricultural drought is a natural phenomenon that is not easy to observe and predict and is difficult to quantify. In South Korea, the amount of agricultural water used is large and the types of use are varied, so even if an agricultural drought occurs due to insufficient precipitation, the drought actually felt in the irrigated area is it can be temporally and spatially different. In order to interpret the general drought in the past, drought disasters were evaluated using single indicators such as drought damage area, precipitation shortage status, and drought index, and a comprehensive drought management system is needed through drought diagnosis survey. Therefore, we intend to conduct research on agricultural drought assessment and diagnosis using re-evaluation of agricultural facilities and irrigation water supply network due to changes in various conditions such as climate change, irrigation canal network, and evaluation of water supply capacity of agricultural facilities. In this study, agricultural drought diagnosis was conducted on two agricultural reservoirs located in Sangju, Gyeongsangbuk-do, with structural or non-structural evaluations to increase spatiotemporal water supply and efficiency in terms of water shortages. The results of the agricultural drought diagnosis evaluation can be used to identify irrigated areas and canal network vulnerable to drought and to prioritize drought response.
Keywords: Agricultural drought; irrigation; drought diagnosis; reservoir; water supply
Ⅰ. 서 론
전 지구적인 급격한 기상변화와 태풍의 강도 증가, 호우, 폭설과 한파의 잦은 내습, 극심한 가뭄 등 급격한 이상기상이 발생하고 있으며 (Jang and Kim, 2008; Lee et al., 2020), 사회
적, 경제적, 환경적 피해를 발생시키는 가뭄의 강도 및 발생 빈도가 증가하는 추세이다 (Wilhite et al., 2000; Yoon et al., 2020). 가뭄은 진행속도가 느리고 광범위하게 발생하며, 농업 가뭄은 관측과 예측이 용이하지 않고 정량적으로 나타내기 어려운 자연현상이다. 우리나라의 경우 농업용수 이용의 형 태가 다양하므로 강수 부족으로 인한 농업가뭄 발생 시 실제 로 농업현장에서 느끼는 가뭄은 시· 공간적으로 다를 수 있다 (Jang, 2019; Jeon et al., 2021).
농업 수리 시설물 설치 후 30년 이상 경과된 비율은 전체시 설물 중 61%, 저수지의 경우 96%로 수리 시설물의 노후화가 심각하며, 기후변화 및 영농변화 등 여건변화에 대한 시설물 공급능력 재검토가 필요하다 (Ahn et al., 2009; Lee, 2019).
과거 일반적인 가뭄을 해석하기 위해 가뭄 피해 면적, 강수량 부족 현황, 가뭄지수 등 단일지표를 활용하였으나 (Tadesse et al., 2005; Hong et al., 2016; Lee et al., 2019; Mun et al., 2020), 현재 기후변화 환경조건을 반영하는 가뭄진단 조사를 통하여 치수 중심 수리 시설물 관리에서 용수공급능력 등 이 수 능력을 병행한 가뭄종합관리 체계 구축이 필요하다. 따라 서, 기후변화 적응을 위한 농업용 수리시설 내한능력 및 용수 공급능력 평가 등 농업가뭄진단에 관한 연구가 필수적이다.
현재 가뭄을 평가하기 위해 기후학적 인자를 고려하는 가 뭄지수가 주로 사용되고 있으며, 단일의 가뭄 지표가 지역 및 관련 분야의 가뭄 평가에 이상적이지 않다는 지적이 제시되
aGraduate Student, School of Social Safety and Systems Engineering, Hankyong National University, Anseong, Republic of Korea
b Associate Professor, School of Social Safety and Systems Engineering, Institute of Agricultural Environmental Science, National Agricultural Water Research Center, Hankyong National University, Anseong, Republic of Korea
c Graduate Student, Department of Bioresources and Rural Systems Engineering, National Agricultural Water Research Center, Hankyong National University, Anseong, Republic of Korea
d Ph.D. Studendt, Department of Convergence of Information and Communication Engineering, Hankyong National University, Anseong, Republic of Korea
e Director, Overseas Project Department, Korea Rural Community Corporation, Naju, Republic of Korea
f Director, Integrated Water Management Supporting Department, Water Resources Planning Office, Korea Rural Community Corporation, Sejong, Republic of Korea
† Corresponding author
Tel.: +82-31-670-5137, Fax: +82-31-670-5139 E-mail: [email protected]
Received: March 30, 2021 Revised: May 11, 2021 Accepted: May 11, 2021
고 있다 (Hayes et al., 2004; Nam et al., 2015, Bang et al., 2018). 지역별 가뭄지표 적용 및 가뭄 평가에 대한 연구로서, Park et al. (2011)은 경상도 지역을 대상으로 가뭄의 공간적인 위험도 평가를 위해 노출성 지수와 취약성 지수를 결합하여 가뭄 위험도를 분석하였다. Park et al. (2012)은 유효가뭄지수 (Effective Drought Index, EDI)를 활용하여 가뭄의 심도를 정 량화하고, 가뭄 취약 정도를 나타내어 주는 사회경제적 인자 를 선정하여 가뭄위험도를 평가하였다. Jung et al. (2020)은 기상학적 빅데이터 가뭄지수 (Meteological Bigdata Drout Index, MBDI)와 수문학적 빅데이터 가뭄지수 (Hydrological Bigdata Drought Index, HBDI)를 활용하여 충청남도 지역의 가뭄을 평가하였다. 이러한 연구들은 지역별 가뭄지표 적용 및 가뭄지수를 통해 가뭄 경향, 가뭄빈도와 가뭄 심도 등 대략 적인 가뭄의 특성을 파악할 수 있지만 정확한 가뭄 분석 및 원인 파악에 한계가 있다. 또한 다중지표의 가뭄평가 적용에 대한 연구의 경우 주로 계층화분석 (Analytic Hierarchy Process, AHP) 방법을 활용하고 있다. Ridgley (1993)는 가뭄 시 농업용수 공급 방법에 대하여 계층화분석 (Analytic
Hierarchy Process, AHP)을 적용하여 효율적인 용수분배 방안 을 제시하였으며, Lee and Shim (2002)은 가뭄 시 농업용수 배분의 우선순위 결정을 위해 AHP 분석을 활용하여 상대적 가중치와 대안의 우선순위를 결정하였다. Mun et al. (2020)은 AHP 분석을 활용하여 기상자료 및 저수율 등 수문· 기상학적 자료를 기반으로 농업용수의 가뭄 취약성 평가방법론을 제시 하였다.
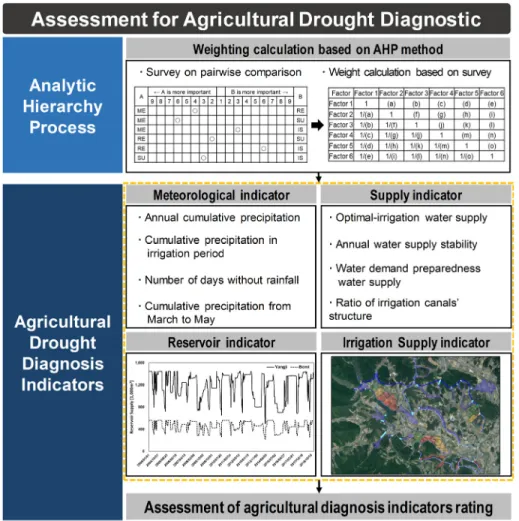
최근 농업용 수리시설물 노후화로 인해 내한능력이 감소하 였으며, 기후변화 및 영농변화 등 여건변화에 따른 시설물 공 급능력 평가 연구가 필요하다. 따라서, 본 연구에서는 농업용 수 수리시설물 노후화에 따른 변화된 내한능력 및 용수공급 능력 평가와 수원공과 평야부를 포함한 광역단위 지구의 농 업가뭄 상황을 종합적으로 진단할 수 있는 농업가뭄진단 방 법론을 제시하고자 한다. 기상, 저수지, 공급량, 관개율 지표 4개의 중분류 항목과 16개 세부항목을 구분하고, 전문가 설문 기반 AHP 분석을 활용하여 세부항목에 대한 가중치를 산정 하여, 양지 저수지와 보미 저수지를 대상으로 농업가뭄진단 평가를 수행하고자 한다.
Fig. 1 Location of watershed, irrigated areas and irrigation canals in Yangji and Bomi reservoir, Gyeongsangbuk-do
Ⅱ. 재료 및 방법 1. 연구 대상 지역
연구 대상지는 경상북도 상주시 화동면 양지리에 위치한 양지 저수지와 경상북도 상주시 화동면 보미리에 위치한 보 미 저수지를 대상지구로 선정하였다. Fig. 1과 Table 1은 각각 대상 저수지 간선의 위치와 현황을 나타낸다. 양지 저수지는 1998년 준공된 유효저수량은 1446.0 천m3이며, 유역면적 630 ha, 수혜면적 91 ha, 유역배율 16.6의 10년 한발빈도 규모로 설계되었다. 풍전 저수지의 경우 1998년 준공된 유효저수량 은 557 천m3이며, 유역면적 430 ha, 수혜면적 110.3 ha, 유역배 율 5.3의 10년 한발빈도 규모로 설계되었다. 현재 양지, 보미 저수지의 수혜면적은 각각 107 ha, 98 ha로 축조된 당시보다 양지 저수지의 경우 16 ha 증가하였으며, 보미 저수지는 12 ha 감소하였다.
수혜면적에 비하여 저수량이 상대적으로 큰 양지 저수지의 용수를 보미 저수지에 연결하여 양지 저수지에서 보미 저수 지의 수혜구역에 공급하며, 양지 저수지에서 분기된 용수로 가 보미 저수지 시점부에 합류하여 보미저수지의 수혜구역으 로 공급한다. 용수계통도의 경우 양지 저수지는 21개의 필지 와 1개의 간선 (양지간선) 및 3개의 지선 (양지1지선, 양지2지 선, 양지3지선)으로 이루어져있으며, 보미 저수지는 18 개의 필지와 1개의 간선 (보미1간선) 및 2개의 지선 (보미1지선, 반곡지선)으로 축조되었다.
2. 농업가뭄진단 지표
농업가뭄진단 평가 인자는 Table 2와 같이 기상 지표 (Meteorological indicator, ME), 저수지 지표 (Reservoir indicator, RE), 공급량 지표 (Supply indicator, SU), 관개율 지 표 (Irrigation supply indicator, IR) 4개의 중분류 항목과 16개 세부항목 항목으로 구분하였으며, 각 지표별 분석기간은 2019년을 대상으로 하였다. 기상 지표는 지역의 기후변화 영 향평가를 위한 지표로 세부항목의 경우 연 누적강수량 (ME1), 관개기 누적강수량 (ME2), 관개기 무강우일수 (ME3), 3∼5월 누적강수량 (ME4) 4가지로 구분하였다. 기상자료는 기상청에 서 제공하는 종관기상관측장비 (Automated Surface Observing
System, ASOS)를 통해 수집하였다.
저수지 지표는 수원공의 용수공급능력 평가를 위한 지표로 세부항목의 경우 저수지 용량 가뭄빈도 (RE1), 과거 저수율 관리 (RE2), 농업용수잠재능 (RE3), 저수지 물순환율 (RE4) 4가지로 구분하였다. 농업용수잠재능 (RE3)은 이수안전 저수 지의 적지선정 기준으로 제안되었으며, 수혜면적의 단위 면 적당 연간 공급될 수 있는 저수지 유입량을 의미한다 (Kim et al. 2016). 저수지 물순환율 (RE4)은 농업용수 공급효율 분 석을 위해 유효저수량 대비 공급량 비율을 통해 산정하며, 저 수율 자료는 한국농어촌공사 농촌용수종합정보시스템 (Rural Agricultural Water Resource Information System, RAWRIS) 자 료를 활용하였다.
공급량 지표는 용수로의 용수분배능력과 저수지의 공급효 율을 평가하기 위한 지표로 세부항목의 경우 적정관개량 공 Name Construction
completed year (year)
Watershed area
(ha)
Irrigated area
(ha)
Design frequency of drought
(year)
Unit reservoir storage (103 m3/ha)
Effective storage capacity
(103 m3)
Yangji 1998 63091 1016.6 1,446
Bomi 1998 430110 10 5.3 557
Table 1 Specifications of Yangji and Bomi reservoirs and the irrigated areas
Indicator Code Sub-indicator Code
Meteoro- logical indicator
ME
Annual cumulative precipitation ME1 Cumulative precipitation in irrigation
period ME2
Number of days without precipitation ME3 Cumulative precipitation from March
to May ME4
Reservoir indicator RE
Reservoir capacity drought frequency RE1 Historical reservoir storage rate
management RE2
Agricultural water supply potential RE3 Agricultural reservoir circulation rate RE4
Supply indicator SU
Optimal-irrigation water supply SU1 Annual water supply stability SU2 Water demand preparedness water
supply SU3
Structuring ratio of irrigation canals SU4
Irrigation supply indicator
IR
Average irrigation rate IR1 Irrigation vulnerability IR2
Irrigation uniformity IR3
Percentage of irrigation area in
multi-reservoir IR4
Table 2 Indicators for diagnosis of agricultural drought
급량 (SU1), 연 공급량 안정 (SU2), 수요량 대비 공급량 (SU3), 용수로의 구조화 비율 (SU4) 4가지로 구분하였다. 연 공급량 안정성 (SU2)은 연도별 농업용수 공급량의 표준편차를 평균 으로 나누어 산정하며, 지표가 커질수록 해마다 용수공급량 이 달라 공급 안정성이 떨어지는 것으로 판단한다.
관개율 지표는 평야부 들녘단위의 용수공급 만족도를 평가 하기 위한 지표로 세부항목의 경우 평균 관개율 (IR1), 관개 취약성 (IR2), 관개 균일도 (IR3), 보조수원공 수혜면적 비율 (IR4) 4가지로 구분하였다. 관개 취약성 (IR2)은 전체 관개율 이 높아도 일부 필지는 계속해서 용수 부족을 겪을 수 있어 이를 평가하기 위한 지표이며 평균 관개율 (IR1), 관개 취약성 (IR2), 관개 균일도 (IR3)는 수로 네트워크 모의를 통해 분석 하였다.
3. 계층화 분석 (Analytic Hierarchy Process: AHP) AHP 분석은 인자들을 계층적으로 분류하여 중요도를 파 악하는 기법으로 전문가 설문을 통해 대안들을 순위화시키고,
비율 척도 (ratio scale)로 가중치를 도출하는 방법으로 (Satty, 1980; Mun et al., 2020) 정량적 자료와 정성적 자료도 함께 고려할 수 있는 분석방법이다 (Choi et al., 2020). 설문 결과를 활용하여 쌍대비교 행렬식에 가중치 벡터를 곱하는 과정을 거쳐 평가항목에 대한 중요도의 합이 1이 되도록 추정치를 환산함으로써 각 평가항목의 가중치를 산정한다 (Kim and Jung, 2020).
⋮ ⋮ ⋮ ⋯ ⋮ ⋯ ⋯ ⋯ ⋯ (1)
AHP 설문은 전문성을 요구하는 의사결정 단계에서 활용 되며, 일반적인 설문조사와 달리 적은 표본수로도 의사결정 에 유의한 결과를 얻을 수 있다 (Saaty, 2008). 본 연구에서는 농업수자원 및 가뭄 관련 전문가 (학계 5명, 공사 14명, 기타
Fig. 2 Flow chart of agricultural drought diagnosis evaluation based on AHP analysis
1명) 20인을 대상으로 설문을 진행하였으며, 진단지표는 4개 의 중분류와 16개의 세부항목을 대상으로 설문을 진행하였다.
설문 결과를 활용하여 중분류와 세부항목 가중치를 산정하였 으며, 일관성 지수 (Consistency Index, C.I)를 활용하여 쌍대비 교를 통해 가중치의 일관성을 검증하였다. 식 (2)는 일관성 지수 산정식을 나타내며, max는 최대고유값, 은 비교되는 기준의 수를 의미한다. 일관성 비율이 0일 경우 쌍대비교 행 렬이 완전한 일관성을 가지며, 일관성 비율이 0.1 이하일 때 일관성이 있다고 판단한다 (Hafeez et al., 2002; Ezatollah, 2006).
max (2)
4. 농업가뭄진단 평가방법론
농업가뭄진단 평가등급은 각각의 지표에 대해 A부터 D등 급까지 산정하여 각 등급에 해당하는 평가지수 값에 전문가 AHP 분석을 통해 도출된 가중치를 곱하여 종합평가지수를
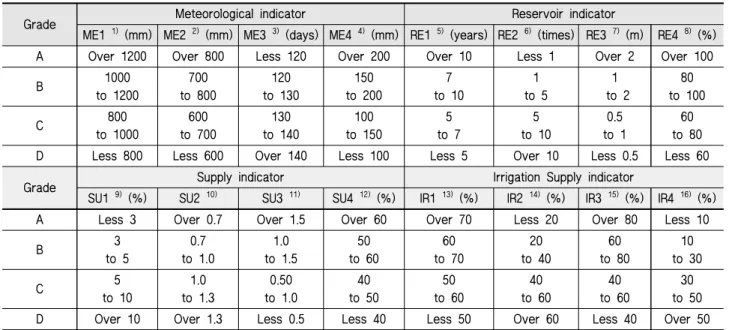
산정하여 평가하였으며, 연구흐름도는 Fig. 2와 같다. 농업가 뭄진단 평가를 위해 구체적인 인자별 평가 기준 설정을 하였 으며, Table 3은 세부항목 등급화 자료를 나타낸다 (Lee et al., 2018).
Ⅲ. 적용 및 고찰 1. AHP 가중치 분석
AHP 분석을 위해 가뭄진단을 위한 요소의 계층화 구조를 설정하였으며, 농업수자원 및 가뭄 관련 종사자, 학계 및 공공 기관 중심의 전문가 20명을 대상으로 설문을 진행하였다. 인 자별 가중치 산정 후 상관성 지수 분석을 통해 가중치의 일관 성을 검증하였으며, 중분류 가중치와 세부항목 가중치를 곱 하여 최종가중치를 산정하였다.
Fig. 3은 AHP 분석을 활용하여 산정한 농업가뭄진단 평가 중분류 및 세부항목 인자의 가중치를 나타낸다. 가중치 산정 결과는 중분류의 경우 관개율 지표 (IR) 0.323, 공급량 지표
Grade Meteorological indicator Reservoir indicator
ME1 1) (mm) ME2 2) (mm) ME3 3) (days) ME4 4) (mm) RE1 5) (years) RE2 6) (times) RE3 7) (m) RE4 8) (%)
A Over 1200 Over 800 Less 120 Over 200 Over 10 Less 1 Over 2 Over 100
B 1000
to 1200
700 to 800
120 to 130
150 to 200
7 to 10
1 to 5
1 to 2
80 to 100
C 800
to 1000 600
to 700 130
to 140 100
to 150 5
to 7 5
to 10 0.5
to 1 60
to 80
D Less 800 Less 600 Over 140 Less 100 Less 5 Over 10 Less 0.5 Less 60
Grade Supply indicator Irrigation Supply indicator
SU1 9) (%) SU2 10) SU3 11) SU4 12) (%) IR1 13) (%) IR2 14) (%) IR3 15) (%) IR4 16) (%)
A Less 3 Over 0.7 Over 1.5 Over 60 Over 70 Less 20 Over 80 Less 10
B 3
to 5
0.7 to 1.0
1.0 to 1.5
50 to 60
60 to 70
20 to 40
60 to 80
10 to 30
C 5
to 10
1.0 to 1.3
0.50 to 1.0
40 to 50
50 to 60
40 to 60
40 to 60
30 to 50
D Over 10Over 1.3 Less 0.5 Less 40 Less 50 Over 60Less 40Over 50
1) Annual cumulative precipitation 2) Cumulative precipitation in irrigation period
3) Number of days without precipitation 4) Cumulative precipitation from March to May
5) Reservoir capacity drought frequency 6) Historical reservoir storage rate management
7) Agricultural water supply potential 8) Agricultural reservoir Circulation rate
9) Optimal-irrigation water supply 10) Annual water supply stability
11) Water demand preparedness water supply 12) Structuring ratio of irrigation canals
13) Average irrigation rate 14) Irrigation vulnerability
15) Irrigation uniformity 16) Percentage of irrigation area in multi-reservoir
※ Evaluation rating score: A (10), B (7.5), C (2.5), D (0)
Table 3 Classification of grade indicators for agricultural drought diagnosis
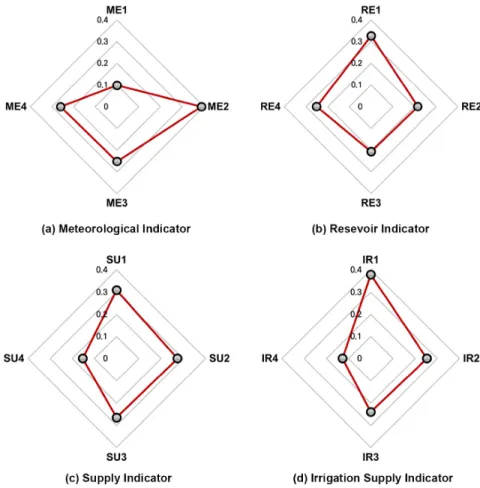
(SU) 0.259, 저수지 지표 (RE) 0.250과 기상 지표 (ME) 0.168 로 관개율 지표 (IR)가 가장 높게 분석되었으며, 기상 지표 (ME)가 가장 낮은 가중치를 나타냈다. 세부항목 가중치 산정 결과는 기상 지표 (ME)의 경우 관개기 누적강수량 (ME3) 0.389로 가장 높게 나타났으며, 3∼5월 누적강수량 (ME4) 0.260, 관개기 무강우일수 (ME3) 0.252, 연 누적강수량 (ME1) 0.098로 연 누적강수량 (ME1)이 가장 낮게 분석되었다. 저수 지 지표 (RE)는 저수지 용량 가뭄빈도 (RE1) 0.326으로 가장 높게 나타났으며, 저수지 물순환율 (RE4) 0.251, 과거 저수율 관리 (RE2) 0.215와 농업용수잠재능 (RE3) 0.207로 분석되었 다. 공급량 지표 (SU)의 경우 적정관개량 공급량 (SU1) 0.309 로 가장 높게 분석되었으며, 연 공급량 안정성 (SU2) 0.274, 수요량 대비 공급량 (SU3) 0.265, 용수로의 구조화 비율 (SU4) 0.152로 용수로의 구조화 비율 (SU4)이 가장 낮게 분석되었 다. 관개율 지표 (IR)의 경우 평균 관개율 (IR1) 0.379로 가장 높게 분석되었으며, 관개 취약성 (IR2) 0.253, 관개 균일도 (IR3) 0.240, 보조수원공 수혜면적 비율 (IR4) 0.127로 보조수 원공 수혜면적 비율 (IR4)이 가장 낮은 것으로 나타났다.
AHP 분석을 통해 산정한 가중치의 일관성을 검증하기 위
해 일관성 지수 (C.I)를 활용하였으며, Table 4는 중분류와 중 분류별 세부항목 가중치에 대한 일관성 지수 분석결과를 나 타낸다. 중분류 0.010, 기상 지표 0.004, 저수지 지표 0.012, 공급량 지표 0.014, 관개율 지표 0.018로 분석되었으며, 모두 0.1 이하로 합리적인 일관성을 갖는 것으로 판단된다.
List Values
Indicators 0.010
Meteorological indicator 0.004
Reservoir indicator 0.012
Supply indicator 0.014
Irrigation Supply indicator 0.018 Table 4 Analysis result of consistency index
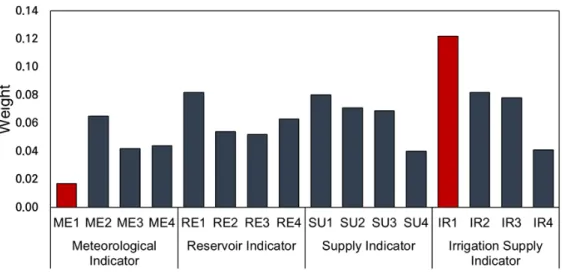
Fig. 4는 중분류 가중치와 세부항목 가중치를 곱하여 산정 한 농업가뭄진단 평가 인자의 최종가중치를 나타낸다. 기상 지표 (ME)의 경우 연누적강수량 (ME1) 0.017, 관개기 누적강 수량 (ME2) 0.065, 관개기 무강우일수 (ME3) 0.042, 3∼5월 누적강수량 (ME4) 0.044로 나타났으며, 저수지 지표 (RE)는 Fig. 3 Results of weighting coefficient based on AHP method (reference: CODE of Table 2)
저수지 용량 가뭄빈도 (RE1) 0.082, 과거 저수율 관리 (RE2) 0.054, 농업용수잠재능 (RE3) 0.052, 저수지 물순환율 (RE4) 0.063으로 분석되었다. 공급량 지표 (SU)의 경우 적정관개량 공급량 (SU1) 0.080, 연 공급량 안정성 (SU2) 0.070, 수요량 대비 공급량 (SU3) 0.069, 용수로의 구조화 비율 (SU4) 0.040 으로 분석되었으며, 관개율 지표 (IR)는 평균 관개율 (IR1)
0.122, 관개 취약성 (IR2) 0.082, 관개 균일도 (IR3) 0.077, 보조 수원공 수혜면적 비율 (IR4) 0.041로 나타났다. 지역의 기상 및 수원공의 규모보다 용수분배능력과 용수공급상황이 중요 한 것으로 판단된다. 관개기 누적강수량 (RE2), 저수지 용량 가뭄빈도 (RE1), 적정관개량 공급량 (SU1), 평균 관개율 (IR1) 이 높은 가중치로 분석되었으며, 평균 관개율 (IR1)이 0.122로 Fig. 4 Comparison of final weighting coefficient based on AHP method (reference: CODE of Table 2)
Fig. 5 Comparison of irrigation water distribution simulation result for irrigated areas ((a): 2016, (b): 2017, (c): 2018, (d): 2019)
가장 높은 가중치로 나타났다.
2. 필지단위 농업용수 공급 분석
관개율 지표 (IR)를 평가하기 위해 한국농어촌공사 농업기 반시설관리시스템 (Rural Infrastructure Management System, RIMS)의 저수량 데이터를 활용하여 SWMM (Storm Water Management Model) 모형에 적용하였으며, 농업용수 분배 모 형의 모의조건은 목표 담수심 도달 후 수혜구역의 용수공급 을 중단하도록 설정하였다. 초기담수심과 목표담수심은 각각 0 mm, 60 mm로 설정하였으며, 수문 개도율은 100%로 설정 하였다. 모의기간 대비 목표담수심 도달 기간 비율에 따라 파 란색의 경우 80% 이상으로 목표담수심 도달 일수가 모의기간 153일 중 122일 이상 만족, 녹색의 경우 60%에서 80%로 91일 에서 122일 만족, 노란색의 경우 40%에서 60%로 61일에서 91일 만족, 주황색의 경우 20%에서 40%로 30일에서 61일 만 족, 붉은색의 경우 20% 이하로 30일 이하 만족으로 평가한다 (Shin et al., 2020a; Shin et al., 2020b).
Fig. 5는 2016년부터 2019년까지 관개기 (5∼9월)의 SWMM 모형을 활용한 농업용수 공급 모의결과를 나타내며, (a)는 2016년, (b)는 2017년, (c)는 2018년, (d)는 2019년 모의결과를 나타낸다. 양지 저수지의 경우 상류부는 60% 이상의 용수공 급 효율이 나타나며, 하류부의 경우 40% 이하의 공급효율을 나타낸다. 양지1간선은 80% 이상으로 용수공급이 매우 잘 이 루어진 것으로 판단된다. 보미 저수지의 경우 하류부를 제외 한 모든 수혜구역에 60% 이상의 공급효율을 나타낸다. 2017 년의 경우 양지, 보미 저수지 모두 공급량 부족으로 상대적으 로 낮은 공급효율을 나타내며, 하류부보다 상류부 수혜구역 에 농업용수 분배가 효과적으로 이루어진 것으로 나타났다.
Indicator Code Yangji reservoir Bomi reservoir
Irrigation supply indicator
IR1 49 70
IR2 11 3
IR3 34 25
IR4 00
* Units: percentage (%)
Table 5 Result of calculating irrigation supply indicator in Yangji and Bomi reservoir (reference: CODE of Table 2)
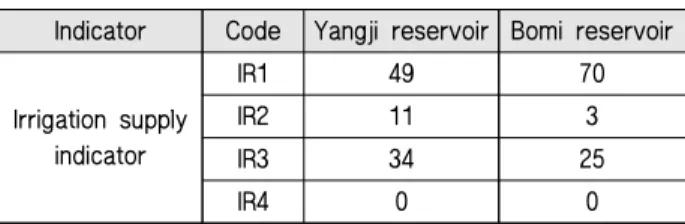
Table 5는 SWMM 모의를 통해 산정한 양지, 보미 저수지 의 관개율 지표 평가 인자 결과를 나타낸다. 평균 관개율 (IR1)의 경우 과거 15년간 연도별로 담수심 기반 관개율을 산 정한 후 이를 평균하였으며, 양지 저수지 49%, 보미 저수지 70%로 보미 저수지 수혜구역의 담수심이 높은 것으로 나타났
다. 관개 취약성 (IR2)은 관개율이 40% 이하의 필지 면적 비율 을 산정하여 분석하였으며, 양지 저수지 11%, 보미 저수지 3%로 용수 부족을 겪은 수혜구역이 적은 것으로 판단된다.
관개 균일도 (IR3)는 전체 수혜구역 면적 대비 평균 관개율의 수혜구역 면적 비율을 통해 산정하였으며, 양지 저수지 34%, 보미 저수지 25%로 모든 수혜구역에 용수공급이 균일하게 이루어지지 않은 것으로 판단된다. 보조수원공 수혜면적 비 율 (IR4)의 경우 양수장을 사용하지 않으므로 양지, 보미 저수 지 모두 0%로 산정하였다.
3. 농업가뭄진단 종합평가
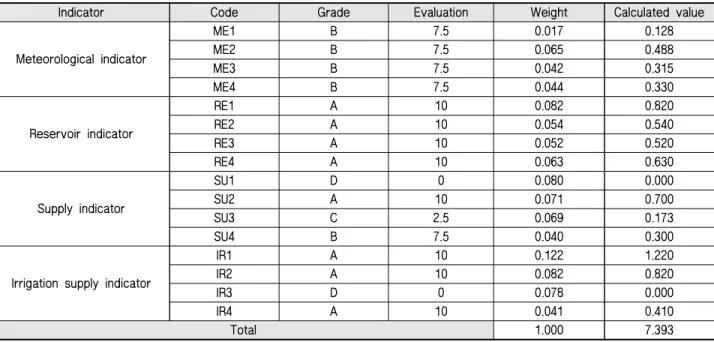
양지 저수지와 보미 저수지를 대상으로 농업가뭄진단 평가 를 하였으며, Table 6과 Table 7은 각각 양지 저수지와 보미 저수지의 농업가뭄진단 종합평가 결과를 나타낸다. 기상 지 표 (ME)는 양지, 보미 저수지 모두 문경 지점 지상관측소 자 료를 사용하였다. 누적강수량 (ME1) B등급 (1083 mm), 관개 기 누적강수량 (ME2) B등급 (711 mm), 관개기 무강우일수 (ME3) B등급 (127일), 3∼5월 누적강수량 B등급 (188 mm)으 로 나타났다. 저수지 지표의 경우, 용량 가뭄빈도 (RE1)와 과 거 저수율 관리 (RE2)는 각각 10년 빈도 이상, 0회로 양지, 보미 저수지 모두 A등급으로 분석되었다. 농업용수잠재능 (RE3)은 양지 저수지 A등급 (5.0 m), 보미 저수지 A등급 (2.8 m)으로 나타났으며, 저수지 물순환율 (RE4)은 양지 저수지 B등급 (80%), 보미 저수지 A등급 (109%)으로 분석되었다. 공 급량 지표의 경우, 적정관개량 공급량 (SU1)의 경우 양지 저 수지 A등급 (2.11%), 보미 저수지 D등급 (-71.58%)으로 나타 났으며, 보미 저수지의 경우 전국 공급량 대비 공급량이 매우 적어 낮은 등급이 나온 것으로 판단된다. 연 공급량 안정성 (SU2)은 양지, 보미 저수지 모두 A등급 (0.3)으로 나타났으며, 수요량 대비 공급량 (SU3)은 양지 저수지 A등급 (2), 보미 저 수지 C등급 (0.7)으로 보미 저수지의 경우 수요량 대비 공급량 이 부족한 것으로 판단된다. 용수로의 구조화 비율 (SU4)은 양지, 보미 저수지 모두 B등급 (50%)으로 나타났다. 관개율 지표 (IR)의 경우 SWMM 모형 기반 수로 네트워크 모의를 활용하여 분석하였다. 평균 관개율 (IR1)은 양지 저수지 D등 급 (49%), 보미 저수지 A등급 (70%)으로 나타났으며, 양지 저수지의 경우 관개기의 논 담수심이 매우 낮았던 것으로 판 단된다. 관개 취약성 (IR2)은 양지 저수지 A등급 (18%), 보미 저수지 A등급 (0%)으로 나타났으며, 관개 균일도 (IR3)는 양 지 저수지 D등급 (34%), 보미 저수지 D등급 (25%)으로 관개 공급이 전체면적 대비 고르지 않은 것으로 판단된다. 보조수 원공 수혜면적 비율 (IR4)의 경우 양지, 보미 저수지 모두 A등 급 (0%)으로 나타났다.
Ⅳ. 결 론
본 연구에서는 경상북도 상주시의 양지 저수지와 보미 저 수지를 대상으로 농업가뭄진단 평가를 진행하였다. 평가 인 자는 기상, 저수지, 공급량, 관개율의 중분류 지표와 중분류 지표별 4개씩 총 16개의 세부항목으로 구성하였다. 각 항목별 AHP 분석을 통해 중분류 가중치와 세부항목 가중치를 곱하 여 최종가중치를 산정하였으며, 각각의 지표에 대해 A부터
D등급까지 산정하여 각 등급에 해당하는 평가지수 값에 최종 가중치를 곱하여 농업가뭄진단 종합평가를 하였다.
농업수자원 및 가뭄 관련 전문가 20명에 대한 AHP 가중치 분석결과는 중분류 지표의 경우 관개율 지표 (IR) 0.323으로 가장 높게 분석되었으며, 기상 지표 (ME) 0.168로 가장 낮은 가중치를 나타냈다. 세부항목 가중치 산정결과는 기상 지표 (ME)의 경우 관개기 누적강수량 (ME3) 0.389로 가장 높게 나
Indicator Code Grade Evaluation Weight Calculated value
Meteorological indicator
ME1 B 7.5 0.017 0.128
ME2 B 7.5 0.065 0.488
ME3 B 7.5 0.042 0.315
ME4 B 7.5 0.044 0.330
Reservoir indicator
RE1 A 10 0.082 0.820
RE2 A 10 0.054 0.540
RE3 A 10 0.052 0.520
RE4 B 7.5 0.063 0.473
Supply indicator
SU1 A 10 0.080 0.800
SU2 A 10 0.070 0.700
SU3 A 10 0.069 0.690
SU4 B 7.5 0.040 0.300
Irrigation supply indicator
IR1 D 0 0.122 0.000
IR2 A 10 0.082 0.820
IR3 D 0 0.077 0.000
IR4 A 10 0.041 0.410
Total 1.000 7.333
Table 6 Result of agricultural drought diagnostic in Yangji reservoir (reference: CODE of Table 2)
Indicator Code Grade Evaluation Weight Calculated value
Meteorological indicator
ME1 B 7.5 0.017 0.128
ME2 B 7.5 0.065 0.488
ME3 B 7.5 0.042 0.315
ME4 B 7.5 0.044 0.330
Reservoir indicator
RE1 A 10 0.082 0.820
RE2 A 10 0.054 0.540
RE3 A 10 0.052 0.520
RE4 A 10 0.063 0.630
Supply indicator
SU1 D 0 0.080 0.000
SU2 A 10 0.071 0.700
SU3 C 2.5 0.069 0.173
SU4 B 7.5 0.040 0.300
Irrigation supply indicator
IR1 A 100.122 1.220
IR2 A 10 0.082 0.820
IR3 D 0 0.078 0.000
IR4 A 10 0.041 0.410
Total 1.000 7.393
Table 7 Result of agricultural drought diagnostic in Bomi reservoir (reference: CODE of Table 2)
타났으며, 연 누적강수량 (ME1) 0.098로 가장 낮게 분석되었 다. 저수지 지표 (RE)는 저수지 용량 가뭄빈도 (RE1) 0.326으 로 가장 높게 나타났으며, 농업용수잠재능 (RE3) 0.207로 분 석되었다. 공급량 지표 (SU)의 경우 적정관개량 공급량 (SU1) 0.309로 가장 높게 분석되었으며, 용수로의 구조화 비율 (SU4) 0.152로 가장 낮게 분석되었다. 관개율 지표 (IR)의 경우 평균 관개율 (IR1) 0.379로 가장 높게 분석되었으며, 보조수원공 수 혜면적 비율 (IR4) 0.127로 가장 낮은 것으로 나타났다. 산정 한 가중치의 일관성을 검증하기 위해 일관성 지수 (C.I)를 적 용하였으며, 분석결과 중분류 0.010, 기상 지표 0.004, 저수지 지표 0.012, 공급량 지표 0.014, 관개율 지표 0.018로 모두 0.1 이하의 합리적인 일관성을 갖는 것으로 판단하였다. 농업가 뭄진단 종합평가 결과 양지 저수지와 보미 저수지 모두 A등 급 (7.333, 7.939)으로 나타났다.
본 연구의 농업가뭄진단 평가결과는 수리시설물 및 평야부 를 포함한 광역단위의 농업유역에서 가뭄에 취약한 평야부 필지단위 지역 파악, 보조수원공의 추가 개발이 필요한 평야 부 지역 파악, 구조적 또는 비구조적 가뭄대응 우선순위 선정 시 활용 가능하다. 향후 지속적인 연구를 통해 농업가뭄진단 의 개념을 정의하고, 실시대상의 유형 구분 및 진단지표의 조 사 시기에 따른 분류 등 구체적인 이행사항 검토를 통해 농업 가뭄 상황에 따른 평가방법 구축이 필요하다. 또한, 농업가뭄 진단 종합결과에 따른 수리시설물별 진단등급, 세부지표별 등급에 따른 가뭄대응방안을 마련한다면 농업가뭄 평가에 대 한 활용성이 높아질 것으로 기대된다.
감사의 글
본 연구는 행정안전부 극한재난대응기반기술개발사업의 연구비 지원 (2019-MOIS31-010)에 의해 수행되었습니다.
REFERENCES
1. Ahn, S. R., G. A. Park, Y. H. Shin, and S. J. Kim, 2009.
Assessment of the potential water supply rate of agricultural irrigation facilities using MODSIM. Journal of Korea Water Resources Association 42(10): 825-843 (in Korean).
doi:10.3741/JKWRA.2009.42.10.825.
2. Bang, N. K., W. H. Nam, E. M. Hong, M. J. Hayes, and M. D. Svoboda, 2018. Assessment of the meteorological characteristics and statistical drought frequency for the extreme 2017 spring drought event across South Korea.
Journal of the Korean Society of Agricultural Engineers 60(4): 37-48 (in Korean). doi:10.5389/KSAE.2018.60.4.
037.
3. Choi, M. J., G. U. Park, D. W. Koh, and B. H. Jung, 2020.
Study on the selection of excellent air force budget managers using AHP and probability distribution. Journal of the Korean Society of Supply Chain Management 20(2):
15-26 (in Korean). doi:10.25052/KSCM.2020.10.20.2.15.
4. Coelho, C. A., I. A. Cavalcanti, S. M. Costa, S. R. Freitas, E. R. Ito, G. Luz, A. F. Santos, C. A. Nobre, J. A. Marengo, and A. B. Pezza, 2012. Climate diagnostics of three major drought events in the Amazon and illustrations of their seasonal precipitation predictions. Meteorological Applications 19(2): 237-255. doi:10.1002/met.1324.
5. Eztollah, K., 2006. Appropriateness of farmers’ adoption of irrigation methods: The application of the AHP model.
Agricultural Systems 87(1): 101-119. doi:10.1016/j.agsy.
2005.01.001.
6. Hafeez, K., Y. Zhang, and N. Malak, 2002. Determining key capabilities of a firm using analytic hierarchy process.
International Journal of Production Economics 76(1):
39-51. doi:10.1016/S0925-5273(01)00141-4.
7. Hayes, M. J., O. V. Wilhelmi, and C. L. Knutson, 2004.
Reducing drought risk: Bridging theory and practice.
Natural Hazards Review 5(2): 106-113. doi:10.1061/(ASCE) 1527-6988(2004)5:2(106).
8. Hong, E. M., J. Y. Choi, W. H. Nam, and J. T. Kim, 2016.
Decision support system for the real-time operation and management of an agricultural water supply. Irrigation and Drainage 65(2): 197-209. doi:10.1002/ird.1935.
9. Jang, J. S., 2019. Hydrometeorological characteristics and the spatial distribution of agricultural droughts. Journal of the Korean Society of Agricultural Engineers 61(2): 105- 115 (in Korean). doi:10.5389/KSAE.2019.61.2.105.
10. Jang, J. Y., and S. H. Kim, 2008. Globalization and the nation’s health; Climate change and health. Korean Public Health Research 34(1): 38-53 (in Korean). doi:10.22900/
kphr.2008.34.1.004.
11. Jeon, M. G., W. H. Nam, H. J. Lee, E. M. Hong, S. A.
Hwang, and S. O. Hur, 2021. Drought risk assessment for upland crops using satellite-derived evapotranspiration and soil available water capacity. Journal of the Korean Society of Hazard Mitigation 21(1): 25-33 (in Korean). doi:10.
9798/KOSHAM.2021.21.1.25.
12. Jung, J. H., D. H. Park, and J. H. Ahn, 2020. Drought
evaluation using unstructured data: A case study for Boryeong area. Journal of Korea Water Resources Association 53(12): 1203-1210 (in Korean). doi:10.3741/
JKWRA.2020.53.12.1203.
13. Kim, J. S., J. Y. Lee, J. B. Lee, C. M. Song, and J. S.
Park, 2016. Evaluation of agricultural water supply potential in agricultural reservoirs. Journal of the Korean Society of Agricultural Engineers 58(2): 65-71 (in Korean).
doi:10.5389/KSAE.2016.58.2.065.
14. Kim, S. H., and M. A. Jung, 2020. A study on the diffusion of Korean precision livestock farming using AHP method.
Korea Society of Innovation 15(4): 211-239 (in Korean).
doi:10.46251/INNOS.2020.11.15.4.211.
15. Lee, C. W., H. J. Shin, M. S. Kwon, G. M. Lee, S. H.
Nam, and M. S. Kang, 2019. An approach to drought vulnerability assessment using TOPSIS method. Journal of the Korean Association of Geographic Information Studies 22(4): 102-115 (in Korean). doi:10.11108/kagis.2019.22.4.
102.
16. Lee, G. H., 2019. A study on the maintenance system of water resources facilities, 61-62. Seoul: National Assembly Research Service.
17. Lee, H. J., and M. P. Shim, 2002. Decision making for priority of water llocation during drought by analytic hierarchy process. Journal of Korea Water Resources Association 35(6): 703-714 (in Korean). doi:10.3741/
JKWRA.2002.35.6.703.
18. Lee, H. J., W. H. Nam, D. H. Yoon, M. W. Jang, E. M.
Hong, T. G. Kim, and D. E. Kim, 2020. Estimation of water storage in small agricultural reservoir using Sentinel-2 satellite imagery. Journal of the Korean Society of Agricultural Engineers 62(6): 1-9 (in Korean).
doi:10.5389/KSAE.2020.62.6.001.
19. Lee, S. J., J. D. Song, T. I. Jang, D. M. Sul, and J. K.
Son, 2018. A study on the derivation of the user-oriented agricultural drought assessment criteria using the AHP technique. Journal of the Korean Society of Rural Planning 24(4): 47-55 (in Korean). doi:10.7851/Ksrp.2018.24.4.047.
20. Mun, Y. S., W. H. Nam, M. G. Jeon, H. J. Kim, K. K, J. C. Lee, T. H. Ha, and K. Y. L, 2020. Evaluation of regional drought vulnerability assessment based on agricultural water and reservoirs. Journal of the Korean Society of Agricultural Engineers 62(2): 97-109 (in Korean). doi:10.5389/KSAE.2020.62.2.097.
21. Nam, W. H., M. J. Hayes, D. A. Wilhite, and M. D.
Svoboda, 2015. Projection of temporal trends on drought characteristics using the standardized precipitation evapotranspiration index (SPEI) in South Korea. Journal of the Korean Society of Agricultural Engineer 57(1):
37-45 (in Korean). doi:10.5389/KSAE.2015.57.1.037.
22. Park, J. Y., J. Y. Yoo, M. Choi, and T. W. Kim, 2011.
Evaluation of drought risk in Gyeongsang-do using EDI.
Journal of the Korean Society of Civil Engineers 31(3B):
243-252 (in Korean). doi:10.12652/Ksce.2011.31.3B.243.
23. Park, J. Y., J. Y. Yoo, M. Lee, and T. W. Kim, 2012.
Assessment of drought risk in Korea: Focused on data- based drought risk map. Journal of the Korean Society of Civil Engineers 32(4B): 203-211 (in Korean). doi:10.12652/
Ksce.2012.32.4B.203.
24. Ridgley, M. A., 1993. multicriteria approach to allocation water during drought. Resource Management and Optimization 9(2): 135-149.
25. Saaty, T. L., 2008. Relative measurement and its generalization in decision making why pairwise comparisons are central in mathematics for the measurement of intangible factors the analytic hierarchy/network process.
RACSAM-Revista de la Real Academia de Ciencias Exactas, Fisicas y Naturales. Serie A. Matematicas 102(2):
251-318. doi:10.1007/BF03191825.
26. Saaty, T. L., 1980. The Analytic Hierarchy Process, New York: McGraw-Hill.
27. Shin, J. H., W. H. Nam, N. K. Bang, H. J. Kim, H. U.
An, J. W. Do, and K. Y. Lee, 2020a. Assessment of water distribution and irrigation efficiency in agricultural reservoirs using SWMM model. Journal of the Korean Society of Agricultural Engineers 62(3): 1-13 (in Korean).
doi:10.5389/KSAE.2020.62.3.001.
28. Shin, J. H., W. H. Nam, N. K. Bang, H. J. Kim, H. U.
An, and K. Y. Lee, 2020b. Assessment of irrigation efficiency and water supply vulnerability using SWMM.
Journal of the Korean Society of Agricultural Engineers 62(6): 73-83 (in Korean). doi:10.5389/KSAE.2020.62.6.073.
29. Tadesse, T., J. F. Brown, and M. J. Hayes, 2005. A new approach for predicting drought-related vegetation stress:
Integrating satellite, climate, and biophysical data over the US central plains. ISPRS Journal of Photogrammetry &
Remote Sensing 59(4): 244-253. doi:10.1016/j.isprsjprs.
2005.02.003.
30. van Oel, P. R., E. S. Martins, A. C. Costa, N. Wanders, and H. A. van Lanen, 2018. Diagnosing drought using the
downstreamness concept: The effect of reservoir networks on drought evolution. Hydrological Sciences Journal 63(7):
979-990. doi:10.1080/02626667.2018.1470632.
31. Wilhite, D. A., and M. D. Svoboda, 1982. Drought early warning systems in the context of drought preparedness and mitigation. National Drought Mitigation Center, Lincoln, NE, USA.
32. Wilhite, D. A., M. J. Hayes, C. Knutson, and K. H. Smith, 2000. Planning for drought: Moving from crisis to risk
management. Journal of the American Water Resources Association 36(4): 697-710. doi:10.1111/j.1752-1688.2000.
tb04299.x.
33. Yoon, D. H., W. H. Nam, H. J. Lee, E. M. Hong, and T.
Kim, 2020. Drought hazard assessment using MODIS-based Evaporative Stress Index (ESI) and ROC analysis. Journal of the Korean Society of Agricultural Engineers 62(3):
51-61 (in Korean). doi:10.5389/ KSAE.2020.62.3.051.