I. INTRODUCTION
Obesity is a major public health problem that is caus- ally related to serious medical conditions, and its world- wide prevalence has increased dramatically over the last
several decades [1-4]. According to the World Health Organization (WHO), more than 1.9 billion adults aged over 18 years were reported to be overweight in 2016. Of this number, over 650 million were obese [1]. Obesity is a well-recognized health hazard in affluent societies and a
Comparative Observation of Body Mass Index among Adults in Korea and Japan
Myeong-Jin Lee, Ph.D.1, Young-Hoon Chae, B.S.2, Won-Chang Lee, Ph.D.3, Young Hwan Kwon, M.D.4
1Public Health in Department of Nutrition, Otemae College of Nutrition, Osaka, Japan, 2Graduate School of
Engineering and 3College of Veterinary Medicine, Konkuk University, 4Aeromedical Center, Korean Air, Seoul, Korea
Original Article
pISSN: 1738-2548 • eISSN: 2713-9972 https://doi.org/10.46246/KJAsEM.210010
Received: July 7, 2021 Revised: August 5, 2021 Accepted: August 12, 2021 Corresponding Author Young Hwan Kwon
Aeromedical Center, Korean Air, 260 Haneul- gil, Gangseo-gu, Seoul 07505, Korea Tel: +82-2-2656-7150
Fax: +82-2-2656-8848 E-mail: [email protected] ORCID
https://orcid.org/0000-0001-9901-7280
Background: Obesity is a major public health problem that is causally related to serious medical conditions. In this study, the public health implications of obesity based on body mass index (BMI) with anthropometric measures among adults in the Republic of Korea and Japan in 2019 were compared.
Methods: A simple cross-section, nationally representative of the raw data from the National Health and Nutrition Examination Survey in 2019 between Korea and Japan were used. We analyzed the data of those categorized as obese with a BMI of ≥25 kg/
m2 according to the World Health Organization Expert Consultation.
Results: The average values of BMI based on body height and body weight among males and females in Korea were 24.6±0.08 and 23.3±0.09, respectively; those in Japan were 23.9±0.08 and 22.6±0.08, respectively. The measured anthropometric values were obviously higher in Korean than in Japan (P<0.01). The prevalence rates (PRs) of obesity by sex in Korea were 41.4% among males and 27.3% females; those in Japan were 32.5% among males and 22.0% among females. The statistically significant results showed that the total obesity rate was higher in males than in females in both countries (P<0.01). The PRs of obesity in Korea were 41.4% in males and 27.3% in females; those in Japan were 32.5% in males and 22.0% in females. The statistically significantly PR of total obesity among Korean adults was greater than that among Japanese adults (P<0.01).
Conclusion: The PR of obesity in Korea relative to that in Japan showed a gradually increasing trend. Obesity is a major problem, especially in the pilot group. Reducing the prevalence of obesity among pilots is important for reducing in-flight medical incapacitation and ensuring flight safety. Obesity management is necessary to prevent obesity-related diseases and promote pilot health.
Keywords: Obesity, Body mass index, Sex, Korea, Japan
Copyright © Aerospace Medical Association of Korea
KJA
sEM
THE KOREAN JOURNAL OF AEROSPACE & ENVIRONMENTAL MEDICINE
major global health problem that contributes to increased morbidity and mortality [3,4]. Moreover, obesity and over- weight are problems not only in developed countries but also in developing countries that face chronic hunger [4].
Obesity with overweight is associated with an increased risk of several chronic diseases, such as type 2 diabetes, cardiovascular diseases, hypertension and stroke, muscu- lar skeletal problems, osteoarthritis, and many forms of cancer [1-5].
These facts highlight the importance of developing ap- propriate anthropometric measures for obesity to identify and prevent the development of obesity-related disorders [2,5]. Body mass index (BMI) has been recommended by the WHO to classify body weight (BW); the cut-off points for overweight and obesity are ≥25 and ≥30 kg/m2, re- spectively [1-4]. BMI is determined by dividing a person’s weight in kilograms by their height in meters squared [1- 11]. However, the use of the recommended BMI cut-off points for Asian populations has been widely debated by the International Association for the Study of Obesity, the International Obesity Task Force, and the WHO; hence, the WHO has proposed the BMI cut-off points of 23.0–
24.9 and ≥25 kg/m2 for overweight and obesity in Asian adults, respectively [4-11].
Korea and Japan are very close to each other not only anthropologically and geographically but also sociologi- cally through factors such as food, culture, and lifestyle.
For example, both countries are known for their con- sumption of rice and side dishes from similar foodstuff and their use of chopsticks. Over the last decade, the prevalence of overweight and obesity has become a major public health issue in Korea and Japan [9-15], as well as in other countries [3-8].
The aim of this study was to compare the public health implications of BMI values and the prevalence rate (PR) of obesity by sex- and age-specific distributions among adults in Korea and Japan. Although we did not compare the pilot groups in this study, we were able to speculate about their health problems. The results of a previous study on the domestic pilot group showed that the aver- age BMI of the pilot group was statistically significantly higher than that of the general group [16].
II. MATERIALS AND METHODS
1. Data collection
A simple cross-section, nationally representative sample from the Korea National Health and Nutrition Exami- nation Survey in 2019 (NHANES VIII-1, Korea; https://
knhanes.kdca.go.kr/knhanes/sub04/sub04_04_01.do) published by the Korea Disease Control and Prevention Agency [10]. The raw data of Japan were obtained from the NHANES in Japan 2019 (www.mhlw.go.jp) published by the Ministry of Health, Labor and Welfare of Japan [11].
The data included information about cases of obesity by sex and age distribution among adults in both countries.
This study was exempted from institutional review board review as a retrospective study of existing data.
2. Statistical analysis
The PR in percentage (%) of obesity based on BMI is determined by dividing a person’s weight in kilograms by their height in meters squared. Herein, the frequency dis- tributions by sex and age were calculated. The values ob- tained for Korea and Japan were compared with a paired t-test or chi-squared test. Data analyses were conducted using statistical analysis software and Microsoft Excel 2010, and the results were considered to be statistically significant at *P<0.05 and **P<0.01.
III. RESULTS
The measured anthropometric values for body structure by sex and age among adults in Korea and Japan were
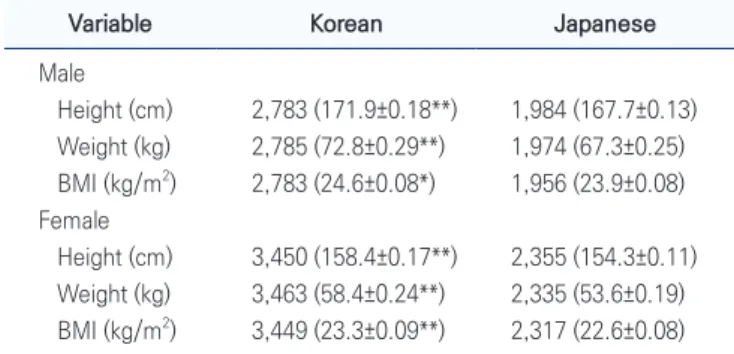
Table 1. Comparative observation of body structures among adults in Korea and Japan, 2019
Variable Korean Japanese
Male
Height (cm) 2,783 (171.9±0.18**) 1,984 (167.7±0.13) Weight (kg) 2,785 (72.8±0.29**) 1,974 (67.3±0.25) BMI (kg/m2) 2,783 (24.6±0.08*) 1,956 (23.9±0.08) Female
Height (cm) 3,450 (158.4±0.17**) 2,355 (154.3±0.11) Weight (kg) 3,463 (58.4±0.24**) 2,335 (53.6±0.19) BMI (kg/m2) 3,449 (23.3±0.09**) 2,317 (22.6±0.08) Values are presented as number (mean±standard error).
BMI: body mass index.
Statistically significant levels were set to *P<0.05 and **P<0.01.
compared with those of the nationally representative sample from the NHANES in 2019. The results are shown in Table 1. The mean values (±standard error) of body height (BH), BW, and BMI among males in Korea were 171.9±0.18 cm, 72.8±0.29 kg, and 24.6±0.08 kg/m2, re- spectively; those for males in Japan were 167.7±0.13 cm, 67.3±0.25 kg, and 23.9±0.08 kg/m2, respectively. These numbers indicate that the measured anthropometric val- ues for Korea were greater than those for Japan (P<0.01).
As for females, the average values of BH, BW, and BMI in Korea were 158.4±0.17 cm, 58.4±0.24 kg, and 23.3±0.09 kg/m2, respectively; and those in Japan were 154.3±0.11 cm, 53.6±0.19 kg, and 22.6±0.08 kg/m2, respectively.
The values for Korea were obviously greater than those for Japan (P<0.01). A comparative observation of the av- erage values of BMI, BH, and BW of adults in Korea and Japan is presented in Table 2 according to sex and age.
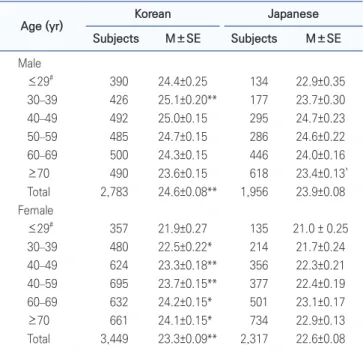
The comparison of BMI values showed that females over the age of 30 years in Korea had higher BMI values than those in Japan (P<0.01).
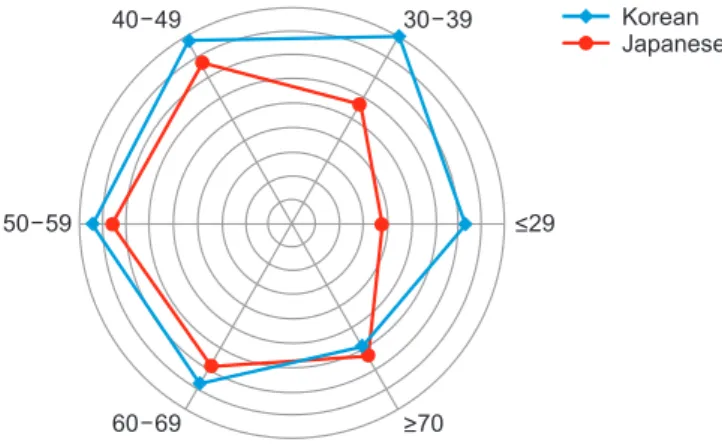
According to the guidelines, obesity is categorized as a BMI of ≥25 kg/m2 [1,9]. Table 3 and Fig. 1 and 2 show the comparative observations of PRs by sex and age among Table 2. Comparative observation of average values of BMI (kg/m2)
by sex and specific age groups among adults in Korea and Japan, 2019
Age (yr) Korean Japanese
Subjects M±SE Subjects M±SE Male
≤29# 390 24.4±0.25 134 22.9±0.35
30–39 426 25.1±0.20** 177 23.7±0.30
40–49 492 25.0±0.15 295 24.7±0.23
50–59 485 24.7±0.15 286 24.6±0.22
60–69 500 24.3±0.15 446 24.0±0.16
≥70 490 23.6±0.15 618 23.4±0.13`
Total 2,783 24.6±0.08** 1,956 23.9±0.08 Female
≤29# 357 21.9±0.27 135 21.0 ± 0.25 30–39 480 22.5±0.22* 214 21.7±0.24 40–49 624 23.3±0.18** 356 22.3±0.21 40–59 695 23.7±0.15** 377 22.4±0.19 60–69 632 24.2±0.15* 501 23.1±0.17
≥70 661 24.1±0.15* 734 22.9±0.13
Total 3,449 23.3±0.09** 2,317 22.6±0.08 BMI: body mass index, M±SE: mean±standard error.
#19–29 years in Korea and 20–29 years in Japan. Statistically significant levels were set to *P<0.05 and **P<0.01.
Table 3. Trends in the use of appropriate BMI cut-off points for the prevalence rate (%) of obesity among adults by sex and specific age groups in Korea and Japan, 2019 (unit: %)
Age (yr) Korean Japanese
Subjects Underweight Healthy Obesity Subjects Underweight Healthy Obesity Male
≤29# 390 3.6 59.1 37.3 134 6.7 70.1 23.1
30–39 426 0.9 52.7 46.4** 177 5.1** 65.5 29.4
40–49 492 2.1 52.9 45.0* 295 1.7 58.6 39.7
50–59 485 1.6 54.9 43.4 286 7.7** 53.1 39.2
60–69 500 1.7 58.4 39.9* 446 10.8** 53.8 35.4
≥70 490 4.9 64.8 30.4 618 28.2** 43.4 28.6
Total 2,783 2.3 56.4 41.4 1,956 13.6** 53.9 32.5
Female
≤29# 357 15.2 68.3 16.5 135 20.7 70.4 8.9
30–39 480 10.5 67.9 21.6* 214 16.4* 68.7 15.0
40–49 624 4.2 70.0 25.8* 356 12.9** 70.5 16.6
50–59 695 3.5 66.8 29.6* 377 25.5** 53.8 20.7
60–69 632 1.1 64.0 34.8* 501 20.0** 51.9 28.1
≥70 661 3.4 59.6 37.0** 734 36.8** 36.8 26.4
Total 3,449 6.3 66.4 27.3** 2,317 24.6** 53.3 22.0
Underweight (BMI<18.5), healthy (BMI 18.5–24.9), and obesity (BMI≥25).
BMI: body mass index.
#19–29 years in Korea and 20–29 years in Japan. Statistically significant levels were set to *P<0.05 and **P<0.01.
adults in Korea and Japan in 2019. The average PRs of obesity in Korea were 41.4% among males and 27.3%
among females; those in Japan were 32.5% among males and 22.0% among females. A statistically significant result indicated that obesity was more prevalent in males than in females in the two countries (P<0.01). In Korea, the PR distributions of obesity by age were as follows: for males aged under 29, 30–39, 40–49, 50–59, 60–69, and over 70 years, the rates were 37.3%, 46.4%, 45.0%, 43.4%, 39.9%, and 30.4%, respectively; as for the females, the rates were 16.5%, 21.6%, 25.8%, 29.6%, 34.8%, and 37.0%, respec- tively. In Japan, the PR distributions of obesity by age were as follows: for males aged 20–29, 30–39, 40–49, 50–
59, 60–69, and over 70 years, the rates were 23.1%, 29.4%, 39.7%, 39.2%, 35.4%, and 28.6%, respectively; those for the females were 8.9%, 15.0%, 16.6%, 20.7%, 28.1%, and 26.4%, respectively. However, the PRs of underweight among adults by sex and adjusted age groups in Korea were much lower than those in Japan (P<0.01).
IV. DISCUSSION
From the physiological aspect, a standard body structure is meant to have a proper amount of fat deposition and ideal BW, which is often expressed as desirable weight or ideal weight. The human body structure is influenced by a variety of factors, such as community, degree of civiliza- tion, and lifestyle. The determination of ideal BW is very important not only for national health management but also for medical care; hence, several indices of obesity
measurements have been established [1-7].
In this work, the measured anthropometric values for body structure by sex and age among adults in Korea and Japan were compared with those of the nationally repre- sentative sample from the NHANES in 2019.
Table 1 shows the measured anthropometric values of BH and BW among Korean and Japanese adults. The av- erage BMI values based on BH and BW of adult males and females in Korea were 24.6±0.08 and 23.3±0.09, respec- tively; those for Japan were 23.9±0.08 and 22.6±0.08, respectively. The comparative observation of the distribu- tions of the average BMI values by sex and age showed differences between Korea and Japan, with Korean males aged 30–39 years showing higher BMI values than Japa- nese males in the same age group (Table 2).
According to the WHO, overweight and obesity are de- fined as abnormal or excessive fat accumulation that may impair health [1-3]. Meanwhile, BMI is a simple weight- for-height index that is commonly used to classify over- weight and obesity in adults. In addition, BMI provides the most useful population-level measure for overweight and obesity as it is the same for adults regardless of sex and age. However, BMI should be considered as a rough guide because it may not correspond to the same degree of fatness in different individuals [1-4,9].
The fundamental cause of obesity and overweight is an energy imbalance between calories consumed and expended. Globally, the intake of energy-dense foods that are high in fat has increased, and physical inactiv- ity has become common because of the sedentary nature Korean
Japanese 40 49
50 59
60 69 >70
<29 30 39
Fig. 1.Distribution pattern of appropriate body mass in- dex cut-off points for the prevalence rate (%) of obesity among adult men by specific age groups in Korea and Ja- pan, 2019.
>70
<29
Korean Japanese 40 49
50 59
60 69
30 39
Fig. 2. Distribution pattern of appropriate body mass in- dex cut-off points for the prevalence rate (%) of obesity among adult women by specific age groups in Korea and Japan, 2019.
of many forms of work, changing modes of transporta- tion, and increasing urbanization [1-4]. Obesity, which is associated with a metabolic syndrome, is an important public health problem in most countries [1,2,6-8]. Exist- ing guidelines indicate that obesity is having a BMI of over 25.0. In 2000, the Regional Office for the Western Pacific Region of the WHO, the International Association for the Study of Obesity, and the International Obesity Task Force proposed a separate classification for obesity in Asia [2,6,7,9]. Table 3 shows the comparative observa- tions of the PRs of obesity by BMI among adults in Korea and Japan in 2019. The PRs of obesity in Korea were 41.4% among males and 27.3% among females; those in Japan were 32.5% among males and 22.0% among fe- males. In both countries, the total obesity rate was sta- tistically higher for males than for females (P<0.01). In addition, the PRs of obesity by age group among Korean females were significantly higher than those among Japa- nese females (P<0.01). However, the PRs of underweight among adults by sex and adjusted age groups in Korea were much lower than those in Japan (P<0.01).
The remarkable difference in sex is believed to reflect the different lifestyles in the two countries, the varying physical indices among adults, and the cultural differ- ences, including physical inactivity in combination with genetic factors [2,4,10-15,17].
Over the last several decades, the prevalence of obe- sity in both countries has more than doubled because of the westernization of food, culture, and lifestyle. These changes in lifestyle might partly explain the growing rate of obesity [4,6-9,17].
Although we did not compare the pilot groups in this study, we can speculate about their health problems.
The results of a previous study on a domestic pilot group showed that the average BMI of the pilot group was statis- tically significantly higher than that of the general group.
The BMI was lower in the pilot group under 50 years of age than in the general group, but it was higher in the age group of 50 years and older [16]. Reducing the preva- lence of obesity among pilots in particular is important in reducing in-flight medical incapacitation and ensuring light safety. Obesity management is necessary to prevent obesity-related diseases and promote pilot health. There- fore, proper lifestyle management with weight reduction for nutrition and regular exercise is recommended for ad- dressing the issue of obesity.
V. CONCLUSION
Obesity in Korea and Japan show common epidemio- logical characteristics and different levels of prevalence.
The establishment of strict control and surveillance sys- tems by public health authorities should be considered to prevent and reduce obesity in both countries. In terms of pilot health management, pilots’ BMIs should be moni- tored every year to establish health management mea- sures.
CONFLICTS OF INTEREST
No potential conflict of interest relevant to this article was reported.
ACKNOWLEDGEMENT
We thank the National Health and Nutrition Examina- tion Survey in 2019 by the Korea Disease Control and Prevention Agency and the Ministry of Health, Labor and Welfare of Japan for the raw data used in this work.
ORCID
Myeong-Jin Lee, https://orcid.org/0000-0003-0466-6996 Young-Hoon Chae, https://orcid.org/0000-0002-4078-8555 Won-Chang Lee, https://orcid.org/0000-0002-5522-2378 Young Hwan Kwon, https://orcid.org/0000-0001-9901-7280
AUTHOR CONTRIBUTIONS
Conceptualization: WCL, YHK. Data curation: MJL, YHC, WCL. Analysis and interpretation: WCL, YHK. Writ- ing the original draft: MJL, WCL, YHK. Critical revision of the article: WCL, YHK. Final approval of the article: WCL, YHK. Overall responsibility: YHK.
REFERENCES
1. World Health Organization (WHO). Obesity and overweight [Internet]. Geneva: WHO; 2020 [updated 2021 Jun 9; cited 2021 Jun 7]. Available from: https://www.who.int/news- room/fact-sheets/detail/obesity-and-overweight/.
2. Anuurad E, Shiwaku K, Nogi A, Kitajima K, Enkhmaa B, Shimono K, et al. The new BMI criteria for Asians by the regional office for the Western Pacific region of WHO are suitable for screening of overweight to prevent meta-
bolic syndrome in elder Japanese workers. J Occup Health 2003;45:335-343. https://doi.org/10.1539/joh.45.335 3. James PT. Obesity: the worldwide epidemic. Clin Dermatol
2004;22:276-280. https://doi.org/10.1016/j.clindermatol.
2004.01.010
4. Senauer B, Gemma M. Why is the obesity rate so low in Japan and high in the U.S.? Some possible economic ex- planations [Internet]. Minneapolis: University of Minne- sota; 2006 [cited 2021 Jun 7]. Available from: https://doi.
org/10.22004/ag.econ.14321.
5. Low S, Chin MC, Ma S, Heng D, Deurenberg-Yap M. Ratio- nale for redefining obesity in Asians. Ann Acad Med Singap 2009;38:66-69.
6. WHO Expert Consultation. Appropriate body-mass index for Asian populations and its implications for policy and intervention strategies. Lancet 2004;363:157-163. https://
doi.org/10.1016/S0140-6736(03)15268-3
7. World Health Organization (WHO). The Asia-Pacific per- spective: redefining obesity and its treatment [Internet].
Sydney: Health Communications Australia; 2000 [cited 2021 Jun 7]. Available from: https://apps.who.int/iris/
handle/10665/206936.
8. Examination Committee of Criteria for 'Obesity Disease' in Japan; Japan Society for the Study of Obesity. New crite- ria for 'obesity disease' in Japan. Circ J 2002;66:987-992.
https://doi.org/10.1253/circj.66.987
9. James WP, Chunming C, Inoue S. Appropriate Asian body mass indices? Obes Rev 2002;3:139. https://doi.
org/10.1046/j.1467-789x.2002.00063.x
10. Korea Centers for Disease Control and Prevention (KCDC).
The National Health and Nutritional Examination Survey (NHANES VIII-1) [Internet]. Cheongju: KCDC; 2021 [cited 2021 Jun 14]. Available from: https://knhanes.kdca.go.kr/
knhanes/sub04/sub04_04_01.do.
11. Ministry of Health, Labor and Welfare (MHLW). The Na- tional Health and Nutritional Examination Survey in Japan (NHANES) [Internet]. Tokyo: MHLW; 2019 [cited 2021 Jun 14]. Available from: www.mhlw.go.jp.
12. Hsieh SD, Yoshinaga H, Muto T. Waist-to-height ratio, a simple and practical index for assessing central fat distri- bution and metabolic risk in Japanese men and women. Int J Obes Relat Metab Disord 2003;27:610-616. https://doi.
org/10.1038/sj.ijo.0802259
13. Yang JJ, Shiwaku K, Nabika T, Masuda J, Kobayashi S. High frequency of cardiovascular risk factors in overweight adult Japanese subjects. Arch Med Res 2007;38:337-344. https://
doi.org/10.1016/j.arcmed.2006.10.014
14. Shiwaku K, Anuurad E, Enkhmaa B, Nogi A, Kitajima K, Shimono K, et al. Overweight Japanese with body mass in- dexes of 23.0-24.9 have higher risks for obesity-associated disorders: a comparison of Japanese and Mongolians. Int J Obes Relat Metab Disord 2004;28:152-158. https://doi.
org/10.1038/sj.ijo.0802486
15. Kang JG, Park CY. Gender and age differences in obesity among Korean adults. Korean J Intern Med 2013;28:19-21.
https://doi.org/10.3904/kjim.2013.28.1.19
16. Kwon YH, Lee MJ, Lee WC. Use of appropriate body mass index cutoff for obesity among Korean civilian pilots and its comparison to general adult men. Korean J Aerosp Envi- ron Med 2017;27:67-71.
17. Kim CS, Ko SH, Kwon HS, Kim NH, Kim JH, Lim S, et al.;
Taskforce Team of Diabetes Fact Sheet of the Korean Dia- betes Association. Prevalence, awareness, and manage- ment of obesity in Korea: data from the Korea National Health and Nutrition Examination Survey (1998-2011).
Diabetes Metab J 2014;38:35-43. https://doi.org/10.4093/
dmj.2014.38.1.35