Comparison of the Body Adiposity Index to Body Mass Index in Korean Women
Yeon-Ah Sung, Jee-Young Oh, and Hyejin Lee
Department of Internal Medicine, Ewha Womans University School of Medicine, Seoul, Korea.
Received: August 30, 2013 Revised: November 13, 2013 Accepted: November 25, 2013 Corresponding author: Dr. Hyejin Lee, Department of Internal Medicine,
Ewha Womans University School of Medicine, Ewha Womans University Mokdong Hospital, 1071 Anyangcheon-ro, Yangcheon-gu, Seoul 158-710, Korea.
Tel: 82-10-2650-2846, Fax: 82-2-2650-2846 E-mail: [email protected]
∙ The authors have no financial conflicts of interest.
© Copyright:
Yonsei University College of Medicine 2014 This is an Open Access article distributed under the terms of the Creative Commons Attribution Non- Commercial License (http://creativecommons.org/
licenses/by-nc/3.0) which permits unrestricted non- commercial use, distribution, and reproduction in any medium, provided the original work is properly cited.
Purpose: Obesity is a major public health issue and is associated with many meta- bolic abnormalities. Consequently, the assessment of obesity is very important. A new measurement, the body adiposity index (BAI), has recently been proposed to provide valid estimates of body fat percentages. The objective of this study was to compare the BAI and body mass index (BMI) as measurements of body adiposity and metabolic risk. Materials and Methods: This was a cross-sectional analysis performed on Korean women. The weight, height, and hip circumferences of 2950 women (mean age 25±5 years old, 18--39 years) were measured, and their BMI and BAI [hip circumference (cm)/height (m)1.5-18] values were calculated. Bio- electric impedance analysis was used to evaluate body fat content. Glucose toler- ance status was assessed with a 75-g oral glucose tolerance test, and insulin sensi- tivity was estimated with the insulin sensitivity index. Results: BMI was more significantly correlated with fat mass and fat percentage. Additionally, BMI was also more significantly associated with metabolic parameters, including fasting glucose, post-load 2-h glucose, fasting insulin, post-load 2-h insulin, triglycerides, and high density lipoprotein cholesterol than BAI. Receiver operating characteris- tic curve analysis revealed that BMI was a better tool for predicting body fat per- centage than BAI. Insulin sensitivity and metabolic syndrome were more signifi- cantly associated with BMI than with BAI. Conclusion: In Korean women, the current BMI-based classifications for obesity might be superior to BAI-based mea- surements for determining obesity and predicting metabolic risk.
Key Words: Body adiposity index, body mass index, obesity
INTRODUCTION
Obesity is a common condition and is increasing in prevalence worldwide, includ- ing in Asia.1 Obesity is defined as a state of excess adipose tissue, and it is associ- ated with numerous chronic health conditions, such as type 2 diabetes mellitus, cardiovascular disease, hypertension, and cancer. Moreover, mortality rates are in- creased in obese individuals.2-4 Consequently, identifying obesity to estimate the risks of associated diseases is a major health concern.
Obesity is characterized by excess body fat, something difficult to measure. In- creased body fat is usually accompanied by increased total body mass; therefore,
BAI would accurately represent body fat and metabolic risk in Korean women.
MATERIALS AND METHODS
Subjects
The present cross-sectional study was carried out on 2950 Korean women (aged 18--39 years old) recruited from Ewha Womans University Hospital within the framework of the
“Health check-ups of women”, which was undergone be- tween December 2008 and October 2010. The participants were recruited from Seoul and the surrounding urban area, and they consisted of students (n=1481), office clerks (n=
622), professional workers (n=471), and unemployed wom- en including housewives (n=376). Participants in the study provided complete medical histories regarding their health status, current medication histories, social habits, such as alcohol drinking and smoking, eating habits, physical activ- ity, and family histories of chronic disease. Subjects were excluded from participation if they had any acute disease, severe liver, heart, or kidney dysfunction, cancer, or other conditions capable of altering body composition. The use of certain drugs, such as steroids or diuretics, was also a cri- terion for exclusion. The institutional review board of the Ewha Womans University Mokdong Hospital approved the study protocol, and written informed consent was obtained from all the participants.
Methods
Anthropometric examination and body fat analysis
The anthropometric examinations and bioelectrical imped- ance tests were performed by a single experienced nurse.
The subjects were instructed to avoid all diuretics for 7 days, alcohol for 2 days, intense exercise for 1 day, and all fluids for 4 hours.
Blood pressure was measured using a sphygmomanometer with standardized oscillometric cuff sizes. Weight and height were measured for all the subjects. The waist circumference was measured on bare skin at the narrowest indentation be- tween the 10th rib and the iliac crest at mid-respiration. The hip circumference was measured at the widest point over the greater trochanters. BMI was calculated as the weight in kilo- grams divided by the square of the height in meters (kg/m2), and BAI was calculated as (hip/height1.5)-188. A BMI of at least 25 kg/m2 is considered obese, based on the Asia-Pacif- indices of relative weight are commonly used to diagnose
obesity. One of the most commonly used indices of relative weight is body mass index (BMI), which is an accepted in- dex to characterize obesity in individuals and most widely used in epidemiological studies.5 BMI is very useful; how- ever, despite its widespread use, it is only a surrogate mea- surement of body fat, and it does not provide an accurate measurement of body composition,6 and may be influenced by age, sex, and ethnicity.7 Moreover, adipose tissue is re- sponsible for the majority of obesity-associated diseases;
therefore, complex and expensive methods, such as dual-en- ergy X-ray absorption (DXA) or magnetic resonance imag- ing, must be used to measure body fat accurately.8,9
Recently, the body adiposity index (BAI) was proposed as a tool to evaluate adiposity, to overcome the shortcom- ings of BMI.10 BAI can be calculated solely from the hip circumference and height {(hip circumference)/[(height1.5)- 18]}, and it can be used to reflect body fat percentage (BF%) in adults.10 BAI was suggested to have several advantages over BMI, including that it yields similar associations with BF% for men and women and may be more practical to as- sess in field studies because it does not require a weight measurement.11 BAI was developed and validated in studies of Mexican-American and African-American adults. Several recent studies of BAI values for predicting fat content or metabolic disorders in European-American, Mexican- American and Caucasian subjects have reported controver- sial results.11-20 In Caucasians, BAI is a better estimate of adiposity than BMI in non-obese subjects, but less effec- tively than BMI in obese men and women.12,15 Another study reported that BMI more strongly correlated with BF% than BAI, and more highly associated with diabetes risk in Cau- casian.14 In Mexican Americans, BAI was correlated more strongly than BMI with BF% in sex-pooled analyses, but not in sex-stratified analyses. Also, BAI is inferior to the widely used BMI as a correlate of the cardiometabolic risk factors.17 In a Spanish-Mediterranean population, the Re- ceiver Operating Characteristic (ROC) curve analysis showed a higher accuracy for BMI than BAI. Also, in African- American and Hispanic women, the use of BAI has no ad- vantage over the use of BMI.11,16,19,20 Only one study has de- termined the relationship between both BMI and BAI and BF% in Asian subjects,21 and additionally, the utility of this index for metabolic risk has not yet been confirmed in this ethnicity. Therefore, it is important to validate BAI for pre- dicting adiposity and metabolic risk in other Asian groups.
The objective of this study was to determine whether
assay using a commercial kit (Biosource, Nivelles, Bel- gium). Fasting serum total cholesterol, triglycerides, and HDL cholesterol levels were measured with an enzymatic assay on an automated analyzer (Hitachi 7150 Auto-Chem- istry Analyzer, Tokyo, Japan).
Statistical analysis
Statistical evaluation was performed with the SPSS software package, version 18.0 for Windows (IBM Corporation, Chi- cago, IL, USA). The quantitative variables are provided as the means±standard deviations. Two-tailed p values <0.05 were considered significant. Pearson’s correlations were used to examine the correlations between BMI and BAI and metabolic indices.15,17,19,21,30 Partial correlation was also used to adjust for the effect of age. An asymptotic test for comparing two correlated correlation coefficients, using Fisher’s Z transformation, was used to compare the accura- cy of BMI and BAI and their associations with other an- thropometric measurements and metabolic indices.31
The diagnostic accuracy of BMI and BAI were assessed by constructing ROC curves to detect BF%-based obesi- ty.18,21 The areas under each ROC curve were calculated us- ing the logistic procedure in STATA (Stata Corp, College Station, TX, USA), in which the area under the curve (AUC) was determined by integration. A bootstrapping pro- cedure was used to test for differences between the areas under particular curves. The ROC curve allows the evalua- tion of several cutoff points for different pairs of sensitivity and specificity. Cutoff values of BMI and BAI for the diag- nosis of obesity were derived mathematically from the ROC curves, using the point of the ROC curve with the highest value for the formula: sensitivity+specificity.
Multiple linear regression analysis was conducted using the ISI as the dependent variable and BMI, BAI, age, mean blood pressure, total cholesterol, triglycerides, and HDL cho- lesterol as independent variables to determine the BMI-ISI and BAI-ISI relationships. We used the variance inflation factor after the regression to check for multicollinearity. Mul- tivariate logistic regression analysis was performed to deter- mine the variables that were predictive of metabolic syn- drome.
RESULTS
The mean age of the subjects was 25±5 years old. The mean BMI was 21.5 kg/m2 (14.5 to 39.3 kg/m2), and the mean ic criteria.22
After the anthropometric measurements were obtained, the subjects were instructed to assume a resting supine po- sition for 30 minutes, after which bioelectrical impedance measurements were taken. A single-frequency bioelectrical impedance plethysmograph was used (InBody 230, Bio- space Industry, Seoul, Korea). Standard electrocardiograph- ic electrodes were placed on the hands and feet. Isopropyl alcohol was used to clean each electrode attachment site.
The subject’s legs were parted, and the arms were adducted by approximately 30° to prevent skin-to-skin contact. The cut-off used to define obesity was ≥35% BF, which is the most frequently used value reported in the literature.23-26 Laboratory evaluation
The 75-g oral glucose tolerance test was performed in the morning after an overnight fast. A polyethylene catheter was placed into the antecubital vein prior to the test. After 30 minutes of supine rest, venous blood samples were ob- tained at baseline and at 90 minutes and 120 minutes after the 75-g glucose load. Insulin sensitivity was estimated us- ing the insulin sensitivity index (ISI) by Stumvoll, et al.,27 according to the following formula: ISI=0.157-4.576×10⁻⁵× I120-0.00519×G90-0.000299×I0 (I120: post-load insulin at 120 minutes; G90: post-load glucose at 90 minutes; and I0: fast- ing insulin). Glucose tolerance was classified as follows:
normal glucose tolerance: fasting plasma glucose <100 mg/
dL and 2-hour post-load plasma glucose <140 mg/dL; im- paired fasting glucose: fasting plasma glucose 100--125 mg/
dL and 2-hour post-load plasma glucose <140 mg/dL; im- paired glucose tolerance: 2-hour post-load plasma glucose 140--199 mg/dL but fasting plasma glucose <100 mg/dL; or diabetes: fasting plasma glucose ≥126 mg/dL or 2-hour post-load plasma glucose ≥200 mg/dL.28 Metabolic syn- drome was diagnosed according to the Adult Treatment Panel III of the National Cholesterol Education Program (NCEP ATP III).29 This diagnosis requires the presence of central obesity with a waist circumference ≥80 cm, dyslip- idemia with triglycerides ≥150 mg/dL, and high density li- poprotein (HDL) cholesterol <50 mg/dL. Hypertension and hyperglycemia were diagnosed with blood pressure ≥130/85 mm Hg and fasting plasma glucose ≥100 mg/dL, respec- tively. Metabolic syndrome was diagnosed when at least three of the five metabolic abnormalities were present. Plas- ma glucose levels were measured using the glucose oxidase method (Beckman Model Glucose Analyzer 2, Brea, CA, USA), and insulin levels were measured by radioimmuno-
were 36.0% and 99.0%, respectively. The BAI cut-off val- ue for the diagnosis of obesity had sensitivity and specifici- ty of 46.6% and 95.9%, respectively.
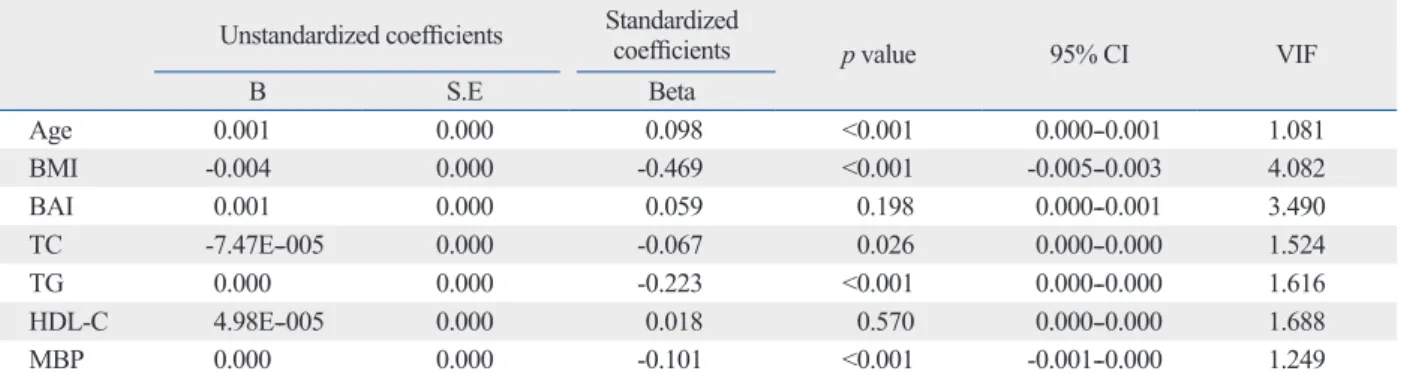
Multiple regression analysis showed that insulin sensitiv- ity was significantly associated with BMI (β=-0.469, p<
0.001) but not with BAI (β=0.059, p=0.198) (Table 4) after adjustments for age, total cholesterol, triglycerides, HDL cholesterol, and mean blood pressure. BMI (OR 1.57, p<
0.001) and age (OR 1.10, p=0.001) were significant predic- tors of metabolic syndrome, based on the logistic regres- sion analysis (Table 5).
BAI was 26.9 (18.5 to 44.2) (Table 1). Among 2950 sub- jects, 30 (1.0%) had diabetes, 185 (6.3%) were classified as having impaired fasting glucose or impaired glucose toler- ance, and 148 (5.0%) were hypertensive. Additionally, 163 (5.5%) subjects had metabolic syndrome as diagnosed by the NCEP ATP III criteria. The prevalence of obesity was 12.2% by BMI (≥25 kg/m2) and 31.9% by BF% (≥35%).
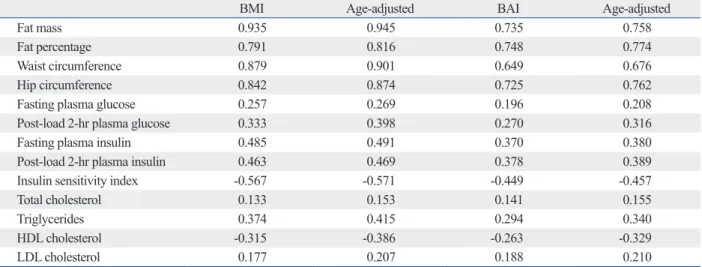
BMI and BAI were well correlated with each other (r=
0.824, p<0.001). Compared to BAI, BMI showed a strong correlation with fat mass (r=0.935 vs. 0.735), fat percentage (r=0.791 vs. 0.748), and metabolic indices, such as fasting glucose (r=0.257 vs. 0.196), post-load 2-h glucose (r=0.333 vs. 0.270), fasting insulin (r=0.485 vs. 0.370), post-load 2-h insulin (r=0.463 vs. 0.378), ISI (r=-0.567 vs. -0.449), tri- glycerides (r=0.374 vs. 0.294), and HDL cholesterol (r=
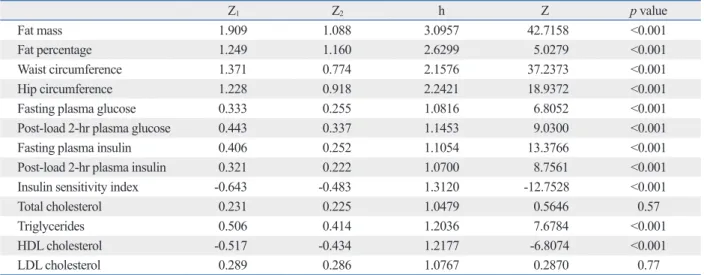
-0.315 vs. -0.263). After adjusting for age, the differences in the correlation coefficients remained statistically significant (Table 2). The correlation coefficients for fat mass, fat per- centage, waist circumference, hip circumference, fasting glucose, post-load 2-h glucose, fasting insulin, post-load 2-h insulin, ISI, triglycerides, and HDL cholesterol were significantly different between BMI and BAI, as assessed by Fisher’s Z test (Table 3).
The ROC curves to detect excess BF% (≥35%) showed AUC of 0.908 for BMI [confidence interval (CI): 0.897-- 0.918] and 0.868 for BAI (CI: 0.854--0.881). A comparison of the areas under the curve between BMI and BAI was performed with STATA, and the area under the BMI curve was significantly greater than the area under the BAI curve (Fig. 1). The sensitivity and specificity of the BMI cut-off value for the diagnosis of obesity (based on BF% ≥35%)
Table 1. Clinical and Biochemical Characteristics of the Study Participants
n=2950
Age (yrs) 25±5
Body mass index (kg/m2) 21.5±3.3
Body adiposity index 26.9±3.1
Waist circumference (cm) 73.4±8.4
Hip circumference (cm) 91.6±5.9
Fat mass (kg) 18.3±6.2
Fat percentage (%) 32.1±5.9
Fasting glucose (mg/dL) 85±9
Post-load 2-hr glucose (mg/dL) 99±26
Fasting insulin (mIU/L) 6.8±6.8
Post-load 2-hr insulin (mIU/L) 47.7±51.3 Insulin sensitivity index 0.95±0.03
Total cholesterol (mg/dL) 176±28
Triglycerides (mg/dL) 78±42
HDL cholesterol (mg/dL) 51±12
LDL cholesterol (mg/dL) 110±25
HDL, high density lipoprotein; LDL, low density lipoprotein.
The data are represented as the means±standard deviations.
Table 2. Correlation of Body Mass Index and Body Adiposity Index with Anthropometric and Biochemical Parameters
BMI Age-adjusted BAI Age-adjusted
Fat mass 0.935 0.945 0.735 0.758
Fat percentage 0.791 0.816 0.748 0.774
Waist circumference 0.879 0.901 0.649 0.676
Hip circumference 0.842 0.874 0.725 0.762
Fasting plasma glucose 0.257 0.269 0.196 0.208
Post-load 2-hr plasma glucose 0.333 0.398 0.270 0.316
Fasting plasma insulin 0.485 0.491 0.370 0.380
Post-load 2-hr plasma insulin 0.463 0.469 0.378 0.389
Insulin sensitivity index -0.567 -0.571 -0.449 -0.457
Total cholesterol 0.133 0.153 0.141 0.155
Triglycerides 0.374 0.415 0.294 0.340
HDL cholesterol -0.315 -0.386 -0.263 -0.329
LDL cholesterol 0.177 0.207 0.188 0.210
BMI, body mass index; BAI, body adiposity index; HDL, high density lipoprotein; LDL, low density lipoprotein.
All p values <0.0001.
from fat mass.32,33 BMI is relatively inaccurate in subjects with high lean body mass, such as athletes, and it cannot be generalized among different ethnic groups.6,34 Such limita- tions might be more relevant when dealing with the meta- bolic states associated with altered body fat distribution.
A new measurement, BAI, was recently proposed to pro- vide more valid estimates of BF% in adults.10 In a previous study, BF%, measured by DXA, was used as the criterion for body fat, and the reported correlation of BAI with body fat percentage was greater than with BMI. BAI was found to be a strong predictor of BF% in Mexican-American sub- jects of widely varying adiposities, and this result was con- firmed in a study of African-Americans.10 BAI had better concordance and a significantly stronger correlation with BF% than BMI, although BAI was inaccurate at low levels of adiposity in European-American adults.12 Interestingly, BAI has an advantage over BMI for defining adiposity, but BAI overestimated BF% in men and underestimated it in women.12 Another study demonstrated that BAI could also be used to determine the fat content in patients with adipose tissue scarcity, such as individuals with familial partial lipo- dystrophy. The percentage of total adipose tissue measured by DXA was strongly correlated with BAI and was more strongly correlated with leptin levels than BMI.13 However, only one study has attempted to validate the BAI on an Asian population. The results suggested that BMI was a more reliable indicator of BF% derived from skinfold thick- ness in adult Asian.21 Ethnic differences in hip circumfer- ence and height could exist, and the frequency of physical
DISCUSSION
In this study, we evaluated whether BAI, a new index of body adiposity, represents body fat and metabolic risk in Korean women similarly to or more accurately than BMI.
Our results showed that BMI was a better tool for predict- ing body adiposity in Korean women and was more signifi- cantly associated with metabolic risks than BAI.
Various methods have been developed to assess obesity;
however, BMI is the most commonly used approach to characterize obesity in individual subjects. BMI has many advantages, but the accuracy of BMI as a body-composi- tion marker has been controversial, and BMI has several limitations, particularly its inability to differentiate lean mass
Table 3. Comparison of Correlation Coefficients between BMI and BAI Using Metabolic Indices
Z1 Z2 h Z p value
Fat mass 1.909 1.088 3.0957 42.7158 <0.001
Fat percentage 1.249 1.160 2.6299 5.0279 <0.001
Waist circumference 1.371 0.774 2.1576 37.2373 <0.001
Hip circumference 1.228 0.918 2.2421 18.9372 <0.001
Fasting plasma glucose 0.333 0.255 1.0816 6.8052 <0.001
Post-load 2-hr plasma glucose 0.443 0.337 1.1453 9.0300 <0.001
Fasting plasma insulin 0.406 0.252 1.1054 13.3766 <0.001
Post-load 2-hr plasma insulin 0.321 0.222 1.0700 8.7561 <0.001
Insulin sensitivity index -0.643 -0.483 1.3120 -12.7528 <0.001
Total cholesterol 0.231 0.225 1.0479 0.5646 0.57
Triglycerides 0.506 0.414 1.2036 7.6784 <0.001
HDL cholesterol -0.517 -0.434 1.2177 -6.8074 <0.001
LDL cholesterol 0.289 0.286 1.0767 0.2870 0.77
BMI, body mass index; BAI, body adiposity index; HDL, high density lipoprotein; LDL, low density lipoprotein.
Z=(Z1-Z2)x√[(N-3)/(2x(1-rx)xh)]. Z1: Fisher Z-transformed r1 (r1: correlation coefficient between BMI and other variable). Z2: Fisher Z-transformed r2 (r2: correla- tion coefficient between BAI and other variable). Zx: Fisher Z-transformed rx (rx: correlation coefficient between BMI and BAI)=1.169. rx (correlation coef- ficient between BMI and BAI)=0.824. h: (1-f1r2)/(1-r2). f=(1-rx)/2(1-r2), f1=(f≤1→f)(f>1→1), r2=(r12+r22)/2. N=2950.
Fig. 1. Receiver operating characteristic curves for sensitivity and specific- ity of body mass index and body adiposity index in detecting obesity by body fat percentage. BMI, body mass index; BAI, body adiposity index;
ROC, receiver operating characteristic.
1-specificity 0.00
0.25 0.50 0.75
1.00
Sensitivity
0.00 0.25 0.50 0.75 1.00
BMI ROC area: 0.908 BAI ROC area: 0.868 Reference
from our study method using bioelectrical impedance, they measured four classic skinfold thicknesses to calculate the BF% in both sex.
We found that BMI was more significantly associated with insulin sensitivity than BAI. BMI was also a significant predictor of metabolic syndrome after adjustments for age, insulin sensitivity index, and BAI. Therefore, it appears that in Korean women, BMI remains a reliable measurement of body adiposity and metabolic risk.
The strengths of our study include the large number of subjects, the availability of data on the insulin sensitivity in- dex, and the assessment of glucose tolerance using an oral glucose tolerance test. The height of mature individuals is relatively constant; therefore, the measurement of hip cir- cumference might introduce errors into the estimation of BAI. To minimize this error, one well-trained practitioner measured hip circumference. One limitation of our study was the use of bioelectrical impedance to assess body fat.
BF% is defined as the proportion of individual fat mass over body weight. The relationship between BF% and BMI is not linear.35 A high BF% does not necessarily mean a high BMI, and vice versa. The cut-off used to define obesi- ty was ≥35% BF, which is the most frequently used value reported in the literature. Although DXA is the gold stan- dard for the measurement of body fat content,36 validation studies of bioelectrical impedance have generally shown strong correlations with other body composition methods, activity can also affect the measured value. It appears that
the utility of BAI for detecting fat content and metabolic in- dices might differ according to age, sex, or ethnicity. There- fore is important to validate BAI for predicting adiposity and metabolic risk in other Asian groups.
Compared to the Mexican-American sample used to cre- ate the BAI,10 the mean BMI in this study was 8 kg/m2 less, and the mean age was 10 years younger. In our study, both BMI and BAI were significantly correlated with other an- thropometric measurements and metabolic indices. Howev- er, the correlations of BMI with these anthropometric pa- rameters and metabolic indices were stronger. ROC analy- sis revealed superior discrimination of BMI, compared to BAI, for obesity based on BF%. These findings contrast with previous results demonstrating that BAI showed stron- ger correlations with total fat and fat mass.12,13,15 Our results were comparable to other recent studies which showed that BMI is more strongly associated with adiposity and meta- bolic risk factors than is BAI.16-20 BMI was more accurate surrogate for adiposity in American,19,20 Mexican Ameri- cans,17 Caucasian,18 and Asian subjects.21 Also one found that BMI was more strongly correlated with insulin sensi- tivity and type 2 diabetes risk.14 A previous study with Bury- at adults in China showed that BMI is a more reliable indi- cator of BF% than BAI, which is in accordance with our findings. They reported that BMI had a higher correlation with BF%, and also better predicted the BF%. Differing Table 4. Multiple Linear Regression Analysis for Insulin Sensitivity
Unstandardized coefficients Standardized
coefficients p value 95% CI VIF
B S.E Beta
Age 0.001 0.000 0.098 <0.001 0.000--0.001 1.081
BMI -0.004 0.000 -0.469 <0.001 -0.005--0.003 4.082
BAI 0.001 0.000 0.059 0.198 0.000--0.001 3.490
TC -7.47E--005 0.000 -0.067 0.026 0.000--0.000 1.524
TG 0.000 0.000 -0.223 <0.001 0.000--0.000 1.616
HDL-C 4.98E--005 0.000 0.018 0.570 0.000--0.000 1.688
MBP 0.000 0.000 -0.101 <0.001 -0.001--0.000 1.249
BMI, body mass index; BAI, body adiposity index; C, cholesterol; CI, confidence interval; HDL, high density lipoprotein; MBP, mean blood pressure; S.E, standard error; TC, total cholesterol; TG, triglycerides; VIF, variance inflation factor.
Table 5. Logistic Regression Analysis for Predicting Metabolic Syndrome Unstandardized coefficients
Odds ratio p value 95% CI
B S.E
Age 0.089 0.028 1.093 0.001 1.035--1.154
BMI 0.453 0.068 1.573 <0.001 1.378--1.796
BAI -0.146 0.072 0.864 0.053 0.751--1.096
ISI -19.606 3.982 0.000 <0.001 0.000--0.000
BMI, body mass index; BAI, body adiposity index; CI, confidence interval; ISI, insulin sensitivity index; S.E, standard error.
als. Int J Obes Relat Metab Disord 2000;24:1145-52.
10. Bergman RN, Stefanovski D, Buchanan TA, Sumner AE, Reyn- olds JC, Sebring NG, et al. A better index of body adiposity. Obe- sity (Silver Spring) 2011;19:1083-9.
11. Appelhans BM, Kazlauskaite R, Karavolos K, Janssen I, Kravitz HM, Dugan S, et al. How well does the body adiposity index cap- ture adiposity change in midlife women?: The SWAN fat pattern- ing study. Am J Hum Biol 2012;24:866-9.
12. Johnson W, Chumlea WC, Czerwinski SA, Demerath EW. Con- cordance of the recently published body adiposity index with measured body fat percent in European-American adults. Obesity (Silver Spring) 2012;20:900-3.
13. Godoy-Matos AF, Moreira RO, Valerio CM, Mory PB, Moises RS. A new method for body fat evaluation, body adiposity index, is useful in women with familial partial lipodystrophy. Obesity (Silver Spring) 2012;20:440-3.
14. Schulze MB, Thorand B, Fritsche A, Häring HU, Schick F, Zierer A, et al. Body adiposity index, body fat content and incidence of type 2 diabetes. Diabetologia 2012;55:1660-7.
15. Sun G, Cahill F, Gulliver W, Yi Y, Xie Y, Bridger T, et al. Concor- dance of BAI and BMI with DXA in the Newfoundland popula- tion. Obesity (Silver Spring) 2013;21:499-503.
16. Geliebter A, Atalayer D, Flancbaum L, Gibson CD. Comparison of body adiposity index (BAI) and BMI with estimations of % body fat in clinically severe obese women. Obesity (Silver Spring) 2013;21:493-8.
17. Lichtash CT, Cui J, Guo X, Chen YD, Hsueh WA, Rotter JI, et al.
Body adiposity index versus body mass index and other anthropo- metric traits as correlates of cardiometabolic risk factors. PLoS One 2013;8:e65954.
18. López AA, Cespedes ML, Vicente T, Tomas M, Bennasar-Veny M, Tauler P, et al. Body adiposity index utilization in a Spanish Mediterranean population: comparison with the body mass index.
PLoS One 2012;7:e35281.
19. Freedman DS, Thornton JC, Pi-Sunyer FX, Heymsfield SB, Wang J, Pierson RN Jr, et al. The body adiposity index (hip circumference÷
height (1.5)) is not a more accurate measure of adiposity than is BMI, waist circumference, or hip circumference. Obesity (Silver Spring) 2012;20:2438-44.
20. Gibson CD, Atalayer D, Flancbaum L, Geliebter A. Body adiposi- ty index (BAI) correlates with BMI and body fat pre- and post- bariatric surgery but is not an adequate substitute for BMI in se- verely obese women. Int J Body Compos Res 2012;10:9-14.
21. Zhao D, Li Y, Zheng L, Yu K. Brief communication: body mass index, body adiposity index, and percent body fat in Asians. Am J Phys Anthropol 2013;152:294-9.
22. Wen CP, David Cheng TY, Tsai SP, Chan HT, Hsu HL, Hsu CC, et al. Are Asians at greater mortality risks for being overweight than Caucasians? Redefining obesity for Asians. Public Health Nutr 2009;12:497-506.
23. Romero-Corral A, Somers VK, Sierra-Johnson J, Thomas RJ, Collazo-Clavell ML, Korinek J, et al. Accuracy of body mass in- dex in diagnosing obesity in the adult general population. Int J Obes (Lond) 2008;32:959-66.
24. Okorodudu DO, Jumean MF, Montori VM, Romero-Corral A, Somers VK, Erwin PJ, et al. Diagnostic performance of body mass index to identify obesity as defined by body adiposity: a systematic review and meta-analysis. Int J Obes (Lond) 2010;34:791-9.
25. Brozek J, Kihlberg JK, Taylor HL, Keys A. Skinfold distributions in middle-aged American men: a contribution to norms of lean-
such as hydrostatic weighing and isotope dilution.37 The ease of use, lack of radiation, and relatively low cost of bio- electrical impedance suggest that it is a feasible alternative for measuring body fat, particularly in large populations.
Our subjects are not representative of the general popula- tion, as we examined the diagnostic performances of BMI and BAI in relatively young women only. Therefore, these results might not apply to other age groups or to male sub- jects. Also, another limitation is lack of racial and ethnic di- versity, which provided us with the ability to test BAI’s per- formance in a Korean population.
In conclusion, our findings suggest that BMI is superior to BAI as a representation of body adiposity and metabolic risk in Korean women. The low cost, simplicity, wide avail- ability, and good validity of these anthropometric measure- ments make them particularly valuable for epidemiologic studies; however, further research is warranted to investigate the utility of BAI in Asian populations of different ages and both sexes.
ACKNOWLEDGEMENTS
The work was supported by the Ewha Global Top5 Grant 2012 of Ewha Womans University.
REFERENCES
1. Yoon KH, Lee JH, Kim JW, Cho JH, Choi YH, Ko SH, et al. Epi- demic obesity and type 2 diabetes in Asia. Lancet 2006;368:1681-8.
2. Haslam DW, James WP. Obesity. Lancet 2005;366:1197-209.
3. Must A, Spadano J, Coakley EH, Field AE, Colditz G, Dietz WH.
The disease burden associated with overweight and obesity.
JAMA 1999;282:1523-9.
4. Allison DB, Fontaine KR, Manson JE, Stevens J, VanItallie TB.
Annual deaths attributable to obesity in the United States. JAMA 1999;282:1530-8.
5. Bouchard C. BMI, fat mass, abdominal adiposity and visceral fat:
where is the ‘beef’? Int J Obes (Lond) 2007;31:1552-3.
6. Rahman M, Berenson AB. Accuracy of current body mass index obesity classification for white, black, and Hispanic reproductive- age women. Obstet Gynecol 2010;115:982-8.
7. Nevill AM, Stewart AD, Olds T, Holder R. Relationship between adiposity and body size reveals limitations of BMI. Am J Phys Anthropol 2006;129:151-6.
8. Goran MI, Driscoll P, Johnson R, Nagy TR, Hunter G. Cross-cali- bration of body-composition techniques against dual-energy X-ray absorptiometry in young children. Am J Clin Nutr 1996;63:299- 305.
9. Piers LS, Soares MJ, Frandsen SL, O’Dea K. Indirect estimates of body composition are useful for groups but unreliable in individu-
Public Health 1995;85:726-8.
33. VanItallie TB, Yang MU, Heymsfield SB, Funk RC, Boileau RA.
Height-normalized indices of the body’s fat-free mass and fat mass: potentially useful indicators of nutritional status. Am J Clin Nutr 1990;52:953-9.
34. Garrido-Chamorro RP, Sirvent-Belando JE, Gonzalez-Lorenzo M, Martin-Carratala ML, Roche E. Correlation between body mass index and body composition in elite athletes. J Sports Med Phys Fitness 2009;49:278-84.
35. Meeuwsen S, Horgan GW, Elia M. The relationship between BMI and percent body fat, measured by bioelectrical impedance, in a large adult sample is curvilinear and influenced by age and sex.
Clin Nutr 2010;29:560-6.
36. Heymsfield SB, Wang Z, Baumgartner RN, Ross R. Human body composition: advances in models and methods. Annu Rev Nutr 1997;17:527-58.
37. Wang ZM, Deurenberg P, Guo SS, Pietrobelli A, Wang J, Pierson RN Jr, et al. Six-compartment body composition model: inter- method comparisons of total body fat measurement. Int J Obes Relat Metab Disord 1998;22:329-37.
ness-fatness. Ann N Y Acad Sci 1963;110:492-502.
26. Li L, Wang C, Bao Y, Peng L, Gu H, Jia W. Optimal body fat per- centage cut-offs for obesity in Chinese adults. Clin Exp Pharmacol Physiol 2012;39:393-8.
27. Stumvoll M, Mitrakou A, Pimenta W, Jenssen T, Yki-Järvinen H, Van Haeften T, et al. Use of the oral glucose tolerance test to as- sess insulin release and insulin sensitivity. Diabetes Care 2000;23:
295-301.
28. American Diabetes Association. Diagnosis and classification of diabetes mellitus. Diabetes Care 2012;35 Suppl 1:S64-71.
29. Stone NJ, Bilek S, Rosenbaum S. Recent National Cholesterol Education Program Adult Treatment Panel III update: adjustments and options. Am J Cardiol 2005;96:53E-9E.
30. Barreira TV, Harrington DM, Staiano AE, Heymsfield SB, Katzmarzyk PT. Body adiposity index, body mass index, and body fat in white and black adults. JAMA 2011;306:828-30.
31. Meng XL, Rosenthal R, Rubin DB. Comparing correlated correla- tion coefficients. Psychol Bull 1992;111:172-5.
32. Roubenoff R, Dallal GE, Wilson PW. Predicting body fatness: the body mass index vs estimation by bioelectrical impedance. Am J