Antioxidant activity of Green Tea Fermented with Monascus pilosus
Ye-Kyung Lee · Sang-Il Lee · Jeong-Sook Kim · Seung Hwan Yang · In-ae Lee · Soon-Dong Kim · Joo-Won Suh
Received: 5 September 2011 / Accepted: 16 February 2012 / Published Online: 31 March 2012
© The Korean Society for Applied Biological Chemistry 2012
Abstract Green tea leaves were fermented for 15 and 30 days with Monascus pilosus which is known to produce functional statins (TMs), and the content of various biochemical constituents such as total polyphenol (TP), total flavonoid (TF), theaflavin, and thearubigin were analyzed and compared with that of non- fermented green tea (GT) and Pu-erh Chinese post-fermented tea (PU). In addition to the electron donating ability (EDA), ferric iron reducing power (FIRP), xanthine oxidase (XO) inhibitory activity, superoxide dismutase (SOD)-like activity, iron chelating activity (ICA) and hydrogen peroxide contents were also measured and compared with that of GT and PU. Content of TP and TF in the water and ethanol extracts in TMs were lower than those in GT and PU. Theaflavin and thearubigin contents of water and ethanol extracts in TMs were higher than those of GT. And, these components were increased depending on the period of fermentation. While, EDA and FIRP of TMs were lower than those of GT, XO inhibitory activity of TMs was higher than non- fermented tea. While, ICA of TMs was slightly higher than GT and PU, the content of hydrogen peroxide in TMs was markedly lower than GT. This results suggested that the green tea fermented by M. pilosus was valuable for oxidative stress-induced diseases by decreasing hydrogen peroxide, and forming theaflavins and thearubigins with functionality of genus Monascus.
Keywords antioxidation ·Monascus pilosus · tea fermentation · theaflavin · thearubigin · total flavonoid · total polyphenol
Introduction
Tea has been cultivated and consumed in Korea for more than one thousand years (Matsumoto et al., 2004). Today, it is the most widely consumed antioxidant components-containing beverage in the world. It is reported that tea leaf may prevent metabolic syndrome, mutagenesis and cancer due to various antioxidative polyphenols such as epicatechin, epicatechin gallate, epigallocatechin, epigallocatechin gallate, flavonoid, and theaflavins (Ohe et al., 2001). For the extraction of effective tea components, it is generalized that tea leaf has withering, rubbing, panning and/or stemming, and fermentation treatment for allowing new flavor and function. Therefore, it is classified as non-fermented tea (green tea), semi-fermented tea, fermented tea (red tea) and post- fermented tea (Pu-erh tea). Moreover, in the process of tea fermentation, theaflavin and thearubigin (Sang et al., 2003) and (−)-gallocatechin and gallic acid were produced (Nakamoto et al., 2009). Theaflavin can prevent oxidative DNA damage by inhibition of reactive oxygen species (ROS) (Sang et al., 2003). It is reported that excessive ROS generation due to smoking, drinking, fatigue and/or disease status could stimulate aging, cancer, inflammation and metabolic syndrome such as hypertension, atherosclerosis and diabetes (Danrong et al., 2009). However, there were a little studies on the comparative differences between the green tea and fermented tea and also, on the tea fermentation by new functional microorganisms. The species of genus Monascus produces monacolin K, which inhibits cholesterol biosynthesis (Endo, 1980) and stimulate of bone formation and decrease bone fracture (Edwards et al., 2000; Choi and Yu, 2004).
In this study, post-fermented tea was prepared with green tea leaves using by Monascus pilosus, as well known functional microbe, to develop advanced-functional fermented tea, and antioxidant activities of the teas during fermentation periods were compared.
Y.-K. Lee · S. H. Yang · I.-a. Lee · S.-D. Kim · J.-W. Suh ( )
Division of Bioscience and Bioinformatics, Myongji University, Yongin City 449-728, Republic of Korea
E-mail: [email protected] S.-I. Lee · J.-S. Kim
Departent of Food, Nutrition and Culinary Arts, Keimyung College, Daegu 704-703, Republic of Korea
ORIGINAL ARTICLE
Materials and Methods
Microorganism, medium and tea fermentation. Tea (Aspalathus linearis) leaves were obtained from Hadong-gun in Gyeongsangnam-do, Koera in September 2010. Pu-erh tea identified by Wooricha Culture Association, Inc., Korea purchased from China’s Yunnam Province. M. pilosus KCCM 60084 for fermentation, obtained from the Korean Culture Center of Microorganisms. M. pilosus seed culture was prepared as described by (Youn et al., 2003) and used as a starter. The pH of all media was adjusted to 6.0 prior to sterilization. 600–700 g of panned tea leaves were fermented with M. pilosus in a polypropylene bag with air filter at 30oC for 15 and 30 days. The fermented teas were sterilized at 121oC for 30 min, then dried at 40oC until the moisture content was 2–3%.
Tea brewing and ethanol extraction. One gram of tea sample (one tea bag) was brewed one time for 5 min with 100 mL of boiled distilled water using Tea Extractor (Damian Tea Co., Anyang, Korea). And, in order to compare the water soluble and un-soluble fractions, 70% ethanol extraction was performed three times, and the extracts was pooled, and filtered through Whatman No. 2 filter paper.
Content of total polyphenol. Total phenolic content was determined by the Folin-Ciocalteu method (Minussi et al., 2003).
A sample solution of 100µL was added to 2 mL of 2% sodium carbonate, mixed thoroughly and allowed to stand for min. Then, 100µL of 50% Folin-Ciocalteu reagent was added and the mixture was mixed well. After incubation for 30 min at room temperature, the absorbance was measured at 750 nm. A calibration curve was obtained using various concentrations of gallic acid (Sigma-Aldrich, St. Louis, MO). The total phenolic content of the sample was expressed as mg of gallic acid equivalents per gram of dry sample.
Content of total flavonoid. Total flavonoid content was determined by the method of Maeda et al. (2005). A sample solution of 800µL was added to 2.4 mL of 2% aluminum chloride, mixed thoroughly and allowed to stand for 10 min at room temperature; the absorbance was measured at 415 nm. A calibration curve was obtained using various concentrations of naringin (Sigma-Aldrich). The total flavonoid content of the sample was expressed as mg of naringin equivalents per gram of dried sample.
Contents of theaflavin and thearubigin. Content of theaflavin (TF) and thearubigins (TR) were measured by the spectrophotometric methods of Ullah (1986). 10 mL of the tea extracts was mixed with 3 mL of 1% anhydrous disodium hydrogen phosphate solution and the mixture was extracted with 10 mL of ethyl acetate by thoroughly shaking for 1 min. The separated bottom layer was drained and the ethyl acetate layer (TF fraction) obtained was used in the analysis.
Extract-1: 10 mL of TF fraction was diluted to 25 mL with methanol.
Extract-2: To 1 mL of tea extract, 1 mL of 10% (w/v) aqueous oxalic acid and 8 mL of water were added and increased to 25 mL
with methanol.
Absorbance of E1 and E2 at 380 nm were obtained on the above two extracts after applying suitable corrections for the extract strength and actual volumes used. TF and TR were then calculated as follows:
TF (%)=2.25×E1 TR (%)=7.06×(4 E2−E1)
Xanthine oxidase (XO) inhibitory activity. Milk XO, partial purified, was obtained from non-sterilized fresh milk by extraction, ammonium sulfate fractionation and dialysis according to the method of Özer et al (1999), and stored at −70oC until using to determine XO activity. The xanthine oxidase inhibitory activity was evaluated by the method of Stirpe and Della Corte (1969), which consists of spectrophotometric monitoring of the formation of uric acid from xanthine. The sample solution (100µL) was added to 3.15 mL of 0.1 M phosphate buffer (pH 7.4), partial purified milk xanthine oxidase and 60µM xanthine. The reaction mixture (3.5 mL) was incubated at 30oC for 5 min, and absorbance of the mixture was measured at 292 nm. The inhibition activity (%) was calculated using the following formula, (%)=(1−(Asmple/ Acontrol))×100, where Asample is the absorbance of solution when the sample is added at a particular concentration, and Acontrol is the absorbance of the reaction mixture without the test compound.
Electron donating ability (EDA). The 1,1-diphenyl-2-picryl- hydrazyl (DPPH) method was used to determine radical scavenging activity of the samples according to the method of Blois (1958). Various concentration of sample solution (0.2 mL) were added to 2.8 mL of ethanolic DPPH (0.2 mM) and mixed thoroughly. The mixture was left to stand for 30 min in the dark at room temperature and the absorbance was measured at 520 nm.
The EDA (%) was calculated using the following formula, EDA (%)=(1−(Asample/Acontrol))×100, where Asample is the absorbance of solution when the sample is added at a particular concentration, and Acontrol is the absorbance of the DPPH solution.
Superoxide dismutase (SOD) like activity. SOD-like activity was estimated by the method of Martin et al. (1987). Sample solutions (100µL) were added to 3.0 mL of 50 mM phosphate buffer (pH 7.4) containing 1 mM EDTA and 60µL of 5 mM hematoxylin, and mixed throughly. The mixture was incubated at 25oC for 5 min and the absorbance was measured at 560 nm. The results were expressed as the percentage of inhibition of hematoxylin autooxidation rate with respect to the reaction mixture without the test compound.
Ferric reducing antioxidant power assay. Ferric reducing antioxidant power (RP) of tea sample was determined by the method of Oyaizu (1986). Briefly, 0.75 mL of extract was mixed with 0.75 mL of 0.2 M phosphate buffer (pH 6.6) and 0.75 mL of 1% potassium ferricyanide. Reaction mixture was incubated at 50oC for 20 min. After incubation, 0.75 mL of 10% trichloroacetic acid was added and centrifuged at 1,000×g for 20 min. 1.5 mL solution from the upper layer was collect and mixed with 1.5 mL of distilled water and 0.3 mL of 0.1% ferric chloride. Absorbance of all the sample solutions was measured at 700 nm. Ascorbic acid
is used as a positive control. RP value is expressed as the absorbance of 700 nm.
Iron chelating activity. The iron chelating activity of tea sample was measured by Dinis et al. (1994) with little modifications.
1 mL of extract with different concentrations was mixed with 3.7 mL of methanol, and then the mixture was mixed with 0.1 mL of 2 mM ferrous chloride and 0.2 mL of 5 mM ferrozine for 10 min at room temperature. The absorbance was measured at 562 nm against a blank in which the extract was not added. The
% age inhibition was calculated as: % Inhibition=B0-B1/B0×
100. Where, B0 is the absorbance of control, B1 is the absorbance of reaction mixture.
Content of Hydrogen peroxide. Hydrogen peroxide in tea sample was determined according to the method (Long et al., 1999) with minor changes. Briefly, 0.18 mL of samples were mixed with 40µL high-performance liquid chromatography (HPLC)-grade methanol and 3.6 mL of FOX reagent (prepared in advance by mixing 9 volumes of 4.4 mM BHT in HPLC-grade methanol with 1 volume of 1 mM xylenol orange and 2.56 mM ammonium ferrous sulfate in 0.25 M H2SO4) was added. The reaction mixture was then vortexed and incubated at room temperature for 10 min. The absorbance of the ferric-xylenol orange complex was measured at 560 nm. All tests were carried out six times and sodium pyruvate was used as the reference compound (Floriano-Sánchez et al., 2006).
Sensory evaluation. Sensory tests of fermented tea samples were evaluated according to the 5 point degree (Herbert and Jeol, 1993) by 25 panels of the Woori Tea Culture Association in Korea. The sweet taste, sour taste, astringent taste and savory taste of tea samples were ranked as very low (1 point), low (2 points), moderate (3 points), strong (4 points) or very strong (5 points), and flavor, color and overall acceptability were evaluated by a scale of very poor (1 point), poor (2 points), moderate (3 points), good (4 points) or very good (5 points).
Statistical analysis. Values for the antioxidative contents such as total phenolic and flavonid, and the activities of antioxidants are mean ± SDs of triplicate determinations. And, sensory values were represented as mean ± SD of 3 measurements and 25 panels, respectively. Significance test were carried out by doing a two- way ANOVA test followed by Duncan’s multiple range test using SPSS statistical software (Version 12.0, SPSS Inc., Chicago, IL).
A p value <0.05 denoted the presence of statistically significant difference.
Results and Discussion
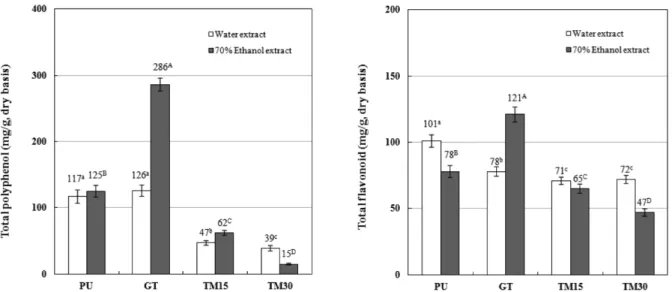
Content of total polyphenol and flavonoid. Total polyphenol and total flavonoid contents in the water and ethanol extracts of the M. pilosus fermented green tea for 15 days (TM15) and 30 days (TM30) were lower than those of green tea (GT) and Pu-erh (PU). Furthermore, the contents in ethanol extract of all TMs were lower than those of water extract (Fig. 1). Generally, it is reported that polyphenol contents in tea are dependent on degree, period and process of fermentation, and these contents decrease when tea is fermented for long periods (Zuo et al., 2002). Therefore, this result indicated that low contents of total polyphenol and total flavonoid in TMs may be due to high degree of fermentation by M. pilosus in spite of short duration. Zuo et al. (2002) reported that catechins as a representative component of green tea leaf could convert to water soluble flavonoids due to oxidation by polyphenol oxidase during fermentation.
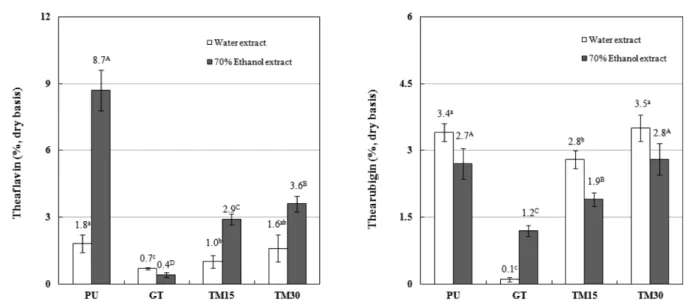
Contents of theaflavin and thearubigin. Theaflavin and thearubigin contents of water and ethanol extracts in TM15 and TM30 were higher compared with that of GT. While, these components were increased depending on the period of fermentation by M. polosus, these contents in all TMs were lower than those of PU. Whereas the content of theaflavin in water and
Fig. 1 Contents of total polyphenol and total flavonoid of teas fermented by M. pilosus. Abbreviations: See Fig. 1. PU; Unnam Pu-erh tea. Values are mean ± SDs of triplicate determinations. Different superscripts on the same bars (a-e and A-F) indicate significantly differences (p <0.05).
ethanol extract of PU were 1.8 and 8.7%, these in water and ethanol extract of TM15 and TM30 were 1.0–1.6% and 2.9–3.6%, respectively. On the other hand, the content of thearubigin in TM30 was not significantly different from PU (Fig. 2). It has been reported that the content of catechin is decreased during formation of theaflavin and thearubigins (Ngure et al., 2009), and stimulation of catechin oxidation could more rapidly convert to theaflavin and thearubigins (Tanaka et al., 2009). The decrease in polyphenols suggests that a considerable part of it could have been converted to flavonoid as thearubigins during fermentation by M. pilosus.
EDA and ferric reducing antioxidant power. The results of EDA and ferric reducing antioxidant power (RP) are shown in the Fig. 3. EDA and RP in the teas were decreased by the fermentation of M. polosus. While the values of EDA in water
extracts of tea were lower than those of ethanol extracts, the values of RP in the water extracts of the teas were higher compared with ethanol extracts. Furthermore, EDA in water and ethanol extract between PU and TM15 were similar as 41, 40, and 58, 56%. Additionally, while, RP values (absorbance at 700 nm) in water extract in TM15, TM30 and PU were 0.16, 0.12, and 0.23, those of ethanol extracts were 0.11, 0.05, and 0.05, respectively. Sang et al. (2003) reported that newly generated theaflavin of post-fermented tea has strong antioxidative activity (anti-lipid peroxidation) in rabbit hepatic tissue. The fermented green tea by M. pilosus having strong EDA and RP could be a rapidly manufacturing method of post-fermented tea compared with PU.
XO inhibitory activity and SOD-like activity. XO inhibitory Fig. 2 Contents of theaflavin and thearubigin of teas fermented by M. pilosus. Abbreviations: See Fig. 1. PU; Unnam Pu-erh tea. Values are mean ± SDs of triplicate determinations. Different superscripts on the same bars (a-e and A-G) indicate significantly differences (p <0.05).
Fig. 3 Electron donating ability and reducing power of teas fermented by M. pilosus. Abbreviations: See Fig. 1. PU; Unnam Pu-erh tea. Values are mean ± SDs of triplicate determinations. Different superscripts on the same bars (a-e and A-F) indicate significantly differences (p <0.05).
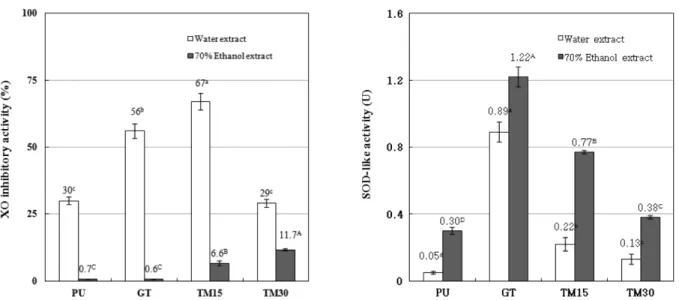
activity and SOD-like activity are shown in Fig. 4. In the XO inhibitory activity of water extract, TM15 (67%) was higher than those of GT (56%), TM30 (29%) and PU (30%). Whereas, these activities in the ethanol extract of PU and GT were 0.6–0.7% very low, those in TMs were increasing tendency from 6.6% (TM15) to 11.7% (TM30) depending on the period of fermentation.
Additionally, SOD-like activity (units) in both water and ethanol extracts were decreasing tendency depending on the period of fermentation, and these activities of TM15 and TM30 were higher than those of PU. These results indicated that compounds such as theaflavin and thearubigin having XO inhibitory activity and SOD-like activity could be produced by fermentation. It is well documented that XO utilizes oxygen as an electron acceptor and generates ROS such as superoxide anion radicals and hydrogen peroxide under pathophysiological conditions including ischemia-
reperfusion injury (Brass et al., 1991; Hasan et al., 1991;
Sanhueza et al., 1992; Kayyali et al., 2001) and diabetes (Desco et al., 2002). And, it is widely accepted that the ubiquitous SODs catalyze the disproportionation of superoxide to hydrogen peroxide, which is less toxic (McCord and Fridovich, 1969;
Fridovich, 1997). Furthermore, it is well known that the compounds of low molecular weight having non-enzymatic superoxide scavenging ability are regarded as SOD-like activity (Kitani et al., 2002). Therefore, SOD-like activity is regarded as a preventive parameter of oxidative damages (Shin et al., 2006).
Iron chelating activity and content of hydrogen peroxide. Iron chelating activity and hydrogen peroxide content in teas are shown in Fig. 5. While, the iron chelating activity in water extract of TM15 (48%) was slightly higher tendency than those of GT (40%) and TM30 (45%), this activity was significantly higher Fig. 4 SOD-like activity and XO activity of teas fermented by M. pilosus. Abbreviations: See Fig. 1. PU; Unnam Pu-erh tea. Values are mean ± SDs of triplicate determinations. Different superscripts on the same bars (a-e and A-E) indicate significantly differences (p <0.05).
Fig. 5 Iron chelating activity and hydrogen peroxide content of teas fermented by M. pilosus. Abbreviations: See Fig. 1. PU; Unnam Pu-erh tea. Values are mean ± SDs of triplicate determinations. Different superscripts on the same bars (a-e and A-E) indicate significantly differences (p <0.05).
than that of PU (38%). On the other hand, those activities in ethanol extract both TM15 and TM30 (37–38%) were slightly higher than that of GT (32%), but slightly lower than that of PU (42%). Whereas, the contents of hydrogen peroxide in both TM15 and TM30 (2.2–8.4µM) were markedly lower than that of GT (16.5–36.5µM), these contents in all TMs were similar to the PU (4.9–6.7µM). The main strategy to avoid ROS generation that is associated with redox active metal catalysis involves chelating of the metal ions. Antioxidants inhibit interaction between metal and lipid through formation of insoluble metal complexes with ferrous ion (Hsu et al., 2003). Water extract of M. pilosus fermented tea may interfere with the formation of ferrous and ferrozine complex via captures of ferrous ion. Differences of hydrogen peroxide content can be due to differences in species of tea, growth environment and/or harvest time and so on.
Sensory evaluation. Table 1 shows the sensory test results for the 1% hot water extract of tea samples such as PU, GT, TM15 and TM30. Sweet taste of TM15 was significantly higher than that of GT, and there were no significant differences between TM15 and PU. Sour tastes of all the samples were below 2.06 points (low), but it was increased depending on the period of fermentation. On the other hand, astringent taste was decreased depending on the period of fermentation. The values of astringent taste in TM30 were 1.20 points, which was significantly lower than that of PU.
Whereas, savory taste was decreased depending on the period of fermentation, the values of TM15 were higher than that of PU.
Meanwhile, flavor acceptability in PU, GT, TM15, and TM30 was 2.46, 3.70, 3.50, and 3.15 points, respectively. It is well known that flavor acceptability of Chinese Pu-erh tea is relatively lower estimate owing to moldy odor. Furthermore, color acceptability of TM15 (3.78 points) and TM30 (3.80 points) was higher than that of GT (2.86 points), and the color is light reddish brown like color of a commercial Pu-erh tea, PU (4.16 points). In addition, overall acceptability of PU, GT, TM15 and TM30 were 4.11, 3.22, 4.05, and 3.84 points, respectively.
It has been widely accepted that oxidative damage to cell membrane is condition in a number of metablic syndrome including atherosclerosis, diabetes, and aging (Danrong et al.,
2009). This study suggests that the green tea fermented by M.
pilosus was valuable for oxidative stress-induced diseases by decreasing hydrogen peroxide, and forming theaflavins and thearubigins with functionality of genus Monascus. However, more detailed work is required on the antioxidative effect in vivo systems to determine their exact mechanism of action.
Acknowledgements This work was supported by a grant from the Next- Generation BioGreen 21 Program (No. PJ0080932011), Rural Development Administration, Republic of Korea. and the Industrialization Support Program for Bio-technology of Agriculture and Forestry (810007-03-1-SU000), Ministry for Food, Agriculture, Forestry and Fisheries, Republic of Korea.
References
Blois MS (1958) Antioxidant determination by the use of a stable free radical.
Nature 26, 1199–1200.
Brass CA, Narciso J, and Gollan JL (1991) Enhanced activity of the free radical producing enzyme xanthine oxidase in hypoxic rat liver.
Regulation and pathophysiologic significance. J Clin Invest 87, 424–431.
Choi MJ and Yu TS (2004) Effects of red-yeast-rice supplementation on bone mineral density and bone mineral content in overiectomized rats. Korean J Nutr 37, 424–430.
Danrong Z, Yuquiong C, and Dejiang N (2009) Effect of water qulaity on the nutritional components and antioxidant activity of green tea extracts.
Food Chem 113, 110–114.
Desco MC, Asensi M, Marquez R, Martinez-Valls J, Vento M, Pallardo FV, Sastre J, and Vina J (2002) Xanthine oxidase is involved in free radical production in type 1 diabetes: Protection by allopurinol. Diabetes 51, 1118–1124.
Dinis TCP, Madeira VMC, and Almeida LM (1994) Action of phenolic derivatives (acetaminophen, salicylate, and 5-amino salicylate) as inhibitors of membrane lipid peroxidation and as peroxyl radical scavengers. Archivf Biochem Biophy 315, 161–169.
Edwards CH, Hart DJ, and Spector TD (2000) Pra statins and increased bone mineral density in postmenopausal wonmen. Lancet 355, 2218–2219.
Endo A (1980) Monacolin-K, a new hypocholesterolemic agent that specifically inhibits 3-hydroxy-3-methylglutaryl coenzyme A reductase.
J Antibiotics 33, 334–336.
Floriano-Sánchez E, Villanueva C, Medina-Campos ON, Rocha D, Sánchez- González DJ, Cárdenas-Rodríguez N, and Pedraza-Chaverrí J (2006) Nordihydroguaiaretic acid is a potent in vitro scavenger of peroxynitrite, singlet oxygen, hydroxyl radical, superoxide anion, and hypochlorous acid and prevents in vivo tyrosine nitration in lung. Free Radic Res 40, Table 1 Sensory characteristics of teas fermented by M. pilosus
Attributes Teas1)
PU GT TM15 TM30
Sweet taste2) 3.49±0.18a 2.67±0.12de 3.56±0.15a 3.15±0.14b
Sour taste3) 1.54±0.08cd 1.41±0.05d 1.85±0.05b 2.06±0.11a
Astringent taste4) 1.40±0.04c 2.84±0.09a 1.65±0.04b 1.20±0.03d
Savory taste5) 2.95±0.10c 3.76±0.17a 3.25±0.13b 2.84±0.09c
Flavor acceptability6) 2.46±0.09d 3.70±0.15a 3.50±0.16a 3.15±0.13bc
Color acceptability7) 4.16±0.19a 2.86±0.12d 3.78±0.15b 3.80±0.17ab
Overall acceptability8) 4.11±0.13a 3.22±0.14c 4.05±0.17a 3.84±0.16ab
1) See Fig. 1 and 2.
2-5)Values are mean ± SD of 25 panels evaluated from very low (1 point) to very strong (5 points). Different superscripts at the same row (a-c) indicate significant differences (p <0.05).
6-8)Values are mean ± SD of 10 panels evaluated from very poor (1 point) to very good (5 points).
9) Different superscripts at the same row (a-c) indicate significant differences (p <0.05).
523–533.
Fridovich I (1997) Superoxide anion radical (O2-.), superoxide dismutases, and related matters. J Biol Chem 272, 18515–18517.
Hasan NM, Cundall RB, and Adams GE (1991) Effects of hypoxia and reoxygenation on the conversion of xanthine dehydrogenase to oxidase in Chinese hamster V79 cells. Free Radic Biol Med 11, 179–185.
Herbert A and Jeol LS (1993) In Sensory Evaluation Practices. (2nd ed.), pp 68–94, Academic Press, New York, NY.
Hsu CL, Chen W, Weng YM, and Tseng CY (2003) Chemical composition, physical properties, and antioxidant activities of yam flours as affected by different drying methods. Food Chem 83, 85–92.
Kayyali US, Donaldson C, Huang H, Abdelnour R, and Hassoun PM (2001) Phosphorylation of xanthine dehydrogenase/oxidase in hypoxia. J Biol Chem 276, 14359–14365.
Kitani K, Minami C, Amamoto T, Kanai S, Ivy GO, and Carrillo MC (2002) Pharmacological interventions in aging and age associated disorders potentials of propargylamines for human use. Ann N Y Acad Sci 959, 295–307.
Long LH, Evans PJ, and Halliwell B (1999) Hydrogen peroxide in human urine: Implications for antioxidant defense and redox regulation.
Biochem Biophys Res Commun 262, 605–609.
Maeda A, Lamien CE, Romito M, Millogo J, and Nacoulma OG (2005) Determination of the total phenolic, flavonoid and proline contents in Burkina fasan honey, as well as their radical scavenging activity. Food Chem 91, 571–577.
Martin JP, Dailey M, and Sugarman E (1987) Negative and positive assays of superoxide dismutase based on hematoxylin autoxidation. Arch Biochem Biophys 255, 329–336.
Matsumoto S, Kiriiwa Y, and Yamaguchi S (2004) The Korean Tea Plant (Camellia sinensis): RFLP Analysis of Genetic Diversity and Relationship to Japanese Tea. Breed Sci 54 , 231–237.
McCord JM and Fridovich I (1969) Superoxide dismutase. An enzymic function for erythrocuprein (hemocuprein). J Biol Chem 244, 6049–
6055.
Minussi RC, Rossi M, Bologna L, Cordi L, Rotilio D, Pastore GM, and Duran N (2003) Phenolic compounds and total antioxidant potential of commercial wines. Food Chem 82, 409–416.
Nakamoto K, Takayama F, Mankura M, Hidaka Y, Egashira T, Ogino T, Kawasaki H, and Mori A (2009) Beneficial effects of fermented green tea extract in a rat model of non-alcoholic steatohepatitis. J Clin Biochem
Nutr 44, 239–246.
Ngure MF, Wanyokob JK, Mahungua SM, and Shitandia AA (2009) Catechins depletion patterns in relation to theaflavin and thearubigins formation. Food Chem 115, 8–14.
Ohe T, Marutani K, and Nakase S (2001) Catechins are not major components responsible for anti-genotoxic effects of tea extracts against nitroarenes.
Mutation Res 496, 75–81.
Oyaizu M (1986) Studies on products of the browning reaction prepared from glucose amine. Japanese J Nutr 44, 307–315.
Özer N, Müftüoglu M, Ataman D, Ercan A, and Ögüs IH (1999) Simple, high-yield purification of xanthine oxidase from bovine milk. J Biochem Biophys Methods 39, 153–159.
Sang S, Tian S, Jhoo JW, Wang H, Stark RE, Rosen RT, Yang CS, and Ho CT (2003) Chimical studies of the antioxidant mechanism of tehaflavins:
Radical reaction products of theaflavin 3,3'-digallate with hydrogen peroxide. Tetrahedron Letter 44, 5583–5587.
Sanhueza J, Valdes J, Campos R, Garrido A, and Valenzuela A (1992) Changes in the xanthine ehydrogenase/xanthine oxidase ratio in the rat kidney subjected to ischemia-reperfusion stress: Preventive effect of some flavonoids. Res Commun Chem Pathol Pharmacol 78, 211–218.
Shin SR, Hong JY, Nam HS, Yoon KY, and Kim KS (2006) Anti-oxidative effects of extracts of Korean herbal materials. Korean J Soc Food Sci Nutr 35, 187–191.
Stirpe F and Della Corte E (1969) The regulation of rat liver xanthine oxidase:
Conversion in vitro of the enzyme activity from dehydrogenase (type D) to oxidase (type O). J Biol Chem 244, 3855–3863.
Tanaka T, Miyata Y, Tamaya K, Kusano R, Matsuo Y, Tamaru S, Tanaka K, Matsui T, Maeda M, and Kouno I (2009) Increase of theaflavin gallates and thearubigins by acceleration of catechin oxidation in a new fermented tea product obtained by the tea-rolling processing of loquat (Eriobotrya japonica) and green tea leaves. J Agric Food Chem 57, 5816–5822.
Ullah MR (1986) A rapid procedure for estimating theaflavin and thearubigin of black tea. Two and A Bud 33, 46–48.
Youn UK, Kim YH, and Kim SD (2003) Pigment and monacolin K content of beni-koji fermented with soybean curd residue. Korean J Food Preserv 10, 360–364.
Zuo YG, Chen H, and Deng YW (2002) Simultaneous determination of catechins, caffeine and gallic acids in green, oolong, black and pu-erh teas using HPLC with a photodiode array detector. Talanta 57, 307–313.