Limitations of Applying Land-Change Models for REDD Reference Level Setting: A Case Study of Xishuangbanna,
Yunnan, China
Oh Seok Kim*
REDD 기준선 설정 시 토지이용변화 예측모형 적용의 한계:
중국 운남성 시솽반나 열대림 사례를 중심으로
김오석*
Abstract : This paper addresses limitations of land-change modeling application in the context of REDD (Reducing Emissions from Deforestation and forest Degradation). REDD is an international conservation policy that aims to protect forests via carbon credit generation and trading. In REDD, carbon credits are gen- erated only if there is measurable quantified carbon sequestration activities that are additional to business-as- usual (BAU). A “reference level” is defined as simulated baseline carbon emissions for the future under a BAU scenario, and predictive land-change modeling plays an important role in constructing reference levels. It is tested in this research how predictive accuracies of two land-change models, namely Geographic Emission Benchmark (GEB) and GEOMOD, vary with respect to different spatial scales: Xishuangbanna prefecture and Yunnan province. The accuracies are measured by Figure of Merit. In this Chinese case study, it turns out that GEB’s better performance is mainly due to quantity (e.g., how many hectares of forest will be converted to agricultural land?) rather than spatial allocation (e.g., where will the conversion happen?). As both quantity and allocation are crucial in REDD reference level setting it appears to be fundamental to systematically analyze accuracies of quantity and allocation independently in pursuit of accurate reference levels.
Key Words : land-change model, spatial scale, tropical deforestation, REDD, China
요약 :본 논문은 REDD(Reducing Emissions from Deforestation and forest Degradation, 개발도상국의 산림 파괴 및 산림황폐화 방지를 통한 온실가스 감축) 기준선 설정시 토지이용변화 예측모형 적용의 한계점을 지적 한다. REDD는 산림을 보호하는 대가로 탄소배출권을 생성하고 이를 거래하는 내용이 골자를 이루는 국제환 경보전 정책이다. 탄소배출권의 규모는 기준선(reference level)에 근거해 정해지는데, ‘기준선’이란 산림파괴 패 턴이 현상태 그대로 유지될 경우 미래에 발생할 탄소배출량을 의미한다. 본 논문에서는 토지이용변화 예측모 형인 Geographic Emission Benchmark(GEB)와 GEOMOD의 모델링 결과를 비교하여 공간적 스케일이 변함 에 따라 이들의 정확도가 어떻게 달라지는지를 분석하였다. 두 모형을 중국 운남성 시솽반나 열대림 사례에 적 용한 결과, GEB가 상대적으로 양적 예측이 더 우수한 것으로 나타났고, GEOMOD는 위치적 예측이 더 정확
Financial assistance was provided by: International Geographic Informational Fund Graduate Research Award and Dissertation Research Grant of the Associations of American Geographers, and Korea Environment Institute (Project title: Development of Integrated Land-Use Model to Support Climate Change Adaptation Policy, Part I). This paper is based on the author’s doctoral dissertation.
* Research Fellow at Korea Environment Institute (KEI 부연구위원), [email protected]
1. Introduction
1) Background
The role of forests has been much emphasized in recent intergovernmental meetings. Particularly, protecting tropical rainforests, especially the old growth ones, has been a global concern for many decades. Its importance cannot be overemphasized since the rainforests are home to diverse fauna and flora (Gibson et al., 2011), which include rare medical ingredients that might cure can- cer (Shanley and Luz, 2003). The rainforests also host numerous ecosystem services that are indispensable to humans (Robbins, 2004). Watershed protection, for example, preserves and secures freshwater on which hu- mans rely (Zhang et al., 2010; Johnson and Lewis, 2007).
If tropical rainforests are removed from an ecosystem, it will experience severe topsoil loss driven by the consistent rainfall that is quite common in any tropical regions.
Consequently, the ecosystem’s freshwater will become muddy, which is a waste from the human perspective.
Another ecosystem service of rainforests is absorbing water from the ground and then transfering it to the atmosphere as evapotranspiration. Such hydrological flux makes the regional climate cooler and more humid, which in turn causes more rain so that the fauna and flora in the region can survive or thrive (Moutinho and Schwartzman, 2005). Further, the rainforests not only play a key role in sustaining nutrient and energy balances
of ecosystems (Malhi et al., 2008; Pongratz et al., 2006), but also function as “biological carbon engines” that control terrestrial carbon flux, while simultaneously stor- ing a huge portion of carbon stock in them (Ramankutty
et al., 2007; Baker et al., 2004; Cramer et al., 2004).Without the carbon engines functioning, society very well might not be able to mitigate anthropogenic climate change efficiently.
There are different ways to sustain forests. One way to do so is by planting additional trees either on bare grounds (i.e., afforestation) or deforested areas (i.e., refor- estation), as these will sequester more carbon. Another way would be to protect existing forests that are vulner- able to future deforestation and/or forest degradation.
Once the forests are removed from the ground, their car- bon stocks will eventually be released to the atmosphere through, for instance, burning (which emits carbon dioxide, CO
2) or decaying (which emits methane, CH
4).
Afforestation and reforestation activities have been sup- ported by the Kyoto Protocol since 1997 (UNFCCC, 1998). What is unique about the Kyoto Protocol is that it officially mandates developed countries to reduce their greenhouse gas (GHG) emissions and simultane- ously allows trading “carbon credits” between developed countries and developing and least developed countries if a developed country is not capable of reducing GHG emissions of its own (i.e., “cap-and-trade”). The carbon credit is a new monetary system that allows countries to sell and buy the rights to emit GHGs, and it can be generated when afforestation and reforestation are done
한 것으로 밝혀졌다. 양적 예측은 몇 헥타르의 산림이 미래에 경작지로 개간이 될 것인가에 대한 결과를 의미 하고, 위치적 예측은 그 개간이 어디에서 일어날 것인가에 대한 결과를 가리킨다. 또한, 위치적 예측이 다소 부 정확하더라도 양적인 예측이 우수하면 전반적으로 특정 모형이 우수한 결과를 나타낼 수 있는 것으로 나타났 다. 이는 REDD 기준선 설정시 양적 예측과 위치적 예측이 모두 중요한 만큼 다양한 조건 하에서의 정확도 변 이를 고려하여 신중하게 토지이용변화 예측모형 적용해야지만 정확한 기준선을 설정할 수 있음을 시사한다.주요어 :토지이용변화 예측모형, 공간 스케일, 열대우림 파괴, REDD, 중국
based on internationally approved methodologies, where those are evaluated by numerous experts. Encouraged by such an emission trading mechanism, numerous devel- oping and least developed countries have planted a large amount of forests to sequester carbon that is additional to the business-as-usual (BAU) situation and to generate carbon credits, so that the countries can sell those to the developed countries that are not successful in reducing their GHG emissions. The Kyoto Protocol, however, did not allow generating and trading carbon credits through reducing deforestation and/or forest degradation (Brown et al., 2007), where such exclusion turned out to be problematic because it is known that old growth forests are better at sequestrating carbon than artificially planted trees such as plantations (Baker et al., 2004).
When the Kyoto Protocol was proposed, methodologies were scientifically limited in their ability to prove that activities were avoiding deforestation. That is, they were not capable of dictating an accurate quantity of potential carbon emissions in the future if society was to do noth- ing to halt or reduce deforestation and forest degradation (Brown et al., 2007; Dushku and Brown, 2003).
In 2008, the United Nations Collaborative Pro- gramme on Reducing Emissions from Deforestation and Forest Degradation in Developing Countries (UN- REDD) was launched (FAO et al., 2008) to make up such limitation of the Kyoto Protocol. UN-REDD, or more generally REDD, attempts to achieve the aim listed in its title by encouraging developed countries to provide financial supports through a carbon market system to those developing and least developed countries that are trying to reduce deforestation and forest degradation in areas with the most substantial deforestation and forest degradation (The Economist, 2010).
When implementing REDD setting an accurate refer- ence level is crucial. A “reference level” refers to simulated baseline carbon emissions for the future under a BAU scenario. If the project shows solid evidence of reduced deforestation and forest degradation, the deviations from
actual deforestation under a REDD project are used to calculate the associated REDD carbon credits. That as- sociation with REDD carbon credits is what makes refer- ence level important. Without having a solid reference level, REDD may not benefit all developing and least developed countries fairly.
2) Research objectives
According to Huettner et al. (2009), the methods for setting reference levels for REDD are mainly twofold: (1) retrospective and (2) prospective. The former may be the simplest as it linearly connects the existing measurements of carbon emissions in the past, where those are plotted in a Cartesian coordinate system, so as to extrapolate the linear trend of the observed carbon emissions to dictate the future carbon emissions. The prospective method is more sophisticated than the former, and the method includes predictive land-change modeling approaches (Brown et al., 2007). Using land-use and land-cover maps acquired from satellite imagery is the main strength of this method, and it is often accompanied by advanced spatial analyses (Kim and Newell, 2014). According to IPCC (2006), such spatially explicit approaches are con- sidered the most advanced way to measure GHG emis- sions (i.e., Tier 3), and this is why the spatially explicit prospective land-change modeling is strongly suggested by Verified Carbon Standard (2013).
Assessing predictive accuracy of land-change models is
crucial because the accuracy of modeling determines the
accuracy of reference levels. Kim and Newell (2014) pro-
posed a land-change model entitled “Geographic Emis-
sion Benchmark” that was specifically geared towards
constructing REDD reference levels. The performance
of GEB model was compared to that of GEOMOD,
which was the most widely used land-change model in
the context of REDD (Sloan and Pelletier, 2012; Kim,
2010; Dushku and Brown, 2003); GEB outperformed
GEOMOD in their case study. However, it was not clear
which component of GEB model actually contributed to the better performance: Was it quantity or allocation?
Verburg et al. (2004) categorized land-change model- ing into two parts: quantity and allocation. The “quan- tity” refers to the areal projection of land-change model- ing (e.g., how many hectares of forest will be converted to agricultural land?), while the “allocation” indicates the spatial configuration of the associated quantity (e.g., where will the conversion happen? Or where will those pixels be spatially allocated?). Pontius Jr. et al. (2008) also argued that it was important to separate these two components when assessing predictive accuracy of land- change models, otherwise it would not be possible to accurately compare any raster maps. For instance, if an outcome contains an inaccurate amount of pixels the outcome would not be able to get the perfect allocation;
in this case, to maximize the overall predictive accuracy it may be more strategic to improve the quantity part of land-change modeling first and then to improve the al- location part. That is, the idea of separating quantity and allocation is constructive as it supports advancement of predictive land-change modeling.
The research objective is to analyze and compare predictive accuracies of GEB and GEOMOD through applying different sets of quantity and allocation. In this research, two values of quantity are combined with two rank maps that show probable spatial allocation by GEB and GEOMOD to result in four predictive modeling outcomes. Their accuracies are measured by Figure of Merit (Kim, 2013b) and compared in order to see how they vary. Strictly speaking, the research is not about comparing GEB and GEOMOD per se but rather com- paring components of GEB and GEOMOD to compre- hend their true performance.
2. Data and Methods
1) Study area
A case study is conducted in Xishuangbanna Dai Autonomous Prefecture (hereafter, Banna) located in southwest Yunnan, China, where rubber plantations are regarded as “natural” forests by the central govern- ment (Xu, 2011). In other words, from the government’s perspective, intact tropical rainforests are identical to the rubber plantations. As a result, the latter has expanded rapidly along with the growing national economy since 1970s (Qiu, 2009; Li et al., 2008; 2007) because there have been no penalties or regulations for producing rub- ber, while its domestic demands to manufacture tires for automobiles and trucks have drastically increased (Figure 1). From a conservationist’s perspective, however, such expansion does not only threaten habitats of endangered animal species (e.g., white elephants) but also may risk the local carbon sequestration activities because the in- tact tropical rainforests are larger carbon pools compared to the rubber plantations (Xi, 2009).
2) Strategy
Calculation of a reference level is basically threefold:
first, areal change information of forestlands under the
BAU scenario is required along with the associated forest
carbon density information (Brown et al., 2007). When
the areal and density data are multiplied, the outcome
will yield mass information. Then, the mass information
should be converted to tonnes of carbon dioxide equiva-
lent (tCO
2e). The final conversion is crucial because
it is known that different GHGs have different global
warming potentials, so there is a need for using a unified
measurement that allows comparing varying climate
change impacts of different GHGs (Kim, 2013a). The
components of reference level are actually based on three
distinct sciences. Identifying areal change of forestlands is a major research topic in Land Change Science (Aspi- nall, 2006; Rindfuss et al., 2004; Veldkamp and Lam- bin, 2001), while measuring forest carbon stocks is inten- sively studied in Forest Science (Asner et al., 2010; Piao
et al., 2009; Brown, 1997). Carbon emission sources andpatterns are analyzed in Industrial Ecology (Newell and Vos, 2012; 2011; Graedel and Allenby, 2003). In sum, to produce a reliable reference level, all of these components should be considered in tandem systematically.
However, that may not be enough when one is to generate carbon credits and trade those in global carbon markets because there are additional methodological re- quirements mandated by international REDD policies/
protocols. If reference levels are not produced based on
such requirements, then no carbon credits would be able
to get registered for carbon markets, thus there would be
no trading. The most popular REDD protocol is man-
aged by Verifi ed Carbon Standard (VCS), and more than
half of the entire REDD projects at the global level rely
Figure 1. Rubber yield in Banna prefecture and Yunnan province, adapted from Kim (2013c) with permissionon VCS’s methodology (Diaz et al., 2011).
In this research, the land-change models are compared at two spatial scales, namely, Banna prefecture and Yun- nan province (Figure 2). Throughout the paper, data and methods will be explained solely at the Banna prefecture level because the analytical processes at this level is fun- damentally identical to those at the Yunnan province level, and due to the region’s relatively microscopic scale Banna’s maps show better visualization.
At the Banna prefecture level, different quantities are employed, which are actually driven from different rates of deforestation; GEB estimated 19.51% while GEO- MOD calibrated 15.75% (Kim and Newell, 2014). An identical deforestation rate is employed at the Yunnan province level. Measured by Figure of Merit (FoM), GEB and GEOMOD are compared at each spatial level;
hence, in total, four FoMs are produced and compared
to see how they differ with respect to different quantities and allocations.
Forest-cover data from Kim and Newell (2014) are used, and they are constituted of two time periods: 2005 and 2010. GEB are GEOMOD are similar in the sense that they both explicitly differentiate quantity and al- location when modeling land-change, but the ways that they calibrate quantity and allocation are different. In terms of quantity, GEB and GEOMOD both dictate quantity of future change via linear extrapolation (Pon- tius Jr. and Chen, 2006); this means that the two models assume the rate of deforestation will sustain the same for the consecutive time period. However, GEB calibrates quantity based on the spatial extent that is delineated by a Moran’s i-based local indicator of spatial association (LISA) whereas GEOMOD uses an arbitrary spatial extent for quantity calibration. Such difference is mainly
Figure 2. Map of the study area: Xishuangbanna Dai Autonomous Prefecture, Yunnan, China, adapted from Kim (2013c) with permission
why GEB and GEOMOD show distinct deforestation rates. In terms of allocation, GEB and GEOMOD both utilize rank maps that show different levels of transition potential. GEB solely relies on night-light data, while GEOMOD considers numerous spatial layers, such as elevation, slope, road network, etc., to rank pixels (Kim and Newell, 2014). For more details please find Kim and Newell (2014).
FoM assesses the predictive accuracy of a projected BAU deforestation by simply overlaying the observed forest-cover map of 2005, the predicted forest-cover map of 2010, and the observed forest-cover map of 2009 (Kim and Newell, 2014). Here, it is assumed that forest-cover does not change substantially within a year, thus the dif- ference in terms of forest-cover between 2009 and 2010 is negligible. The FoM is expressed mathematically as fol- lows:
Figure of Merit = B/(A+B+C)
where A is a number of pixels for “error due to ob- served change predicted as persistence” (or misses), B is a number of pixels for “correct due to observed change pre- dicted as change” (or hits), and C is a number of pixels for
“error due to observed persistence predicted as change”
(or false alarms). The FoM ranges from 0 to 100 percent, where 100 percent indicates perfect prediction (Pontius Jr. et al., 2008).
3. Results
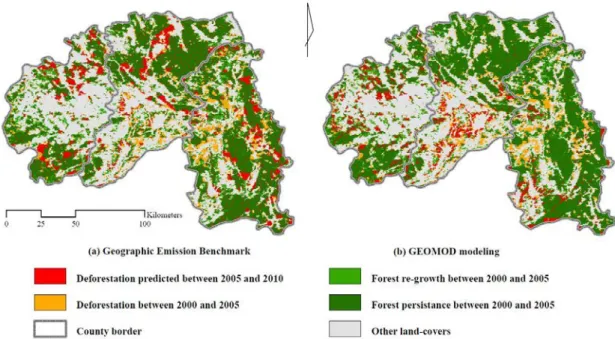
The purpose of the calculation was to compare the change of predictive accuracy with respect to different quantities and allocations. Figures 3a and 3b show the modeling outcomes of GEB and GEOMOD, respective- ly. Only the red pixels are predicted values, while the oth- er colors indicate observed change. The identical model run is conducted at the Yunnan province level, and the
Figure 3. Business-as-usual (BAU) projections by (a) Geographic Emission Benchmark (GEB) and (b) GEOMOD at the Banna prefecture level
results of Banna and Yunnan are assessed by FoM. The resulting FoMs are summarized in Table 1.
It turns out that the modeling outcomes show different accuracy results at the different spatial levels. Specifically at the Banna prefecture level, GEB’s FoM is larger than GEOMOD’s by 3.66%; however, at the Yunnan prov- ince level, GEOMOD outperformed GEB by 19.80%
(Table 1). The difference between the two land-change models’ performance at the Yunnan province level is ob- viously due to different allocations because the identical quantity is applied. In other words, GEOMOD’s alloca- tion is more accurate than GEB’s allocation, and this is the reason why GEOMOD shows a higher FoM than GEB at this spatial scale. In contrast, GEB’s performance is better than GEOMOD at the Banna prefecture level, and one could infer that GEB’s better performance at this spatial scale has to do with GEB’s quantity rather than al- location.
4. Conclusion and Discussions
In the previous study, it was demonstrated that the predictive modeling outcome of GEB was more accurate than that of GEOMOD measured by FoM (Kim and Newell, 2014), and it has turned out in this research that the true reason for the GEB’s better performance was due to quantity rather than allocation. The finding implies two major lessons. First, it appears important to note that through analyzing with the concepts of quantity and al- location one is able to clarify why or how a land-change
model might show higher accuracy than another. Sec- ond, it seems unreasonable and unrealistic to expect that a land-change model would demonstrate higher accuracy than others in a consistent or absolute way, so there is little point to conclude which model is better than the others when comparing land-change models’ perfor- mance. Rather, a comparison should be geared towards analyzing which components would contribute more to the corresponding accuracy.
The comparison conducted in this research is by na- ture partial, and this might be the main limitation of this research. GEB was first fitted at the Banna prefecture level and not re-fitted at the Yunnan province level, and the comparison of GEB and GEOMOD was conducted at the Yunnan province level. Therefore, it is not com- pletely fair to conclude that GEB performed worse than GEOMOD. Instead, it should be concluded that the GEB modeling fitted at the lower spatial level is not im- mediately suitable for portraying land-change at the up- per spatial level.
The outcomes of GEB and GEOMOD are not very accurate, and this has to be discussed. This result leads us to question the utility of using land-change models for setting reference levels. Sloan and Pelletier (2012) found through the national-scale case study in Panama that em- ploying spatial methods for setting reference level is not necessarily the most accurate. The finding is also analo- gous to that of previous studies (Gutiérrez-Vélez and Pon- tius Jr., 2012; Pelletier et al., 2011, 2012), and the authors instead stressed the importance of quality forest biomass data. Gutiérrez-Vélez and Pontius Jr. (2012) found that quantity of biomass was more influential in explaining
Table 1. Figure of Merits (FoMs) of Geographic Emission Benchmark (GEB) and GEOMOD modelingat the Banna prefecture and Yunnan province levels
Land-Change Model Banna Yunnan
GEB 30.16% 9.68%
GEOMOD 26.50% 29.48%
uncertainties embedded in reference level than quantity of deforested area; that is, their finding implies that a REDD project developer should invest more resources into improving the accuracy of biomass data than that of deforestation areal/locational projections, if he or she were to maximize the overall accuracy of reference level given limited resources. Pelletier et al. (2011, 2012) also argued that the quality of forest biomass data was one of the key parameters that influenced outcomes of land- change modeling applications for reference level setting.
Lastly, the purpose of using land-change models has to be specified explicitly. As pointed out by Castella et al.
(2007), land-change models have different objectives, and hence there are different ways to validate the models.
For instance, both the GEB and GEOMOD are “de- scriptive”(534) tools, according to Castella et al. (2007), and their goal is to forecast BAU trends of forest-cover loss as accurate as possible, and this makes them subject to thorough statistical validation procedures. On the other hand, a different kind of land-change model can be used to simply find out which proximate causes or under- lying driving forces are more influential to deforestation and/or forest degradation than others so that REDD stakeholders can specifically target the factors to reduce deforestation and/or forest degradation. In the case of GEB, the model cannot tell which environmental or so- cio-economic factors are more critical in terms of driving deforestation and forest degradation. In contrast, weight tables produced by GEOMOD or beta coefficients by logistic regression (Kim, 2013b) may give better sense of which driver needs to be actually targeted to reduce deforestation and/or forest degradation in reality. Thus, both the GEB and GEOMOD are subject to further sen- sitivity analyses, as are all other land-change models, and they must be applied to a REDD project with specific goals.
References
Asner, G. P., Powell, G. V. N., Mascaro, J., Knapp, D. E., Clark, J. K., Jacobson, J., Kennedy-Bowdoin,T. , Balaji, A., Paez-Acosta, G., Victoria, E., Secada, L., Valqui, M., and Hughes, R. F., 2010, High- resolution forest carbon stocks and emissions in the Amazon, Proceedings of the National Academy of Sci- ences, 107(38), 1-5.
Aspinall, R., 2006, Editorial, Journal of Land Use Science, 1(1), 1-4.
Baker, T. R. Phillips, O. L., Malhi, Y., Almeida, S., Arroyo, L., Di Fiore, A., Erwin, T., Higuchi, N., Killeen, T. J., Laurance, S. G., Laurance, W. F., Lewis, S. L., Mon- teagudo, A., Neill, D. A., Vargas, P. N., Pitman, N.
C. A., Silva, J. N. M., and Martínez, R. V., 2004, Increasing biomass in Amazonian forest plots, Philo- sophical Transactions of the Royal Society of London.
Series B, Biological Sciences, 359(1443), 353-65.
Brown, S., 1997, Estimating Biomass and Biomass Change of Tropical Forests: A Primer (FAO Forestry Paper 134), Food and Agriculture Organization (FAO), Rome.
Brown, S., Hall, M., Andrasko, K., Ruiz, F., Marzoli, W., Guerrero, G., Masera, O., Dushku, A., DeJong, B., and Cornell, J., 2007, Baselines for land-use change in the tropics: Application to avoided deforestation projects, Mitigation and Adaptation Strategies for Global Change, 12(6), 1001-26.
Castella, J.-C., Kam, S. P., Quang, D. D., Verburg, P. H., and Hoanh, C. T., 2007, Combining top-down and bottom-up modelling approaches of land use/
cover change to support public policies: Application to sustainable management of natural resources in northern Vietnam, Land Use Policy, 24(3), 531-45.
Cramer, W., Bondeau, A., Schaphoff, S., Lucht, W., Smith, B., and Sitch, S., 2004, Tropical forests and the global carbon cycle: Impacts of atmospheric carbon diox- ide, climate change and rate of deforestation, Philo- sophical Transactions of the Royal Society of London.
Series B, Biological Sciences, 359(1443), 331-43.
Diaz, D., Hamilton, K., and Johnson, E., 2011, State of the Forest Carbon Markets 2011: From Canopy to Cur-
rency, Ecosystem Marketplace, Washington DC.
Dushku, A. and Brown, S., 2003, Spatial Modeling of Base- lines for LULUCF Carbon Projects: The GEOMOD Modeling Approach, Winrock International, Manila.
FAO, UNDP, and UNEP, 2008, UN Collaborative Pro- gramme on Reducing Emissions from Deforestation and Forest Degradation in Developing Countries (UN- REDD), Food and Agriculture Organization of the United Nations (FAO), Rome; United Nations Development Programme (UNDP), New York; and United Nations Environment Programme (UNEP), Nairobi.
Gibson, L., Lee, T. M., Koh, L. P., Brook, B. W., Gardner, T. A., Barlow, J., Peres, C. A., Bradshaw, C. J. A., Laur- ance, W. F., Lovejoy, T. E., and Sodhi, N. S., 2011, Primary forests are irreplaceable for sustaining tropi- cal biodiversity, Nature, 478, 378-81.
Graedel, T. E. and Allenby, B. R., 2003, Industrial ecology (2nd ed.), Prentice Hall, Upper Saddle River.
Gutiérrez-Vélez, V. H. and Pontius Jr., R. G., 2012, Influence of carbon mapping and land change modelling on the prediction of carbon emissions from deforesta- tion, Environmental Conservation, 39(4), 325-36.
Huettner, M., Leemans, R., Kok. K., and Ebeling, J., 2009, A comparison of baseline methodologies for ‘Reduc- ing Emissions from Deforestation and Degradation’, Carbon Balance and Management, 4(4).
IPCC, 2006, 2006 IPCC Guidelines for National Greenhouse Gas Inventories, Institute for Global Environmental Strategies for the Intergovernmental Panel on Cli- mate Change (IPCC), Kanagawa.
Johnson, D. L. and Lewis, L. A., 2007, Land Degradation (2nd ed.), Rowman and Littlefield Publishers Inc, Lanham.
Kim, O. S., 2010, An assessment of deforestation models for reducing emissions from deforestation and forest degradation (REDD), Transactions in GIS, 14(5), 631-45.
Kim, O. S., 2013a, In pursuit of low carbon cities: Under- standing limitations of ICLEI’ International Local Government Greenhouse Gas Emissions Protocol, Journal of the Korean Geographical Society, 48(1), 151-
65.
Kim, O. S., 2013b, Assessing the metric to measuring land- use change suitability, Journal of the Economic Geo- graphical Society of Korea, 16(3), 458-71.
Kim, O. S., 2013c, A Spatially Explicit Approach to Measur- ing Carbon Dynamics for Reducing Emissions from Deforestation and Forest Degradation: A Case Study of Chinese Forests, Ph.D. Dissertation, University of Southern California, Los Angeles.
Kim, O. S. and Newell, J. P., 2014, The ‘Geographic Emission Benchmark’ model: A baseline approach to measur- ing emissions associated with deforestation and deg- radation, Journal of Land Use Science (advance online publication).
Li, H., Aide, T. M., Ma, Y., Liu, W., and Cao, M., 2007, De- mand for rubber is causing the loss of high diversity rain forest in SW China, Biodiversity and Conserva- tion, 16, 1731-45.
Li, H., Ma, Y., Aide, T. M., and Liu, W., 2008, Past, present and future land-use in Xishuangbanna, China and the implications for carbon dynamics, Forest Ecology and Management, 255(1), 16-24.
Malhi, Y., Roberts, J. T., Betts, R. A., Killeen, T. J., Li, W., and Nobre, C. A., 2008, Climate change, deforesta- tion, and the fate of the Amazon, Science, 319, 169- 72.
Moutinho, P. and Schwartzman, S.(eds.), 2005, Tropical Deforestation and Climate Change, Amazon Envi- ronmental Research Institue (IPAM), Belem; and Environmental Defense Fund, Washington D.C..
Newell, J. P. and Vos, R. O., 2011, “Papering” over space and place: Product carbon footprint modeling in the global paper industry, Annals of the Association of American Geographers, 101(4), 1-12.
Newell, J. P. and Vos, R. O., 2012, Accounting for forest carbon pool dynamics in product carbon footprints:
Challenges and opportunities, Environmental Im- pact Assessment Review, 37, 23-36.
Pelletier, J., Kirby, K. R., and Potvin, C., 2012, Significance of carbon stock uncertainties on emission reductions from deforestation and forest degradation in devel- oping countries, Forest Policy and Economics, 24,
3-11.
Pelletier, J., Ramankutty, N., and Potvin, C., 2011, Diagnos- ing the uncertainty and detectability of emission re- ductions for REDD+ under current capabilities: An example for Panama, Environmental Research Letters, 6(2), 024005.
Piao, S., Fang, J., Ciais, P., Peylin, P., Huang, Y., Sitch, S., and Wang, T., 2009, The carbon balance of terrestrial ecosystems in China, Nature, 458, 1009-13.
Pongratz, J., Bounoua, L., DeFries, R. S., Morton, D. C., An- derson, L. O., Mauser, W., and Klink, C. A., 2006, The impact of land cover change on surface energy and water balance in Mato Grosso, Brazil, Earth In- teractions, 10(19), 1-17.
Pontius Jr., R. G., Boersma, W., Castella, J.-C., Clarke, K., Nijs, T., Dietzel, C., Duan, Z., Fotsing, E., Gold- stein, N., Kok, K., Koomen, E., Lippitt, C. D., McConnell, W., Mohd Sood, A., Pijanowski, B., Pithadia, S., Sweeney, S., Trung, T. N., Veldkamp, A. T., and Verburg, P. H., 2008, Comparing the in- put, output, and validation maps for several models of land change, Annals of Regional Science, 42, 11-37.
Pontius Jr., R. G. and Chen, H., 2006, GEOMOD Modeling, Clark Labs, Clark University, Worcester.
Qiu, J., 2009, Where the rubber meets the garden, Nature, 457(7227), 24624-7.
Ramankutty, N., Gibbs, H. K., Achard, F., DeFries, R. S., Foley, J. A., and Houghton, R. A., 2007, Challenges to estimating carbon emissions from tropical defor- estation, Global Change Biology, 13(1), 51-66.
Rindfuss, R. R., Walsh, S. J., Turner Jr., B. L., Fox, J., and Mishra, V., 2004, Developing a science of land change: Challenges and methodological issues, Pro- ceedings of the National Academy of Sciences, 101(39), 13976-81.
Robbins, P., 2004, Political Ecology: A Critical Introduction, Blackwell Publishing Ltd, Oxford.
Shanley, P. and Luz, L., 2003, The Impacts of Forest Deg- radation on Medicinal PlantUse and Implications for Health Care in Eastern Amazonia, BioScience, 53(6), 573-84.
Sloan, S. and Pelletier, J., 2012, How accurately may we
project tropical forest-cover change? A validation of a forward-looking forest baseline for reduced emis- sions from deforestation and degradation, Global Environmental Change, 22(2), 440-53.
The Economist, 2010, A special report on forests, The Econo- mist, New York.
UNFCCC, 1998, Kyoto Protocol to the United Nations Frame- work Convention on Climate Change, United Nations Framework Convention on Climate Change (UN- FCCC), Kyoto.
VCS, 2013, VCS Module VMD0007 REDD Methodological Module: Estimation of Baseline Carbon Stock Changes and Greenhouse Gas Emissions from Unplanned De- forestation (BL-UP), Version 3.1, Verified Carbon Standard (VCS), Washington D.C..
Veldkamp, T. A. and Lambin, E. F., 2001, Predicting land- use change, Agriculture, Ecosystems and Environment, 85(1-3), 1-6.
Verburg, P. H., Schot, P. P., Dijst, M. J., and Veldkamp, A., 2004, Land use change modelling: Current practice and research priorities, GeoJournal, 61(4), 309-24.
Xi, J., 2009, Valuation of Ecosystem Services in Xishuangbanna Biodiversity Conservation Corridors Initiative Pilot Site, China, Asian Development Bank, Mandaluy- ong.
Xu, J., 2011, China’ new forests aren’t as green as they seem, Nature, 477, 371.
Zhang, Q., Bennett, M. T., Kannan, K., and Jin, L., 2010, Payments for Ecological Services and Eco-Compensa- tion: Practices and Innovations in the People’s Republic of China, Asian Development Bank, Mandaluyong.
교신: 김오석, 339-007, 세종특별자치시 시청대로 370
세종국책연구단지 B동(과학·인프라동) 한국환경정책·
평가연구원(이메일: [email protected])
Correspondence: Oh Seok Kim, 339-007, Korea Environ- ment Institute, #1023, Bldg B, 370 Sicheong-daero, Sejong, Korea (e-mail: [email protected])
Recieved May 17, 2015 Revised June 8, 2015 Accepted June 17, 2015