Associations of Metabolic Syndrome with Total
Testosterone and Homocysteine Levels in Male Korean Workers
Sook Hee Sung, Nam Hee Kim, Sun Pyo Hong, Jong-Keun Lee, Seung Jin Choi Radiation Health Institute, Korea Hydro and Nuclear Power Co., Ltd., Seongnam, Korea
Background: Low testosterone is associated with metabolic syndrome (MetS), and homocysteine (Hcy) is elevated in individuals with MetS. We investigated the relationships of total testosterone (TT) and serum Hcy levels with MetS in male Korean workers.
Methods: We conducted a cross-sectional study including 8,606 male workers, aged 20 to 58 years, who underwent a physical ex- amination in 2015. MetS was diagnosed based on the criteria of the 2009 harmonized definition, while the Korean standard for waist circumference (WC) was used. Participants’ biochemical parameters, including TT and serum Hcy, were measured, and participants were divided into quartiles. Multiple logistic regression models were used to estimate the association of MetS and its individual components depending on TT and serum Hcy quartiles.
Results: The prevalence of MetS in the study population was 16%. TT was lower in participants with MetS than in those without MetS (P<0.001). By contrast, Hcy level was similar between groups (P=0.694). In multiple logistic regression analysis, the odds ratio for the lowest TT quartile was 1.29 (95% confidence interval, 1.06 to 1.57) after adjusting for potential confounders. Partici- pants with lower TT were more likely to have high WC, hypertriglyceridemia, and low high density lipoprotein levels. Serum Hcy levels were not significantly associated with MetS. Of the five components of MetS, only WC was significantly associated with se- rum Hcy.
Conclusion: In male Korean workers, TT may be an independent predictor of MetS, and serum Hcy levels could be a marker of ab- dominal obesity. However, future prospective studies are needed.
Keywords: Testosterone; Homocysteine; Metabolic syndrome; Odds ratio
INTRODUCTION
The prevalence of metabolic syndrome (MetS) has increased worldwide in recent decades and has become an important pub- lic health problem globally. In Korea, the prevalence of MetS increased from an age-standardized rate of 24.9% in 1998 to 31.3% in 2007 [1]. MetS is diagnosed when a patient has a clus-
ter of cardiovascular risk factors, including abdominal obesity, hypertriglyceridemia, low high density lipoprotein cholesterol (HDL-C) levels, hyperglycemia, and hypertension. MetS pa- tients are at an elevated risk of cardiovascular disease (CVD) and type 2 diabetes mellitus (DM) [2].
Several epidemiological studies have linked low total testos- terone (TT) level to MetS [3-5]. Some prospective studies have
Received: 19 January 2019, Revised: 8 March 2019, Accepted: 12 March 2019 Corresponding author: Seung Jin Choi
Radiation Health Institute, Korea Hydro and Nuclear Power Co., Ltd., 172 Dolma-ro, Bundang-gu, Seongnam 13605, Korea
Tel: +82-31-289-3560, Fax: +82-31-289-3569, E-mail: [email protected]
Copyright © 2019 Korean Endocrine Society
This is an Open Access article distributed under the terms of the Creative Com- mons Attribution Non-Commercial License (http://creativecommons.org/
licenses/by-nc/4.0/) which permits unrestricted non-commercial use, distribu- tion, and reproduction in any medium, provided the original work is properly cited.
demonstrated that low TT levels predict MetS development [6,7]. Furthermore, both cross-sectional and longitudinal studies have reported that low TT levels are associated with increased fat deposition, resulting in insulin resistance and abdominal obesity [8,9]. This bidirectional relationship leads to the devel- opment of MetS, as well as type 2 DM and CVD [10].
Homocysteine (Hcy) is involved in the metabolism of methi- onine as a sulfur-containing amino acid. Hyperhomocystein- emia is an independent risk factor for atherosclerosis and is in- duced by endothelial dysfunction, smooth muscle cell prolifera- tion, oxidative stress, and hemostasis [11]. Thus, it can cause CVD and cerebrovascular disease [12]. Hyperhomocysteinemia is also associated with insulin resistance and MetS, although some studies have reported conflicting findings [13,14].
The relationship between MetS and TT or serum Hcy levels has been studied in different populations worldwide. It is neces- sary to study larger populations with diverse characteristics. In this study, we investigated whether TT and serum Hcy levels were associated with MetS and metabolic components and whether they could be used as predictors of MetS among male Korean workers, as a population different from those investigat- ed in previous studies.
METHODS
Subjects
This cross-sectional study enrolled male Korean industrial workers who underwent an annual health check-up in 2015. The study population included 8,769 men aged 20 to 58 years. From this population, individuals who were taking testosterone or ste- roidal agents that could affect serum testosterone level or who had neoplastic, severe liver, or renal disease were excluded. A total of 8,606 men were included in this analysis. The study was approved by the Institutional Review Board of Hanil Hospital, Seoul, Korea (2014-H-001), and written informed consent was obtained from each participant.
Measurements
Participants fasted for at least 8 hours before the study. Body weight, height, and blood pressure (BP) were measured using standard techniques. Body mass index (BMI) was calculated as weight (kg) divided by height squared (m2). Waist circumfer- ence (WC) was measured at the level midway between the low- est rib and the iliac crest. Fasting blood samples were collected from the antecubital vein and analyzed biochemically and im- munologically using a Cobas c702 module (Cobas, Roche Di-
agnostics, Basel, Switzerland). Fasting plasma glucose (FPG) levels were measured using an enzymatic reference method with hexokinase. Triglyceride (TG) and uric acid (UA) levels were measured using an enzymatic colorimetric method. Low density lipoprotein cholesterol (LDL-C) and HDL-C levels were assessed using a homogeneous, enzymatic, colorimetric assay. Serum creatinine levels were measured using a kinetic colorimetric assay. Serum high-sensitivity C-reactive protein (hs-CRP) levels were assayed by particle-enhanced immunotur- bidimetry. TT levels were measured by a radioimmunoassay us- ing DIAsource TESTO-RIA-CT Kits (DIAsource ImmunoAs- says S.A., Louvain-la-Neuve, Belgium); the intra-assay coeffi- cient of variance (CV) was 3.3% to 4.6%, and the inter-assay CV was 4.8% to 6.2%. Liquid stable 2-part homocysteine re- agent kits and an Axis-Shield Calibrator (Axis-Shield Diagnos- tics Ltd., Dundee, Scotland United Kingdom) were used to de- termine serum Hcy levels. The intra-assay and inter-assay CV was 1.3% to 2.1% and 1.1% to 1.3%, respectively. Insulin levels were measured using [125I] immunoradiometric assay (IRMA) Kits. Homeostasis model assessment of insulin resistance (HOMA-IR) was calculated using the following equation: [glu- cose (mg/dL)×insulin (μU/mL)]/405. All participants complet- ed a questionnaire on health-related behavior. Behavioral risk factors included smoking status (non-smoker, former smoker, or current smoker), alcohol consumption (non-drinker or drinker;
drinkers defined as those who consumed alcohol more than once a week), and exercise. Exercise was defined as above rec- ommended physical activity (PA) if an individual engaged in moderately intense aerobic PA (e.g., badminton or ping-pong) for at least 20 minutes for 5 days a week; vigorously intense ac- tivity (e.g., running or mountain climbing) for at least 20 min- utes 4 days a week; or walking for 20 minutes every day. Less intense levels of exercise were considered to be below recom- mended PA.
Definition of MetS
We defined MetS using criteria based on the 2009 harmonized definition [15]. A diagnosis of MetS was made if three of the fol- lowing criteria were met: (1) WC ≥90 cm; (2) TG ≥150 mg/dL or receiving medical treatment for elevated TG levels; (3) HDL- C <40 mg/dL; (4) BP ≥130/85 mm Hg or current use of anti- hypertensive medications; (5) FPG ≥100 mg/dL or receiving treatment for previously diagnosed type 2 DM. The WC cut-off was set in accordance with the ethnically appropriate abdominal obesity criteria for Koreans as put forth by the Korean Society for the Study of Obesity [16].
Statistical analysis
The characteristics of participants are summarized as mean±stan- dard deviation for continuous variables or as frequencies and per- centages for categorical variables. Comparisons of participants with and without MetS were performed using the Student t tests for continuous variables and the chi-square test for categorical vari- ables. Pearson correlation analysis was applied to evaluate the correlations between TT or serum Hcy level and continuous vari- ables, and Spearman rank correlation analysis was used for cate- gorical variables. Participants were divided into quartiles based on their TT level (Q1, ≤5.08 ng/mL; Q2, 5.09 to 6.23 ng/mL;
Q3, 6.24 to 7.64 ng/mL; and Q4, ≥7.65 ng/mL) and serum Hcy level (Q1, ≥12.21 μmol/L; Q2, 10.51 to 12.10 μmol/L; Q3, 9.11 to 10.50 μmol/L; and Q4, ≤9.10 μmol/L). The effects of TT and serum Hcy quartile were tested using analysis of variance (ANO- VA) for continuous variables and the Kruskal-Wallis test for di- chotomous variables. We also performed multiple logistic re- gression analyses to evaluate associations between TT and serum Hcy quartiles and the prevalence of MetS. Age, alcohol consump- tion, smoking status, hs-CRP, HOMA-IR, and BMI were includ- ed to investigate the influence of potential confounders. Odds ra- tios (ORs) and 95% confidence intervals (CIs) were estimated to determine the risk of MetS for each quartile. In addition, we ex- amined the association between TT and serum Hcy quartiles and each MetS component separately. All analyses were con- ducted using SPSS for Windows version 15.0 (SPSS Inc., Chi- cago, IL, USA). P values <0.05 were considered statistically significant.
RESULTS
Characteristics of the study population
The clinical characteristics of the study participants are present- ed in Table 1. The mean age of participants with MetS and with- out MetS was 45.1±8.2 and 39.9±9.4 years, respectively (P<
0.001). The prevalence of MetS in the study population was 16%.
TT levels were significantly lower in individuals with MetS than in those without MetS (P<0.001). Serum Hcy levels were not significantly different according to the presence of MetS (P=
0.694). However, WC, BMI, BP, FPG, TG, LDL-C, HOMA-IR, hs-CRP, alcohol consumption status, and smoking status were significantly higher in individuals with MetS (P<0.001). There was no significant difference in PA between groups (P=0.097), but HDL-C levels were significantly lower in individuals with MetS (P<0.001).
Relationships of clinical characteristics with TT and serum Hcy levels
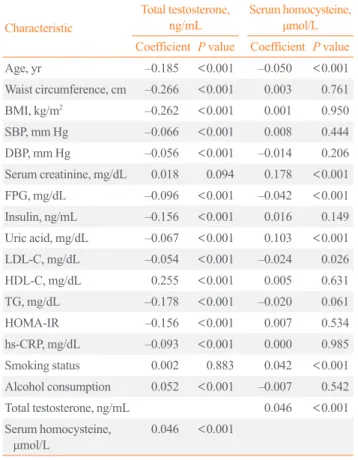
TT levels were correlated with all variables except smoking sta- tus. Serum Hcy levels, in contrast, showed significant correla- tions only with UA, FPG, LDL-C, and smoking status. Unlike what was observed for TT levels, there was an almost negligible correlation with age. Furthermore, TT and serum Hcy levels
Table 1. General Characteristics of Study Participants (n=
8,606)
Characteristic Men without MetS (n=7,037)
Men with MetS
(n=1,569) P value
Age, yr 39.9±9.4 45.1±8.2 <0.001
Waist circumference, cm 82.3±6.5 90±7 <0.001
BMI, kg/m2 23.9±2.6 26.8±2.9 <0.001
SBP, mm Hg 117.8±10.1 127.1±12.1 <0.001
DBP, mm Hg 75.6±8.6 82.7±9.3 <0.001
Serum creatinine, mg/dL 0.9±0.1 0.9±0.2 0.630
FPG, mg/dL 94.4±13.4 109.2±23.5 <0.001
Insulin, ng/mL 6±4 9.6±6.8 <0.001
Uric acid, mg/dL 5.9±1.2 6.3±1.3 <0.001
LDL-C, mg/dL 124±30 130.1±33 <0.001
HDL-C, mg/dL 53.9±12.7 43±10.7 <0.001
TG, mg/dL 115.8±68.6 215.7±121.7 <0.001
HOMA-IR 1.4±1.1 2.6±2.1 <0.001
hs-CRP, mg/dL 0.09±0.33 0.13±0.35 <0.001 Total testosterone, ng/mL 6.6±2 5.8±1.8 <0.001 Homocysteine, μmol/L 11.3±4.4 11.3±4.2 0.694
Smoking status <0.001
Current smoker 1,969 (28.0) 615 (39.2) Former smoker 2,159 (30.7) 568 (36.2) Never smoker 2,909 (41.3) 386 (24.6)
Alcohol consumption <0.001
≤Once a week 4,878 (69.3) 961 (61.2) ≥Twice a week 2,159 (30.7) 608 (38.8)
Exercise 0.097
Below recommended PA 4,814 (68.4) 1,107 (70.6) Above recommended PA 2,223 (31.6) 462 (29.4) Values are expressed as mean±SD or number (%).
MetS, metabolic syndrome; BMI, body mass index; SBP, systolic blood pressure; DBP, diastolic blood pressure; FPG, fasting plasma glucose;
LDL-C, low density lipoprotein cholesterol; HDL-C, high density lipo- protein cholesterol; TG, triglyceride; HOMA-IR, homeostatic model assessment of insulin resistance; hs-CRP, high-sensitivity C-reactive protein; PA, physical activity.
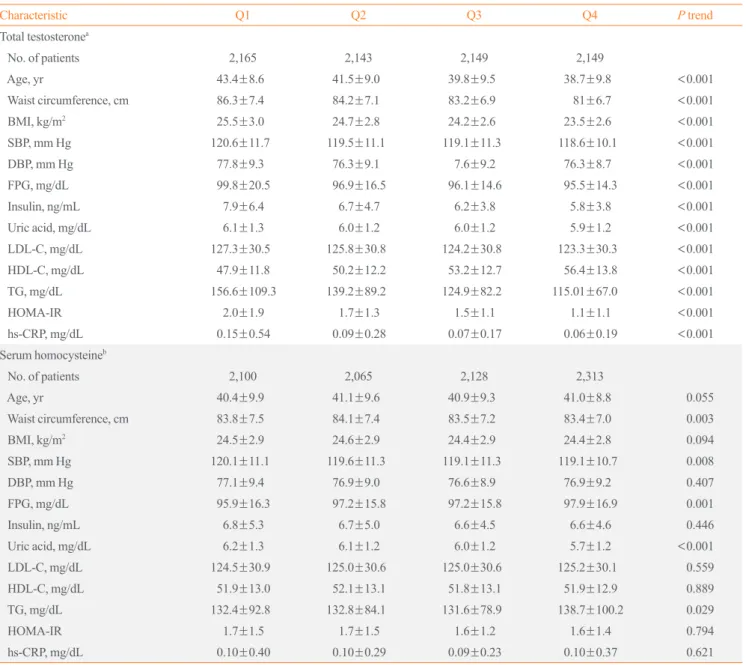
showed reciprocally very weak correlations (Table 2). We ana- lyzed clinical characteristics, including the individual compo- nents of MetS, depending on TT and serum Hcy quartiles using ANOVA (Table 3). Mean values for age, WC, BMI, BP, FPG, lipid levels, UA levels, hs-CRP, and HOMA-IR increased among lower TT quartiles, except for HDL-C, which exhibited an inverse relationship with TT quartile (P<0.001). Higher se- rum Hcy quartiles were positively related to WC (P=0.003), systolic BP (P=0.008), UA (P<0.001), and TG (P=0.029).
However, unexpectedly, FPG decreased in higher serum Hcy quartiles (P=0.001). The number of MetS components and the prevalence of MetS were higher among participants with lower TT quartiles (P<0.001) (Fig. 1). However, serum Hcy quartile was not significantly related with MetS prevalence (P=0.361).
Associations of MetS with TT and serum Hcy levels ORs with 95% CIs for the prevalence of MetS depending on TT and serum Hcy quartiles are shown in Table 4. The highest TT and lowest serum Hcy quartiles were used as reference groups.
Additive logistic regression models were customized to assess the potential confounding effect of various participant charac-
Table 2. Bivariate Analysis of the Correlations between Total Testosterone, Serum Homocysteine Levels, and Clinical Char- acteristics
Characteristic
Total testosterone,
ng/mL Serum homocysteine, μmol/L Coefficient P value Coefficient P value Age, yr –0.185 <0.001 –0.050 <0.001 Waist circumference, cm –0.266 <0.001 0.003 0.761
BMI, kg/m2 –0.262 <0.001 0.001 0.950
SBP, mm Hg –0.066 <0.001 0.008 0.444
DBP, mm Hg –0.056 <0.001 –0.014 0.206
Serum creatinine, mg/dL 0.018 0.094 0.178 <0.001 FPG, mg/dL –0.096 <0.001 –0.042 <0.001 Insulin, ng/mL –0.156 <0.001 0.016 0.149 Uric acid, mg/dL –0.067 <0.001 0.103 <0.001 LDL-C, mg/dL –0.054 <0.001 –0.024 0.026 HDL-C, mg/dL 0.255 <0.001 0.005 0.631
TG, mg/dL –0.178 <0.001 –0.020 0.061
HOMA-IR –0.156 <0.001 0.007 0.534
hs-CRP, mg/dL –0.093 <0.001 0.000 0.985 Smoking status 0.002 0.883 0.042 <0.001 Alcohol consumption 0.052 <0.001 –0.007 0.542 Total testosterone, ng/mL 0.046 <0.001 Serum homocysteine,
μmol/L 0.046 <0.001
BMI, body mass index; SBP, systolic blood pressure; DBP, diastolic blood pressure; FPG, fasting plasma glucose; LDL-C, low density lipo- protein cholesterol; HDL-C, high density lipoprotein cholesterol; TG, triglyceride; HOMA-IR, homeostatic model assessment of insulin resis- tance; hs-CRP, high-sensitivity C-reactive protein.
1.8 1.6 1.4 1.2 1.0 0.8 0.6 0.4 0.2 0
30
25
20
15
10
5
0 The number of metabolic componentsThe prevalence of metabolic syndrome (%)
Quartiles
Quartiles
TT Hcy
TT Hcy Q1
Q1
Q2
Q2
Q3
Q3
Q4
Q4
Fig. 1. Distribution of the prevalence of metabolic syndrome (MetS) and the number of MetS components depending on total testosterone (TT) and serum homocysteine (Hcy) quartiles in 8,606 male workers. (A) The number of MetS components was signifi- cantly different from the first (Q1) to the fourth (Q4) TT quartiles (P<0.001). However, the number of MetS components was not re- lated to serum Hcy quartile (P=0.361). (B) The prevalence of MetS showed similar relationships with TT and serum Hcy quartiles (P<0.001 and P=0.361, respectively).
A
B
teristics. The OR for MetS increased among lower TT quartiles.
The unadjusted OR for MetS in the lowest TT quartile com- pared with the highest quartile was 3.18 (95% CI, 2.67 to 3.80) in the crude model (model 1). After adjusting for confounding factors, including age (model 2), alcohol consumption and smoking status (model 3), hs-CRP (model 4), and HOMA-IR
(model 5), the ORs for MetS in the lowest TT quartile did not significantly change. However, after adjusting for BMI (model 6), the OR decreased to 1.29 (95% CI, 1.06 to 1.57), which was a weakened but still significant association. By contrast, serum Hcy quartile was not significantly associated with MetS in any model.
Table 3. Clinical Characteristics of Participants Based on Total Testosterone and Serum Homocysteine Level Quartiles
Characteristic Q1 Q2 Q3 Q4 P trend
Total testosteronea
No. of patients 2,165 2,143 2,149 2,149
Age, yr 43.4±8.6 41.5±9.0 39.8±9.5 38.7±9.8 <0.001
Waist circumference, cm 86.3±7.4 84.2±7.1 83.2±6.9 81±6.7 <0.001
BMI, kg/m2 25.5±3.0 24.7±2.8 24.2±2.6 23.5±2.6 <0.001
SBP, mm Hg 120.6±11.7 119.5±11.1 119.1±11.3 118.6±10.1 <0.001
DBP, mm Hg 77.8±9.3 76.3±9.1 7.6±9.2 76.3±8.7 <0.001
FPG, mg/dL 99.8±20.5 96.9±16.5 96.1±14.6 95.5±14.3 <0.001
Insulin, ng/mL 7.9±6.4 6.7±4.7 6.2±3.8 5.8±3.8 <0.001
Uric acid, mg/dL 6.1±1.3 6.0±1.2 6.0±1.2 5.9±1.2 <0.001
LDL-C, mg/dL 127.3±30.5 125.8±30.8 124.2±30.8 123.3±30.3 <0.001
HDL-C, mg/dL 47.9±11.8 50.2±12.2 53.2±12.7 56.4±13.8 <0.001
TG, mg/dL 156.6±109.3 139.2±89.2 124.9±82.2 115.01±67.0 <0.001
HOMA-IR 2.0±1.9 1.7±1.3 1.5±1.1 1.1±1.1 <0.001
hs-CRP, mg/dL 0.15±0.54 0.09±0.28 0.07±0.17 0.06±0.19 <0.001
Serum homocysteineb
No. of patients 2,100 2,065 2,128 2,313
Age, yr 40.4±9.9 41.1±9.6 40.9±9.3 41.0±8.8 0.055
Waist circumference, cm 83.8±7.5 84.1±7.4 83.5±7.2 83.4±7.0 0.003
BMI, kg/m2 24.5±2.9 24.6±2.9 24.4±2.9 24.4±2.8 0.094
SBP, mm Hg 120.1±11.1 119.6±11.3 119.1±11.3 119.1±10.7 0.008
DBP, mm Hg 77.1±9.4 76.9±9.0 76.6±8.9 76.9±9.2 0.407
FPG, mg/dL 95.9±16.3 97.2±15.8 97.2±15.8 97.9±16.9 0.001
Insulin, ng/mL 6.8±5.3 6.7±5.0 6.6±4.5 6.6±4.6 0.446
Uric acid, mg/dL 6.2±1.3 6.1±1.2 6.0±1.2 5.7±1.2 <0.001
LDL-C, mg/dL 124.5±30.9 125.0±30.6 125.0±30.6 125.2±30.1 0.559
HDL-C, mg/dL 51.9±13.0 52.1±13.1 51.8±13.1 51.9±12.9 0.889
TG, mg/dL 132.4±92.8 132.8±84.1 131.6±78.9 138.7±100.2 0.029
HOMA-IR 1.7±1.5 1.7±1.5 1.6±1.2 1.6±1.4 0.794
hs-CRP, mg/dL 0.10±0.40 0.10±0.29 0.09±0.23 0.10±0.37 0.621
Values are expressed as mean±SD.
BMI, body mass index; SBP, systolic blood pressure; DBP, diastolic blood pressure; FPG, fasting plasma glucose; LDL-C, low density lipoprotein cho- lesterol; HDL-C, high density lipoprotein cholesterol; TG, triglyceride; HOMA-IR, homeostatic model assessment of insulin resistance; hs-CRP, high- sensitivity C-reactive protein.
aTotal testosterone (ng/mL): Q1 (≤5.08), Q2 (5.09 to 6.23), Q3 (6.24 to 7.64), Q4 (≥7.65); bSerum homocysteine (μmol/L): Q1 (≥12.21), Q2 (10.51 to 12.20), Q3 (9.11 to 10.50), Q4 (≤9.10).
Associations of individual components of MetS with TT and serum Hcy levels
The associations of TT and serum Hcy quartiles with each com- ponent of MetS were assessed after adjusting for age, alcohol consumption, smoking status, hs-CRP, and HOMA-IR (Table 5). TT quartile remained significantly associated with high WC, high TG, and low HDL-C levels (P<0.001). However, serum Hcy quartile was only significantly associated with WC (P=
0.021). After adjusting for BMI, the associations of TT and se-
rum Hcy quartile with WC were no longer significant (data not shown).
DISCUSSION
We observed that TT levels were significantly associated with MetS after adjusting for age, alcohol consumption, smoking status, hs-CRP, HOMA-IR, and BMI. In addition, TT levels were associated with the individual MetS components of high Table 4. Odds Ratios of Metabolic Syndrome Depending on Total Testosterone and Serum Homocysteine Quartiles
Total testosterone Serum homocysteine
Q4 Q3 Q2 Q1 Q4 Q3 Q2 Q1
Model 1 1.000 1.000
Exp(B) 1.415 2.024 3.184 1.059 1.145 1.097
Lower 1.180 1.702 2.666 0.908 0.982 0.941
Upper 1.697 2.407 3.803 1.236 1.336 1.280
P value <0.001 <0.001 <0.001 0.464 0.084 0.237
Model 2 1.000 1.000
Exp(B) 1.354 1.806 2.644 1.064 1.128 1.121
Lower 1.125 1.514 2.232 0.908 0.964 0.957
Upper 1.628 2.154 3.132 1.246 1.320 1.312
P value <0.001 <0.001 <0.001 0.443 0.133 0.157
Model 3 1.000 1.000
Exp(B) 1.376 1.862 2.801 1.072 1.104 1.084
Lower 1.143 1.559 2.360 0.915 0.943 0.924
Upper 1.657 2.225 3.323 1.257 1.294 1.270
P value <0.001 <0.001 <0.001 0.388 0.219 0.322
Model 4 1.000 1.000
Exp(B) 1.374 1.854 2.766 1.075 1.105 1.081
Lower 1.141 1.552 2.330 0.917 0.943 0.922
Upper 1.654 2.214 3.283 1.260 1.295 1.267
P value 0.001 <0.001 <0.001 0.375 0.215 0.339
Model 5 1.000 1.000
Exp(B) 1.304 1.662 2.125 1.072 1.107 1.053
Lower 1.073 1.378 1.771 0.905 0.935 0.888
Upper 1.584 2.004 2.549 1.269 1.311 1.249
P value 0.008 <0.001 <0.001 0.423 0.240 0.551
Model 6 1.000 1.000
Exp(B) 1.062 1.226 1.294 1.029 0.989 0.986
Lower 0.863 1.004 1.064 0.859 0.825 0.821
Upper 1.306 1.497 1.573 1.234 1.186 1.183
P value 0.569 0.045 0.010 0.753 0.906 0.877
Model 1, crude odds ratios; Model 2, adjusted for age; Model 3, adjusted for model 2 plus alcohol consumption and smoking status; Model 4, adjusted for model 3 plus high-sensitivity C-reactive protein; Model 5, adjusted for model 4 plus homeostatic model assessment-insulin resistance; Model 6, ad- justed for model 5 plus body mass index.
WC, hypertriglyceridemia, and low HDL.
The findings of a relationship between TT and MetS, even af- ter adjusting for multiple confounders, are consistent with the results of numerous epidemiological studies. When adjusting for BMI and HOMA-IR, the strength of the associations de- creased appreciably but remained significant, suggesting that these factors play a role in the observed associations. Muller et al. [17] found that higher testosterone levels were associated with a reduced risk of MetS independently of insulin level and BMI. A cross-sectional study in Korea reported that TT was negatively associated with the prevalence of MetS independent- ly of BMI [18]. Brand et al. [3] re-analyzed data from 20 obser- vational studies and found that the relationship between TT and
MetS prevalence was attenuated, but remained significant, after adjusting for HOMA-IR. Moreover, a prospective study by Laaksonen et al. [7] indicated that low TT independently pre- dicted MetS development in middle-aged men after adjusting for BMI and insulin concentration.
Testosterone is secreted by Leydig cells via the hypothalamic- pituitary-testicular axis. High aromatase activity in adipocytes increases the conversion of testosterone to estradiol and facili- tates TG storage in adipocytes, increasing lipoprotein lipase ac- tivity [19]. The resulting increase in the size and number of adi- pocytes leads to insulin resistance. Increased levels of free fatty acids and insulin resistance lead to hypertriglyceridemia and an increased hepatic lipase level [19,20]. The level of hepatic li- Table 5. Age-Adjusted Odds Ratios of Metabolic Syndrome Components Depending on Total Testosterone and Serum Homocysteine Quartiles
Total testosterone Serum homocysteine
Q4 Q3 Q2 Q1 Q4 Q3 Q2 Q1
High BP 1.000 1.000
Exp(B) 1.015 0.976 1.016 0.977 1.025 1.122
Lower 0.866 0.833 0.868 0.838 0.880 0.964
Upper 1.189 1.143 1.190 1.140 1.195 1.305
P value 0.854 0.762 0.845 0.771 0.751 0.138
High glucose 1.000 1.000
Exp(B) 0.938 0.857 0.792 0.925 0.890 0.691
Lower 0.806 0.736 0.680 0.801 0.770 0.594
Upper 1.092 0.997 0.923 1.069 1.030 0.802
P value 0.408 0.046 0.003 0.291 0.117 <0.001
Waist circumference 1.000 1.000
Exp(B) 1.725 2.139 3.043 1.139 1.211 1.203
Lower 1.438 1.789 2.554 0.972 1.035 1.028
Upper 2.070 2.557 3.627 1.333 1.418 1.407
P value <0.001 <0.001 <0.001 0.107 0.017 0.021
High TG 1.000 1.000
Exp(B) 1.294 1.675 2.067 0.922 0.829 0.782
Lower 1.117 1.449 1.789 0.807 0.724 0.682
Upper 1.500 1.935 2.389 1.054 0.950 0.897
P value 0.001 <0.001 <0.001 0.233 0.007 <0.001
Low HDL-C 1.000 1.000
Exp(B) 1.363 1.997 2.729 1.007 0.922 0.949
Lower 1.135 1.678 2.301 0.864 0.789 0.813
Upper 1.636 2.376 3.236 1.173 1.078 1.108
P value 0.001 <0.001 <0.001 0.932 0.309 0.507
High BP, ≥130/85 mm Hg or medication; high glucose, fasting plasma glucose ≥100 mg/dL or type 2 diabetes mellitus; high TG, ≥150 mg/dL; low HDL-C, <40 mg/dL.
BP, blood pressure; TG, triglyceride; HDL-C, high density lipoprotein cholesterol.
pase determines both the level of HDL-C and its function in re- verse cholesterol transport [21]. Additionally, in men with type 2 DM, low HDL-C is associated with TT and the androgen re- ceptor CAG repeat polymorphism [22,23]. These findings may provide an explanation for the higher CVD risk in men with lower TT levels. However, the exact mechanism by which tes- tosterone levels affect lipid profiles is still not known.
Considering the individual components of MetS, we observed an inverse relationship between TT and the number of MetS components present. Additionally, MetS components were as- sociated with unfavorable profiles, including increased TG and decreased HDL-C, after fully adjusting for confounding factors.
However, the relationship between TT and MetS components, such as hypertension and high glucose, was not significant after adjusting for HOMA-IR. According to previous cross-sectional studies, the associations with TT are strongest for prevalent ab- dominal obesity and dyslipidemia and weakest for prevalent hy- pertension [3,24]. In the present study, we found that insulin re- sistance mediated hypertension and high glucose levels.
The inverse relationship between TT levels and MetS is con- sistent across races and ethnicities [24]. In a previous study, Whites were found to have higher correlation than Blacks or Hispanics, but the differences were not significant. As men- tioned above, of the MetS components, WC and dyslipidemia showed stronger association with TT levels than other factors.
These results have generally been largely consistent across races and ethnicities. Similar patterns have been observed in our study and in other studies in Korea and Japan [18,25]. However, the TT levels reported in the other two studies were lower than those found in the present study. This discrepancy is most likely due to differences in the age range of participants. No signifi- cant differences in TT levels have been found across racial or ethnic groups, with the exception of a study that found that TT levels in Asians were significantly lower than those of other races in people older than 65 years [26,27].
We found that serum Hcy levels were not associated with MetS. However, many studies have reported conflicting results regarding this association. In a longitudinal study of Chinese indi- viduals who underwent a routine health check-up, plasma total Hcy levels were higher in individuals with MetS than in those without MetS, but were not associated with the incidence of MetS [14]. The mean age and Hcy levels were higher in this previous study than in the present study (61.40±11.40 years vs. 40.86±
9.41 years and 18.41±8.23 µmol/L vs. 11.26±4.40 µmol/L, re- spectively). In other studies, serum Hcy has been found to be associated with MetS in individuals with hypertension, obesity,
and DM with complications [28-30]. However, the participants in our study were generally healthy and received regular health check-ups. In the Iranian general population, there was no sig- nificant difference in serum Hcy levels between individuals with or without MetS and no association between serum Hcy levels and MetS [31]. In healthy premenopausal women, plasma Hcy was not associated with insulin resistance or MetS [32]. In terms of racial and ethnic differences, Whites had higher Hcy levels than Blacks and Mexican Americans [33]. This can be at- tributed to a point mutation in the gene that encodes N5, N10- methylenetetrahydrofolate reductase (MTHFR), because the point mutation in the MTHFR gene is more common in Whites than in Blacks [34]. The C→T substitution at nucleotide 677 re- sults in a thermolabile form with reduced activity that leads to increased Hcy levels. In studies conducted in Canada and Eng- land, Hcy levels were significantly higher in South Asians than in Caucasians and East Asians [35-37]. Additionally, LDL-C, HDL-C, TG, BMI, diastolic BP, and glucose levels were signifi- cantly higher than in other races [36]. This phenomenon is thought to be caused by the vegetarian diet characteristic of reli- gious Hindus or by genetic mutations including MTHFR [35,37]. In contrast, East Asians have somewhat lower Hcy lev- els. Nevertheless, studies in China or Iran have shown no asso- ciation with MetS [14,31,38]. This discrepancy is presumed to be caused by differences in study design, diet, and genetic mu- tations. In a cross-sectional study conducted in Korea, there was no association between Hcy levels and MetS, consistent with our results [39]. Therefore, the existence of conflicting reports may have been due to differences among study populations in age, ethnicity, PA, dietary factors, sex, and study design.
In the present study, WC was the only MetS component that was associated with serum Hcy. In a study of a Korean popula- tion, the waist-hip ratio was associated with hyperhomocystein- emia [40]. Vaya et al. [41] reported that only the metabolic com- ponent of abdominal obesity was associated with Hcy in obese patients, and that abdominal obesity was an independent predic- tor of hyperhomocysteinemia. However, some studies reported no significant correlation, or an inverse relationship, between abdominal obesity and Hcy [28,29,42]. These discrepancies may have been due to differences in study populations. In the present study, although HOMA-IR and insulin were significant- ly higher in participants with MetS than in those without MetS, serum Hcy did not differ significantly depending on the pres- ence of MetS and was associated with WC independently of in- sulin resistance. Several studies show that Hcy levels in healthy individuals are not associated with insulin resistance [32,43,44].
Therefore, serum Hcy levels could serve as a marker of abdomi- nal obesity in generally healthy individuals.
The mechanism underlying the relationship between hyper- homocysteinemia and abdominal obesity is not yet clear. There is an inverse relationship between folate and BMI [45,46], lead- ing us to speculate that Hcy levels are increased by reductions in folate and have a proportional relationship with abdominal obesity. In addition, in a study of mice with nonalcoholic fatty liver disease induced by high-calorie food intake, Hcy levels were increased by downregulation of hepatic cystathionine β-synthase and β-lyase, which are involved in the transsulfura- tion pathway in the liver [47].
We found that FPG was inversely related to serum Hcy levels.
Despite the positive association between insulin resistance and Hcy, some research has shown Hcy levels to be lower in healthy individuals with insulin resistance than in the general population and that Hcy levels decreased in response to hyperfiltration of the kidney in the early stage of diabetic nephropathy without se- vere complications [48,49]. Our finding is presumably due to the exclusion of individuals with renal impairment from our study.
Exercise is generally accepted to be a key component of the treatment and prevention of MetS. PA has beneficial effects on BP, WC, and lipid profiles [50]. However, in our study, there was no significant difference in the amount of exercise per- formed by participants with or without MetS. This finding may be because participants with MetS exercised vigorously or mod- erately as a means of improving their health through lifestyle modifications.
In this large population-based study, we evaluated the rela- tionships of TT and serum Hcy levels with MetS, including its individual components, after adjusting for multiple potential confounding factors. However, our study has some limitations.
First, we could not establish causal relationships because of the cross-sectional study design. Second, our sample cannot be con- sidered representative of the general population, as it included only healthy male workers. Third, the single determination of TT and serum Hcy levels may have resulted in the misclassifi- cation of participants. Fourth, the criteria used to define MetS may be different for different ethnic groups. Fifth, dietary fac- tors such as vitamin B12, vitamin B6, and folate, which affect fasting Hcy levels, were not measured or reported.
In conclusion, we suggest that TT is a strong predictor of MetS and that serum Hcy levels could serve as a marker of ab- dominal obesity. However, further research on the pathogenesis of MetS, including prospective studies, is required.
CONFLICTS OF INTEREST
No potential conflict of interest relevant to this article was re- ported.
ACKNOWLEDGMENTS
This study was funded by a grant from the Korea Hydro & Nu- clear Power Project (A17LF02).
AUTHOR CONTRIBUTIONS
Conception or design: S.J.C. Acquisition, analysis, or interpreta- tion of data: S.H.S., N.H.K., J.K.L. Drafting the work or revis- ing: S.H.S., S.P.H., S.J.C. Final approval of the manuscript:
S.J.C.
ORCID
Sook Hee Sung https://orcid.org/0000-0001-8308-2301 Nam Hee Kim https://orcid.org/0000-0001-5378-6260 Sun Pyo Hong https://orcid.org/0000-0001-8882-5901 Jong-Keun Lee https://orcid.org/0000-0003-1376-3202 Seung Jin Choi https://orcid.org/0000-0002-4488-187X
REFERENCES
1. Lim S, Shin H, Song JH, Kwak SH, Kang SM, Won Yoon J, et al. Increasing prevalence of metabolic syndrome in Ko- rea: the Korean National Health and Nutrition Examination Survey for 1998-2007. Diabetes Care 2011;34:1323-8.
2. Andreadis EA, Tsourous GI, Tzavara CK, Georgiopoulos DX, Katsanou PM, Marakomichelakis GE, et al. Metabolic syndrome and incident cardiovascular morbidity and mor- tality in a Mediterranean hypertensive population. Am J Hy- pertens 2007;20:558-64.
3. Brand JS, Rovers MM, Yeap BB, Schneider HJ, Tuomainen TP, Haring R, et al. Testosterone, sex hormone-binding globulin and the metabolic syndrome in men: an individual participant data meta-analysis of observational studies.
PLoS One 2014;9:e100409.
4. Haring R, Volzke H, Felix SB, Schipf S, Dorr M, Rosskopf D, et al. Prediction of metabolic syndrome by low serum testosterone levels in men: results from the study of health in Pomerania. Diabetes 2009;58:2027-31.
5. Li C, Ford ES, Li B, Giles WH, Liu S. Association of testos-
terone and sex hormone-binding globulin with metabolic syndrome and insulin resistance in men. Diabetes Care 2010;33:1618-24.
6. Kupelian V, Page ST, Araujo AB, Travison TG, Bremner WJ, McKinlay JB. Low sex hormone-binding globulin, total testosterone, and symptomatic androgen deficiency are as- sociated with development of the metabolic syndrome in nonobese men. J Clin Endocrinol Metab 2006;91:843-50.
7. Laaksonen DE, Niskanen L, Punnonen K, Nyyssonen K, Tuomainen TP, Valkonen VP, et al. Testosterone and sex hormone-binding globulin predict the metabolic syndrome and diabetes in middle-aged men. Diabetes Care 2004;27:
1036-41.
8. Yeap BB, Chubb SA, Hyde Z, Jamrozik K, Hankey GJ, Flicker L, et al. Lower serum testosterone is independently associated with insulin resistance in non-diabetic older men:
the Health In Men Study. Eur J Endocrinol 2009;161:591-8.
9. Tsai EC, Boyko EJ, Leonetti DL, Fujimoto WY. Low serum testosterone level as a predictor of increased visceral fat in Japanese-American men. Int J Obes Relat Metab Disord 2000;24:485-91.
10. Rao PM, Kelly DM, Jones TH. Testosterone and insulin re- sistance in the metabolic syndrome and T2DM in men. Nat Rev Endocrinol 2013;9:479-93.
11. Fonseca V, Guba SC, Fink LM. Hyperhomocysteinemia and the endocrine system: implications for atherosclerosis and thrombosis. Endocr Rev 1999;20:738-59.
12. Wald DS, Law M, Morris JK. Homocysteine and cardiovas- cular disease: evidence on causality from a meta-analysis.
BMJ 2002;325:1202.
13. Meigs JB, Jacques PF, Selhub J, Singer DE, Nathan DM, Rifai N, et al. Fasting plasma homocysteine levels in the in- sulin resistance syndrome: the Framingham offspring study.
Diabetes Care 2001;24:1403-10.
14. Wang X, Ye P, Cao R, Yang X, Xiao W, Zhang Y, et al. The association of homocysteine with metabolic syndrome in a community-dwelling population: homocysteine might be concomitant with metabolic syndrome. PLoS One 2014;9:
e113148.
15. Alberti KG, Eckel RH, Grundy SM, Zimmet PZ, Cleeman JI, Donato KA, et al. Harmonizing the metabolic syndrome:
a joint interim statement of the International Diabetes Fed- eration Task Force on Epidemiology and Prevention; Na- tional Heart, Lung, and Blood Institute; American Heart As- sociation; World Heart Federation; International Atheroscle- rosis Society; and International Association for the Study of
Obesity. Circulation 2009;120:1640-5.
16. Lee SY, Park HS, Kim DJ, Han JH, Kim SM, Cho GJ, et al.
Appropriate waist circumference cutoff points for central obesity in Korean adults. Diabetes Res Clin Pract 2007;75:
72-80.
17. Muller M, Grobbee DE, den Tonkelaar I, Lamberts SW, van der Schouw YT. Endogenous sex hormones and metabolic syndrome in aging men. J Clin Endocrinol Metab 2005;90:
2618-23.
18. Hong D, Kim YS, Son ES, Kim KN, Kim BT, Lee DJ, et al.
Total testosterone and sex hormone-binding globulin are as- sociated with metabolic syndrome independent of age and body mass index in Korean men. Maturitas 2013;74:148-53.
19. Cohen PG. The hypogonadal-obesity cycle: role of aroma- tase in modulating the testosterone-estradiol shunt: a major factor in the genesis of morbid obesity. Med Hypotheses 1999;52:49-51.
20. Chatterjee C, Sparks DL. Hepatic lipase, high density lipo- proteins, and hypertriglyceridemia. Am J Pathol 2011;178:
1429-33.
21. Thuren T. Hepatic lipase and HDL metabolism. Curr Opin Lipidol 2000;11:277-83.
22. Van Pottelbergh I, Braeckman L, De Bacquer D, De Backer G, Kaufman JM. Differential contribution of testosterone and estradiol in the determination of cholesterol and lipo- protein profile in healthy middle-aged men. Atherosclerosis 2003;166:95-102.
23. Stanworth RD, Kapoor D, Channer KS, Jones TH. Dyslipi- daemia is associated with testosterone, oestradiol and andro- gen receptor CAG repeat polymorphism in men with type 2 diabetes. Clin Endocrinol (Oxf) 2011;74:624-30.
24. Kupelian V, Hayes FJ, Link CL, Rosen R, McKinlay JB. In- verse association of testosterone and the metabolic syn- drome in men is consistent across race and ethnic groups. J Clin Endocrinol Metab 2008;93:3403-10.
25. Akishita M, Fukai S, Hashimoto M, Kameyama Y, Nomura K, Nakamura T, et al. Association of low testosterone with metabolic syndrome and its components in middle-aged Japanese men. Hypertens Res 2010;33:587-91.
26. Litman HJ, Bhasin S, Link CL, Araujo AB, McKinlay JB.
Serum androgen levels in black, Hispanic, and white men. J Clin Endocrinol Metab 2006;91:4326-34.
27. Orwoll E, Lambert LC, Marshall LM, Phipps K, Blank J, Barrett-Connor E, et al. Testosterone and estradiol among older men. J Clin Endocrinol Metab 2006;91:1336-44.
28. Catena C, Colussi G, Nait F, Capobianco F, Sechi LA. Ele-
vated homocysteine levels are associated with the metabolic syndrome and cardiovascular events in hypertensive pa- tients. Am J Hypertens 2015;28:943-50.
29. Sreckovic B, Sreckovic VD, Soldatovic I, Colak E, Suma- rac-Dumanovic M, Janeski H, et al. Homocysteine is a marker for metabolic syndrome and atherosclerosis. Diabe- tes Metab Syndr 2017;11:179-82.
30. Buysschaert M, Dramais AS, Wallemacq PE, Hermans MP.
Hyperhomocysteinemia in type 2 diabetes: relationship to macroangiopathy, nephropathy, and insulin resistance. Dia- betes Care 2000;23:1816-22.
31. Nabipour I, Ebrahimi A, Jafari SM, Vahdat K, Assadi M, Movahed A, et al. The metabolic syndrome is not associated with homocysteinemia: the Persian Gulf Healthy Heart Study. J Endocrinol Invest 2009;32:406-10.
32. Tanrikulu-Kilic F, Bekpinar S, Unlucerci Y, Orhan Y. Insulin resistance is not related to plasma homocysteine concentra- tion in healthy premenapausal women. Physiol Res 2006;55:
285-90.
33. Ganji V, Kafai MR; Third National Health and Nutrition Ex- amination Survey. Demographic, health, lifestyle, and blood vitamin determinants of serum total homocysteine concen- trations in the third National Health and Nutrition Examina- tion Survey, 1988-1994. Am J Clin Nutr 2003;77:826-33.
34. McAndrew PE, Brandt JT, Pearl DK, Prior TW. The inci- dence of the gene for thermolabile methylene tetrahydrofo- late reductase in African Americans. Thromb Res 1996;83:
195-8.
35. Senaratne MP, MacDonald K, De Silva D. Possible ethnic differences in plasma homocysteine levels associated with coronary artery disease between south Asian and east Asian immigrants. Clin Cardiol 2001;24:730-4.
36. Anand SS, Yusuf S, Vuksan V, Devanesen S, Teo KK, Mon- tague PA, et al. Differences in risk factors, atherosclerosis and cardiovascular disease between ethnic groups in Cana- da: the study of health assessment and risk in ethnic groups (SHARE). Indian Heart J 2000;52:S35-43.
37. Cappuccio FP, Bell R, Perry IJ, Gilg J, Ueland PM, Refsum H, et al. Homocysteine levels in men and women of differ- ent ethnic and cultural background living in England. Ath- erosclerosis 2002;164:95-102.
38. Esteghamati A, Hafezi-Nejad N, Zandieh A, Sheikhbahaei S, Ebadi M, Nakhjavani M. Homocysteine and metabolic syn- drome: from clustering to additional utility in prediction of coronary heart disease. J Cardiol 2014;64:290-6.
39. Rhee EJ, Hwang ST, Lee WY, Yoon JH, Kim BJ, Kim BS,
et al. Relationship between metabolic syndrome categorized by newly recommended by International Diabetes Federa- tion criteria with plasma homocysteine concentration. En- docr J 2007;54:995-1002.
40. Shin KA. Association between obesity factors and homo- cysteine levels with the metabolic syndrome. Korean J Clin Lab Sci 2012;44:147-54.
41. Vaya A, Rivera L, Hernandez-Mijares A, de la Fuente M, Sola E, Romagnoli M, et al. Homocysteine levels in mor- bidly obese patients: its association with waist circumfer- ence and insulin resistance. Clin Hemorheol Microcirc 2012;52:49-56.
42. Park SB, Georgiades A. Changes in body composition pre- dict homocysteine changes and hyperhomocysteinemia in Korea. J Korean Med Sci 2013;28:1015-20.
43. Abbasi F, Facchini F, Humphreys MH, Reaven GM. Plasma homocysteine concentrations in healthy volunteers are not related to differences in insulin-mediated glucose disposal.
Atherosclerosis 1999;146:175-8.
44. Godsland IF, Rosankiewicz JR, Proudler AJ, Johnston DG.
Plasma total homocysteine concentrations are unrelated to insulin sensitivity and components of the metabolic syn- drome in healthy men. J Clin Endocrinol Metab 2001;86:
719-23.
45. Nakazato M, Maeda T, Takamura N, Wada M, Yamasaki H, Johnston KE, et al. Relation of body mass index to blood fo- late and total homocysteine concentrations in Japanese adults. Eur J Nutr 2011;50:581-5.
46. Mojtabai R. Body mass index and serum folate in childbear- ing age women. Eur J Epidemiol 2004;19:1029-36.
47. Bravo E, Palleschi S, Aspichueta P, Buque X, Rossi B, Cano A, et al. High fat diet-induced non alcoholic fatty liver dis- ease in rats is associated with hyperhomocysteinemia caused by down regulation of the transsulphuration pathway. Lipids Health Dis 2011;10:60.
48. Fonseca VA, Mudaliar S, Schmidt B, Fink LM, Kern PA, Henry RR. Plasma homocysteine concentrations are regu- lated by acute hyperinsulinemia in nondiabetic but not type 2 diabetic subjects. Metabolism 1998;47:686-9.
49. Rosolova H, Simon J, Mayer O Jr, Racek J, Dierze T, Jacob- sen DW. Unexpected inverse relationship between insulin resistance and serum homocysteine in healthy subjects.
Physiol Res 2002;51:93-8.
50. Pitsavos C, Panagiotakos D, Weinem M, Stefanadis C. Diet, exercise and the metabolic syndrome. Rev Diabet Stud 2006;3:118-26.