Prognostic Significance
of the Imaging Parameters of Adipose Tissue and
Bone Marrow on F-18
Fluorodeoxyglucose PET/CT in Patients with Malignant Melanoma
악성 흑색종 환자에서 시행한 F-18 Fluorodeoxyglucose PET/CT의 지방 조직 및 골수의 영상 파라메터들이
예후에 미치는 영향 평가
Ju Ha Lee, MD1 , Sang Mi Lee, MD2* , Jung Eun Kim, MD3
Departments of 1Radiology, 2Nuclear Medicine, 3Dermatology, Soonchunhyang University Cheonan Hospital, Cheonan, Korea
Purpose Fluorodeoxyglucose (FDG) uptake of bone marrow (BM) and adipose tissue is known to reflect systemic inflammatory response to cancer cell. The objective of this study was to evaluate the prognostic value of F-18 FDG uptake of BM and determine characteristics of viscer- al adipose tissue (VAT) and subcutaneous adipose tissue (SAT) on PET/CT images in malignant melanoma.
Materials and Methods We retrospectively reviewed 33 patients histopathologically diag- nosed with malignant melanoma via FDG PET/CT staging. BM-to-liver uptake ratio (BLR), vol- ume of VAT and SAT, CT Hounsfield unit (HU), and mean of standardized uptake value (SU- Vmean) of VAT and SAT on PET/CT were measured and prognostic values of these parameters for prediction of disease progression-free survival (DPFS) were evaluated.
Results Patients with stage III–IV melanoma had higher CT HU and SUVmean for SAT and VAT but lower volume of VAT compared with patients at stage I–II (p < 0.05). Survival analysis, pa- tients with high CT HU of VAT and SAT, high SUVmean of VAT and SAT, and high BLR showed worse DPFS (all p < 0.05), indicating significant association. However, volume of SAT or VAT failed to show significant association with DPFS (p > 0.05).
Conclusion CT HU, SUVmean of SAT and VAT, and BLR provide prognostic information for DPFS in malignant melanoma.
Received December 18, 2018 Revised March 25, 2019 Accepted June 6, 2019
*Corresponding author Sang Mi Lee, MD
Department of Nuclear Medicine, Soonchunhyang Univeristy Cheonan Hospital, 44 Suncheonhyang 4-gil, Dongnam-gu, Cheonan 31151, Korea.
Tel 82-41-570-3540 Fax 82-41-572-4655 E-mail gareen@naver.com This is an Open Access article distributed under the terms of the Creative Commons Attribu- tion Non-Commercial License (https://creativecommons.org/
licenses/by-nc/4.0) which permits unrestricted non-commercial use, distribution, and reproduc- tion in any medium, provided the original work is properly cited.
ORCID iDs Ju Ha Lee https://
orcid.org/0000-0002-8727-9053 Sang Mi Lee
https://
orcid.org/0000-0002-7943-3807 Jung Eun Kim
https://
orcid.org/0000-0002-8399-8456
Index terms Malignant Melanoma; Prognosis; Intra-Abdominal Fat; Positron-Emission Tomography;
Inflammation
INTRODUCTION
Malignant melanoma, one of the most lethal malignancies in humans, is responsible for 60–80% of deaths caused by skin cancers (1). It originate from pigment producing cells known as melanocytes that are mainly found in the skin, although they are also found in the ear, gastrointestinal tract, eye, oral and genital mucosa, and leptomeninges (2). Because the prognosis of melanoma depends on the the presence and extent of metastatic lesions as well as histology of the primary tumor, imaging studies using radiographic and nuclear medicine techniques are important in evaluating malignant melanoma (3).
Recently, a number of studies have reported that inflammation is associated with the initi- ation and progression of cancer (4-6). Several studies have shown that serum markers of sys- temic inflammatory response such as C-reactive protein (CRP) and neutrophil-to-lymphocyte ratio (NLR) are correlated with the prognosis of patients with various carcinomas (4-6). Fur- thermore, in obese subjects, adipocytes secrete adipokines and proinflammatory cytokines that induce tumor formation in the tumor microenvironment (7). Therefore, obesity can cause low-grade chronic systemic inflammation known to be associated with carcinogenesis and clinical outcomes of various carcinomas (8-10). Although the degree of standardized up- take value (SUV) of bone marrow (BM) might be affected by the presence of micrometastasis of cancer cells and red BM hyperplasia, SUV of BM mainly reflects glucose metabolism in im- mune cells, and increased SUV of BM in patients with malignancy is attributed to systemic in- flammatory response to cancer (11-13). Furthermore, CT Hounsfield unit (HU) and SUV of ad- ipose tissue are correlated with immune reaction in adipose tissue and clinical outcomes (14).
Considering that the prognosis of malignant melanoma has significant associations with systemic inflammatory response (15, 16) and obesity (17-19), imaging parameters of BM and adipose tissue on PET/CT might have prognostic significance in patients with malignant mel- anoma. Although fluorodeoxyglucose (FDG) PET/CT has long been used for staging, assess- ment of treatment response, and prognosis of malignant melanoma (20-22), no studies have evaluated the association of clinical prognostic outcomes with PET/CT parameters of BM and adipose tissue using FDG PET/CT. Therefore, the objective of this study was to determine the association of SUV of BM and PET/CT parameters of subcutaneous adipose tissue (SAT) and visceral adipose tissue (VAT) (including volume of SAT and VAT, CT HU and SUV of SAT and VAT) with disease progression-free survival (DPFS) in patients with malignant melanoma.
MATERIALS AND METHODS SUBJECTS
This study was approved by the Institutional Review Board of our medical center, and the requirement to obtain informed consent was waived by the board due to its retrospective na-
ture (IRB No. 2019-02-012). We retrospectively reviewed medical records of all patients diag- nosed with malignant melanoma in our institution. A total of 33 patients who were histopath- ologically diagnosed with malignant melanoma and staged with FDG PET/CT were enrolled in the present study. Exclusion criteria were: 1) patients who had received only supportive care without any curative or palliative treatment after staging, 2) those who had a history of other malignancies or BM disease, 3) those who had a history of major abdominal surgery which affected abdominal fat distribution, and 4) those who had active systemic inflammato- ry or infectious disease at the time of PET/CT scanning. All patients included in this study underwent blood tests, chest CT, bone scintigraphy, FDG PET/CT, and MRI before the start of treatment. Staging for malignant melanoma was based on the 7th edition of the American Joint Committee on Cancer TNM Staging System Guideline. Clinico-demographic data and clinical outcome results were retrospectively reviewed from medical records of enrolled patients.
Body mass index (BMI) was calculated for each patient based on the height and body weight of the patient at the time of diagnosis.
FDG PET/CT
All subjects were fasted for at least 8 hours prior to intravenous injection of FDG. Prior to FDG injection, blood glucose levels were evaluated to determine if blood glucose level was <
200 mg/dL. PET/CT images were obtained from the skull to the proximal thigh using a dedi- cated scanner (Biograph mCT 128; Siemens Healthcare, Knoxville, TN, USA) within 1 hour af- ter FDG injection (4.07 MBq/kg). Initially, CT scan for HU correction was performed without contrast enhancement using a standard protocol: 65 mAs, 120 kVp, automatic dose modula- tion, 1.0 mm pitch, 5 mm slice thickness. Afterwards, PET scanning was performed for 1.5 minutes per bed position in three-dimensional acquisition mode. PET images were recon- structed using maximization of ordered-subset expectations algorithm aligned with time-of- flight mode and HU correction.
PET/CT IMAGE ANALYSIS
All PET/CT images were retrospectively evaluated using the US Food and Drug Administra- tion approved DICOM viewer of Osirix MD software (Pixmeo, Bernex, Switzerland) according to the method described in previous studies (23). SUV was calculated based on the patient’s body weight. Volume of interest (VOI) was drawn for the primary tumor and the highest SUV of the primary tumor (SUVtumor) was measured. Afterwards, adipose tissue parameters (vol- ume, CT HU, and mean SUV of SAT and VAT) and SUV of BM were measured. VAT and SAT volumes in CT images were measured with three consecutive slices at the level of L4/L5 in- tervertebral space. Adipose tissue was defined as areas with CT HU ranging from -200 to -50 in CT images. The volume and CT HU were automatically calculated in units of cm3 and HU, respectively. SAT was defined as extraperitoneal fat tissue between skin and muscle while VAT was defined as intraabdominal fat tissue. SUVmean of both SAT and VAT were calculated from PET images using the same areas of the adipose tissue on CT images. For measuring the SUV of adipose tissue, SUVmean was calculated after removing physiologic uptake in bowel, urine. An example of the measurement is shown in Fig. 1.
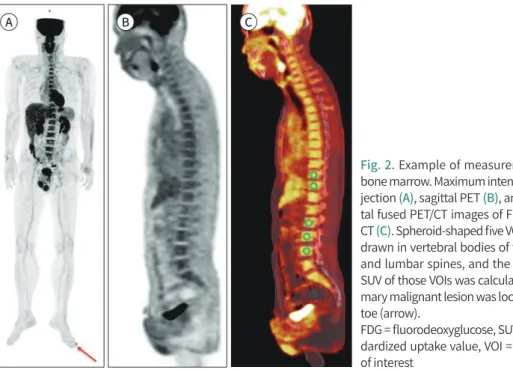
SUV of BM was measured by plotting VOI on vertebral bodies of at least five vertebrae from
thoracic and lumbar spines (Fig. 2). For measuring an average SUV of each drawn VOI, an automatic isocontour set at 75% of the maximum SUV was used. This 75% cut-off value has shown good reproducibility between subjects for measuring SUV of BM (11). The average of each SUV obtained from five vertebrae was calculated and defined as SUVmean of BM (BM SUVmean). We then calculated the SUV of normal liver tissue to measure BM-to-liver uptake ratio (BLR) of SUV. The SUVmean in the normal liver was measured by drawing three 1 cm- sized VOIs in the liver, two from the right lobe and one from the two left lobes. BLR was then calculated using the BM SUVmean and SUVmean of the liver SUV.
STATISTICAL ANALYSIS
The Mann-Whitney U test was performed to compare variables between groups. The Spearman’s rank correlation was performed to evaluate correlations of BM SUVmean, BLR, and adipose tissue parameters with serum inflammatory markers, including serum CRP lev- Fig. 1. Example of measurement of adipose tissue.
A, B. On consecutive transaxial CT images at L3/L4 level. The area of adipose tissue was automatically com- puted using a CT attenuation range from -50 to -200 HU.
C, D. Within the areas of adipose tissue on the 3 images, the volume and mean HU were automatically cal- culated.
E, F. The areas of adipose tissue on the 3 CT images were then exported to the corresponding fluorodeoxy- glucose PET/CT images.
HU = Hounsfield unit A
C
E
B
D
F
el and NLR, SUVtumor. For survival analysis, continuous variables were classified into two groups with specific cut-off values determined by receiver operating characteristic (ROC) curve analysis. The Kaplan-Meier analysis with log-rank test was used to compare DPFS of variables. Fisher’s exact test was performed to evaluate the differences in recurrence rate ac- cording to stage and SUVmean of adipose tissue. All statistical analyses were performed us- ing MedCalc version 17.5.3 (MedCalc Software bvba, Ostend, Belgium). A p-value < 0.05 was considered statistically significant.
RESULTS
PATIENT CHARACTERISTICS
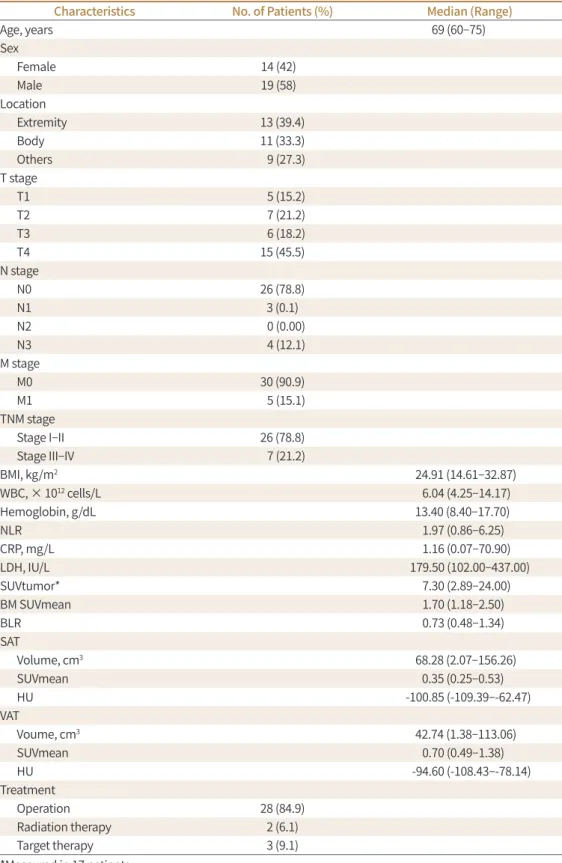
A total of 33 patients with malignant melanoma were enrolled in this study. Characteristics of enrolled patients are summarized in Table 1. The most common site of primary tumor lo- cation was the extremity (13/33, 39.4%). The majority of T, N, and M stages were T4 (15 pa- tients), N0 (26 patients), and M0 (30 patients). Sixteen (48.5%) enrolled patients underwent excisional biopsy before FDG PET/CT scan. SUVtumor was measured for the remaining 17 (51.5%) patients. Its median value was 7.30 (range 0.91–13.69). The median follow-up period of these enrolled patients was 14.7 months (range, 3.9–67.7 months). During the follow-up period, 8 (24.24%) patients experienced disease progression.
CORRELATION OF PET/CT PARAMETERS WITH STAGE AND SERUM INFLAMMATORY MARKERS
SUVmean of BM and adipose tissue parameters were compared between patients with stages I–II and stages III–IV to evaluate the relationship between BM and adipose tissue pa- rameters and stage. For adipose tissue parameters of PET/CT, patients with stages III–IV
Fig. 2. Example of measurement of bone marrow. Maximum intensity pro- jection (A), sagittal PET (B), and sagit- tal fused PET/CT images of FDG PET/
CT (C). Spheroid-shaped five VOIs were drawn in vertebral bodies of thoracic and lumbar spines, and the average SUV of those VOIs was calculated. Pri- mary malignant lesion was located left toe (arrow).
FDG = fluorodeoxyglucose, SUV = stan- dardized uptake value, VOI = volume of interest
A B C
Table 1. Clinical Characteristics of Enrolled Patients (n = 33)
Characteristics No. of Patients (%) Median (Range)
Age, years 69 (60–75)
Sex
Female 14 (42)� �
Male 19 (58)� �
Location
Extremity 13 (39.4)
Body 11 (33.3)
Others 9 (27.3)
T stage
T1 5 (15.2)
T2 7 (21.2)
T3 6 (18.2)
T4 15 (45.5)
N stage
N0 26 (78.8)
N1 3 (0.1)
N2 0 (0.00)
N3 4 (12.1)
M stage
M0 30 (90.9)
M1 5 (15.1)
TNM stage
Stage I–II 26 (78.8)
Stage III–IV 7 (21.2)
BMI, kg/m2 24.91 (14.61–32.87)
WBC, × 1012 cells/L 6.04 (4.25–14.17)
Hemoglobin, g/dL 13.40 (8.40–17.70)
NLR 1.97 (0.86–6.25)
CRP, mg/L 1.16 (0.07–70.90)
LDH, IU/L 179.50 (102.00–437.00)
SUVtumor* 7.30 (2.89–24.00)
BM SUVmean 1.70 (1.18–2.50)
BLR 0.73 (0.48–1.34)
SAT
Volume, cm3 68.28 (2.07–156.26)
SUVmean 0.35 (0.25–0.53)
HU -100.85 (-109.39–-62.47)
VAT
Voume, cm3 42.74 (1.38–113.06)
SUVmean 0.70 (0.49–1.38)
HU -94.60 (-108.43–-78.14)
Treatment
Operation 28 (84.9)
Radiation therapy 2 (6.1)
Target therapy 3 (9.1)
*Measured in 17 patients.
BLR = BM-to-liver uptake ratio, BM = bone marrow, BMI = body mass index, CRP = C-reactive protein, HU = Hounsfield unit, LDH = lactate dehydrogenase, NLR = neutrophil-to-lymphocyte ratio, SAT = subcutaneous adipose tissue, SUVmean = mean of standardized uptake value, SUVtumor = maximum fluorodeoxyglucose uptake of primary tumor, VAT = visceral adipose tissue, WBC = white blood cell
showed higher HU of SAT (-87.55 vs. -102.51, p = 0.002) and VAT (-89.58 vs. -98.99, p = 0.006), higher SUVmean of SAT (0.42 vs. 0.33, p = 0.021) and VAT (0.79 vs. 0.68, p = 0.012), but lower volume of VAT (20.39 vs. 48.10, p = 0.004) than those with stages I–II. For BM parameters, both BM SUVmean (1.72 vs. 1.60) and BLR (0.74 vs. 0.72) showed no significant differences be- tween the two groups (both p > 0.05).
Relationships of BM SUVmean, BLR, and adipose tissue parameters with serum inflamma- tory markers including CRP and NLR in enrolled patients were investigated. BLR had signifi- cant positive correlation with serum CRP level (p = 0.049; r = 0.368). However, it had no signif- icant correlation with NLR (p > 0.05). BM SUVmean or adipose tissue parameters showed no significant correlation with serum CRP level or NLR (p > 0.05).
In correlation analysis of parameters of adipose tissue and BM with SUVtumor, none of the CT HU and SUVmean of adipose tissue parameters, BM SUVmean, and BLR showed signifi- cant association with SUVtumor (p > 0.05).
SURVIVAL ANALYSIS FOR DPFS
Predictive values of clinical factors and FDG PET/CT parameters for DPFS were assessed.
Using ROC curve analysis, optimal cut-off values for NLR, CRP, BM SUVmean, BLR, SAT vol- ume, SAT SUVmean, VAT volume, VAT SUVmean, SAT HU, and VAT HU were determined to be 2.5, 5 mg/dL, 1.73, 0.63, 90.00 cm3, 0.30, 23.65 cm3, 0.75, -102.15, and -100.00, respectively.
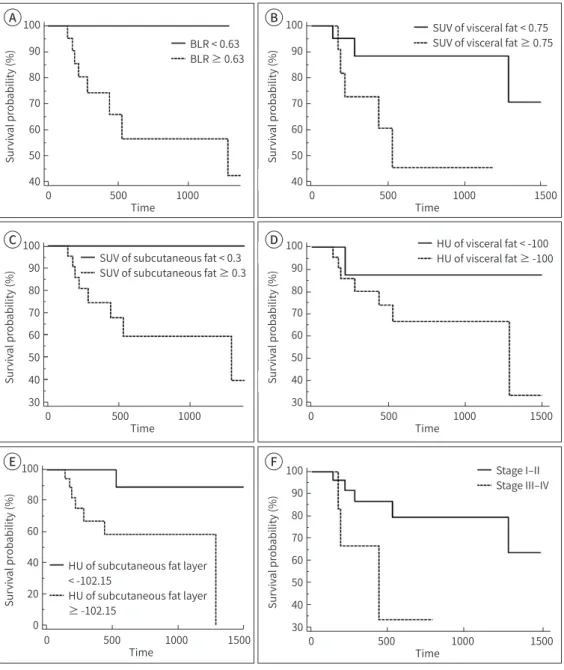
On survival analysis with log-rank test, SUVmean of SAT and VAT, CT HU of SAT and VAT, BLR, and TNM stage were significant predictors for DPFS (all p < 0.05, Table 2). Patients with low SUVmean and HU of adipose tissue and low BLR had significantly better DPFS that those with high SUVmean and HU of adipose tissue and high BLR (Fig. 3). On the other hand, BMI, location of lesion, BM SUVmean, NLR, SAT volume, and VAT volume had no significant associ- ations with DPFS (all p > 0.05) while serum CRP level showed marginal significance (p = 0.050).
Analysis based on BMI 25 in adipose tissue volume and DPFS, all groups with BMI greater than or less than 25 had no significant associations with DPFS (p > 0.05).
We further evaluated the recurrence rates according to the combination of stage and SUVmean of adipose tissue (Table 3). The recurrence rates of patients with stage III-IV and high SUV mean of adipose tissue were up to 50–60%. In contrast, recurrence rates of those with low SUVmean were 0.0–15.79% irrespective of stage, although there were no statistical significant differences (p > 0.05).
DISCUSSION
In the present study, we evaluated the prognostic value of SUVmean of BM and HU and SUV mean of SAT and VAT in patients with malignant melanoma to evaluate whether the degree of inflammatory reaction in BM and adipose tissue had significant associations with clinical outcomes. Our study revealed significant correlation between DPFS and adipose tissue pa- rameters, tumor stage, and BLR. This finding suggests that inflammatory reaction in BM and adipose tissue has significant correlation with tumor characteristics and clinical prognosis in malignant melanoma patients.
SUVmean of BM reflecting the activation of BM has shown significant positive correlation
with serum inflammatory markers (24, 25). Similarly, patients with lung cancer without BM metastasis showed higher SUVmean of BM than those with benign lung nodules (26). Fur- thermore, previous studies reported that BM uptake of FDG in patients with various malig- nancies can be used to predict prognosis, suggesting worse clinical outcomes in patients with high BM uptake (11-13). The present study also indicated that among patients with ma- lignant melanoma, patients with high BLR on staging FDG PET/CT were at high risk of dis- ease progression, supporting the hypothesis that systemic inflammatory response might play an important role in cancer progression (12).
Dysfunction of adipose tissue can trigger inflammatory cytokine secretion that affects sys- temic inflammatory response in the host and carcinogenesis eventually (27). CT HU of adi- pose tissue measured by non-enhanced CT reflects the quality of adipose tissue such as in- flammatory and fibrotic changes. It is significantly associated with survival and prognosis of patients with malignant disease (28, 29). In a previous study on non-human species, in- creased CT HU of adipose tissue has been found to be low along with lipid content change and fibrotic change (30). These changes in adipocytes and adipose microenvironment might promote tumor growth (30). Previous studies have shown that CT HU of adipose tissue is as- sociated with the inflammatory status of adipose tissue. It can be used as an indicator of adi- pose tissue dysfunction (23, 30). Several studies have also reported positive association be- tween the HU of fat tissue and prognosis in variable diseases including pancreatic cancer and sarcoma (28, 31). Similarly, our study showed significant association between HU of fat tissue and prognosis.
Previous study demonstrated that SUV of the tumor and SUVmean of the adipose are in- Table 2. Univariate Analysis of Disease Progression-Free Survival
Variables p-Value
Location (extremity vs. body vs. others) 0.579
BMI (25 kg/m2) 0.311
NLR (< 2.50 vs. ≥ 2.50) 0.863
CRP (< 5.00 mg/dL vs. ≥ 5.00 mg/dL) 0.050
BM SUVmean (< 1.73 vs. ≥ 1.73) 0.223
BLR (< 0.63 vs. ≥ 0.63) 0.033
Volume of SAT (< 90.00 cm3 vs. ≥ 90.00 cm3) 0.151
SUVmean of SAT (< 0.30 vs. ≥ 0.30) 0.038
HU of SAT (< -102.15 vs. ≥ -102.15) 0.010
Volume of VAT (< 23.65 cm3 vs. ≥ 23.65 cm3) 0.214
SUVmean of VAT (< 0.75 vs. ≥ 0.75) 0.041
HU of VAT (< -100.00 vs. ≥ -100.00) 0.045
TNM stage (stage I–II vs. stage III–IV) 0.033
T stage (1–2 vs. 3–4) 0.911
N stage (0 vs. 1) 0.347
M stage (0 vs. 1) 0.297
BLR = BM-to-liver uptake ratio, BM = bone marrow, BMI = body mass index, CRP = C-reactive protein, HU = Hounsfield unit, NLR = neutrophil-to-lymphocyte ratio, SAT = subcutaneous adipose tissue, SUVmean = mean of standardized uptake value, VAT = visceral adipose tissue
Fig. 3. Kaplan-Meier curves for distant progression-free survival according to different parameters: BLR (A), SUV of VAT (B), SUV of SAT (C), HU of VAT (D), HU of SAT (E), and stage (F).
BLR = bone marrow-to-liver uptake ratio, SAT = subcutaneous adipose tissue, SUV = standardized uptake value, HU = Hounsfield unit, VAT = visceral adipose tissue
Table 3. Recurrence Rates According to Staging and Fluorodeoxyglucose Uptake of Adipose Tissue
Stage Stage I, II Stage III, IV
SUVmean of SAT < 0.30 1/7 (14.29) 0/1 (0)
SUVmean of SAT ≥ 0.30 4/19 (21.05) 3/6 (50)
p-Value > 0.99 > 0.99
SUVmean of VAT < 0.75 3/19 (15.79) 0/2 (0)
SUVmean of VAT ≥ 0.75 2/7 (28.57) 3/5 (60)
p-Value 0.588 0.429
SAT = subcutaneous adipose tissue, SUVmean = mean of standardized uptake value, VAT = visceral adipose tissue
100 90 80 70 60 50 40
100 90 80 70 60 50 40
Survival probability (%) Survival probability (%)
0 500 1000 0 500 1000 1500
BLR < 0.63 BLR ≥ 0.63
SUV of visceral fat < 0.75 SUV of visceral fat ≥ 0.75
Time Time
A B
100 90 80 70 60 50 40 30 100
90 80 70 60 50 40 30
Survival probability (%)
Survival probability (%)
0 500 1000 1500
0 500 1000
Time Time
SUV of subcutaneous fat < 0.3 SUV of subcutaneous fat ≥ 0.3
HU of visceral fat < -100 HU of visceral fat ≥ -100
C D
100 80 60 40 20 0
Survival probability (%)
0 500 1000 1500
HU of subcutaneous fat layer
< -102.15
HU of subcutaneous fat layer
≥ -102.15 Time
100 90 80 70 60 50 40 30
Survival probability (%)
0 500 1000 1500 Stage I–II Stage III–IV
Time
E F
versely proportional in patients with pancreatic cancer (14). The study speculated that this finding may be due to decreased fatty acid uptake and lipoprotein catabolism of adipose tis- sue caused by lipoprotein lipase inhibiting substances secreted by tumor cells (14). In con- trast, recent studies have reported contradictory results in colorectal cancer and pancreatic cancer (29, 32). Patients with higher CT HU and SUVmean in adipose tissue had significantly lower survival rate and prognosis than patients with lower values. In the present study, SU- Vmean of adipose tissue in malignant melanoma was also inversely proportional to DPFS.
This might be due to the association of SUV and inflammatory change in adipose tissue as described above (23, 30). Along with CRP and adipose tissue parameters, CRP, a serum in- flammatory marker, also showed marginal significance in predicting prognosis of patients with malignant melanoma in the present study.
Previous studies reported that obesity was a risk factor for melanoma (19). Inflammatory adipokines and leptin secreted by adipocytes can promote melanoma progression in mice (33). Elevated leptin levels can predict melanoma outside lymph node metastasis (34). Fang et al. (18) have shown that elevated BMI is associated with a risk of disease progression in mela- noma. However, BMI cannot represent total body adipose tissue amount because muscle mass also contributes to BMI (35). Therefore, in this study, we measured volumes of SAT and VAT separately and determined the prognostic value of them along with other adipose tissue parameters. However, different from SUVmean and HU of adipose tissue, volumes of VAT and SAT failed to showed significance for predicting DPFS. Qualitative characteristics of adi- pose tissue rather than the amount of adipose tissue might affect the prognosis of patients with malignant melanoma. Further study with more patients is needed to test this possibility.
NLR is also known to be related with systemic inflammatory response and survival in ma- lignant melanoma (36). Nevertheless, NLR failed to show statistical significance in the pres- ent study. Considering that serum CRP level had significant correlation with BLR and border- line significance for predicting DPFS, serum CRP level might be more preferable serum inflammatory marker in patients with malignant melanoma. However, because of the small number of enrolled patients in the present study, further validation is warranted.
This study has several limitations. First, the total number of patients included in the study was small, making it impossible to perform multivariate analysis. Secondly, because almost half of the enrolled patients underwent excisional biopsy before PET/CT scan, the relation- ship between SUV of melanoma and clinical outcome could not be assessed. Finally, because this study retrospectively enrolled a small number of patients who had been referred to a single institution, results need to be validated in a multi-center study with a large pool of population.
In conclusion, CT HU, SUVmean of SAT and VAT, and BLR showed significant association with DPFS. Patients with low HU and SUVmean of SAT and VAT and low BLR showed better survival. Thus, qualitative characteristics of adipose tissue and SUVmean of BM facilitate the prediction of the risk of disease progression in patients with malignant melanoma.
Author Contributions
Conceptualization, L.S.M.; data curation, L.J.H.; formal analysis, L.S.M.; investigation, L.J.H.; methodolo- gy, L.S.M.; project administration, K.J.E.; resources, K.J.E.; software, L.S.M.; supervision, L.S.M.; validation, K.J.E.; visualization, L.J.H.; writing—original draft, L.J.H.; and writing—review & editing, L.S.M., K.J.E.
Conflicts of Interest
The authors have no potential conflicts of interest to disclose.
Acknowledgments
This work was supported by Soonchunhyang University Research Fund and the National Research Foundation of Korea (NRF) grant funded by the Korea government (Ministry of Science and ICT) (grant number: NRF-2018R1C1B5040061).
REFERENCES
1. Bandarchi B, Jabbari CA, Vedadi A, Navab R. Molecular biology of normal melanocytes and melanoma cells. J Clin Pathol 2013;66:644-648
2. McCourt C, Dolan O, Gormley G. Malignant melanoma: a pictorial review. Ulster Med J 2014;83:103-110 3. Mohr P, Eggermont AM, Hauschild A, Buzaid A. Staging of cutaneous melanoma. Ann Oncol 2009;20 Suppl
6:vi14-vi21
4. Ghuman S, Van Hemelrijck M, Garmo H, Holmberg L, Malmström H, Lambe M, et al. Serum inflammatory markers and colorectal cancer risk and survival. Br J Cancer 2017;116:1358-1365
5. Aino H, Sumie S, Niizeki T, Kuromatsu R, Tajiri N, Nakano M, et al. The systemic inflammatory response as a prognostic factor for advanced hepatocellular carcinoma with extrahepatic metastasis. Mol Clin Oncol 2016;5:83-88
6. Stotz M, Gerger A, Eisner F, Szkandera J, Loibner H, Ress AL, et al. Increased neutrophil-lymphocyte ratio is a poor prognostic factor in patients with primary operable and inoperable pancreatic cancer. Br J Cancer 2013;109:416-421
7. Nieman KM, Romero IL, Van Houten B, Lengyel E. Adipose tissue and adipocytes support tumorigenesis and metastasis. Biochim Biophys Acta 2013;1831:1533-1541
8. Parekh N, Chandran U, Bandera EV. Obesity in cancer survival. Annu Rev Nutr 2012;32:311-342
9. Demark-Wahnefried W, Platz EA, Ligibel JA, Blair CK, Courneya KS, Meyerhardt JA, et al. The role of obesity in cancer survival and recurrence. Cancer Epidemiol Biomarkers Prev 2012;21:1244-1259
10. Renehan AG, Tyson M, Egger M, Heller RF, Zwahlen M. Body-mass index and incidence of cancer: a system- atic review and meta-analysis of prospective observational studies. Lancet 2008;371:569-578
11. Lee JW, Na JO, Kang DY, Lee SY, Lee SM. Prognostic significance of FDG uptake of bone marrow on PET/CT in patients with non-small-cell lung cancer after curative surgical resection. Clin Lung Cancer 2017;18:198- 206
12. Lee JW, Jeon S, Mun ST, Lee SM. Prognostic value of fluorine-18 fluorodeoxyglucose uptake of bone mar- row on positron emission tomography/computed tomography for prediction of disease progression in cervical cancer. Int J Gynecol Cancer 2017;27:776-783
13. Lee JW, Lee MS, Chung IK, Son MW, Cho YS, Lee SM. Clinical implication of FDG uptake of bone marrow on PET/CT in gastric cancer patients with surgical resection. World J Gastroenterol 2017;23:2385-2395 14. Van de Wiele C, Van Vlaenderen M, D’Hulst L, Delcourt A, Copin D, De Spiegeleer B, et al. Metabolic and
morphological measurements of subcutaneous and visceral fat and their relationship with disease stage and overall survival in newly diagnosed pancreatic adenocarcinoma : Metabolic and morphological fat measurements in pancreatic adenocarcinoma. Eur J Nucl Med Mol Imaging 2017;44:110-116
15. Neagu M, Constantin C, Dumitrascu GR, Lupu AR, Caruntu C, Boda D, et al. Inflammation markers in cuta- neous melanoma-edgy biomarkers for prognosis. Discoveries 2015;3:e38
16. Fang S, Wang Y, Sui D, Liu H, Ross MI, Gershenwald JE, et al. C-reactive protein as a marker of melanoma progression. J Clin Oncol 2015;33:1389-1396
17. Hayes AJ, Larkin J. BMI and outcomes in melanoma: more evidence for the obesity paradox. Lancet Oncol 2018;19:269-270
18. Fang S, Wang Y, Dang Y, Gagel A, Ross MI, Gershenwald JE, et al. Association between body mass index, C- reactive protein Levels, and melanoma patient outcomes. J Invest Dermatol 2017;137:1792-1795
19. Sergentanis TN, Antoniadis AG, Gogas HJ, Antonopoulos CN, Adami HO, Ekbom A, et al. Obesity and risk of malignant melanoma: a meta-analysis of cohort and case-control studies. Eur J Cancer 2013;49:642-657 20. Zer A, Domachevsky L, Rapson Y, Nidam M, Flex D, Allen AM, et al. The role of 18F-FDG PET/CT on staging
and prognosis in patients with small cell lung cancer. Eur Radiol 2016;26:3155-3161
21. Perng P, Marcus C, Subramaniam RM. 18F-FDG PET/CT and melanoma: staging, immune modulation and mutation-targeted therapy assessment, and prognosis. AJR Am J Roentgenol 2015;205:259-270
22. Tan TH, Boey CY, Lee BN. Role of pre-therapeutic 18F-FDG PET/CT in guiding the treatment strategy and predicting prognosis in patients with esophageal carcinoma. Asia Ocean J Nucl Med Biol 2016;4:59-65 23. Kwon HW, Lee SM, Lee JW, Oh JE, Lee SW, Kim SY. Association between volume and glucose metabolism
of abdominal adipose tissue in healthy population. Obes Res Clin Pract 2017;11:133-143
24. Murata Y, Kubota K, Yukihiro M, Ito K, Watanabe H, Shibuya H. Correlations between 18F-FDG uptake by bone marrow and hematological parameters: measurements by PET/CT. Nucl Med Biol 2006;33:999-1004 25. Inoue K, Goto R, Okada K, Kinomura S, Fukuda H. A bone marrow F-18 FDG uptake exceeding the liver up-
take may indicate bone marrow hyperactivity. Ann Nucl Med 2009;23:643-649
26. Bural GG, Torigian DA, Chen W, Houseni M, Basu S, Alavi A. Increased 18F-FDG uptake within the reticuloen- dothelial system in patients with active lung cancer on PET imaging may indicate activation of the system- ic immune response. Hell J Nucl Med 2010;13:23-25
27. Van Kruijsdijk RC, Van der Wall E, Visseren FL. Obesity and cancer: the role of dysfunctional adipose tissue.
Cancer Epidemiol Biomarkers Prev 2009;18:2569-2578
28. Okumura T, Ohuchida K, Sada M, Abe T, Endo S, Koikawa K, et al. Extra-pancreatic invasion induces lipolyt- ic and fibrotic changes in the adipose microenvironment, with released fatty acids enhancing the invasive- ness of pancreatic cancer cells. Oncotarget 2017;8:18280-18295
29. Lee JW, Lee SM, Chung YA. Prognostic value of CT attenuation and FDG uptake of adipose tissue in pa- tients with pancreatic adenocarcinoma. Clin Radiol 2018;73:1056.e1-1056.e10
30. Murphy RA, Register TC, Shively CA, Carr JJ, Ge Y, Heilbrun ME, et al. Adipose tissue density, a novel bio- marker predicting mortality risk in older adults. J Gerontol A Biol Sci Med Sci 2014;69:109-117
31. Veld J, Vossen JA, De Amorim Bernstein K, Halpern EF, Torriani M, Bredella MA. Adipose tissue and muscle attenuation as novel biomarkers predicting mortality in patients with extremity sarcomas. Eur Radiol 2016;
26:4649-4655
32. Yoo ID, Lee SM, Lee JW, Baek MJ, Ahn TS. Usefulness of metabolic activity of adipose tissue in FDG PET/CT of colorectal cancer. Abdom Radiol (NY) 2018;43:2052-2059
33. Amjadi F, Javanmard SH, Zarkesh-Esfahani H, Khazaei M, Narimani M. Leptin promotes melanoma tumor growth in mice related to increasing circulating endothelial progenitor cells numbers and plasma NO pro- duction. J Exp Clin Cancer Res 2011;30:21
34. Oba J, Wei W, Gershenwald JE, Johnson MM, Wyatt CM, Ellerhorst JA, et al. Elevated serum leptin levels are associated with an increased risk of sentinel lymph node metastasis in cutaneous melanoma. Medicine (Baltimore) 2016;95:e3073
35. Lavie CJ, De Schutter A, Patel DA, Milani RV. Body composition and fitness in the obesity paradox--body mass index alone does not tell the whole story. Prev Med 2013;57:1-2
36. Ma J, Kuzman J, Ray A, Lawson BO, Khong B, Xuan S, et al. Neutrophil-to-lymphocyte Ratio (NLR) as a pre- dictor for recurrence in patients with stage III melanoma. Sci Rep 2018;8:4044
악성 흑색종 환자에서 시행한 F-18 Fluorodeoxyglucose PET/CT의 지방 조직 및 골수의 영상 파라메터들이
예후에 미치는 영향 평가
이주하1 · 이상미2* · 김정은3
목적 골수와 지방 조직의 F-18 Fluorodeoxyglucose (이하 F-18 FDG) 섭취는 악성 종양에 대 한 전신 염증을 반영한다고 알려져 있다. 본 연구는 악성 흑색종에서 F-18 FDG PET/CT상 골 수의 FDG 섭취와 내장 및 피하 지방 조직의 특성이 가지는 예후적 가치에 대해 평가하였다.
대상과 방법 병리학적으로 악성 흑색종으로 진단받은 환자 중 FDG PET/CT를 시행한 33명의 환자들을 진료차트를 분석하여 후향적으로 포함하였다. 골수 대 간의 FDG 섭취 비, 부피, CT Hounsfield unit (이하 HU) 및 FDG PET/CT상 내장 및 피하 지방 조직의 mean stan- dardized uptake value (이하 SUVmean)을 측정하고, 이 매개 변수들을 가지고 질병 무진 행 생존율에 미치는 예후적 가치에 대해 평가하였다.
결과 병기 III~IV의 환자는 병기 I~II의 환자에 비해 내장 및 피하 지방 조직의 CT HU 및 SU- Vmean 정도가 더 높았으며, 내장 지방 조직의 부피는 더 적었다(p < 0.05). 생존 분석에서 내 장 및 피하 지방 조직의 CT HU와 SUVmean, 그리고 골수 대 간 섭취 비는 악성 흑색종의 무 진행 생존율과 의미 있는 관련성을 보였는데(p < 0.05), 두 지방 조직의 CT HU 및 SUVmean 이 높을수록, 골수 대 간 섭취 비가 높을수록 더 안 좋은 생존율을 보였다. 반면, 두 지방 조직 의 부피는 악성 흑색종의 무진행 생존율과 유의한 연관성을 보이지 않았다(p > 0.05).
결론 내장 및 피하 지방 조직의 CT HU 및 SUVmean, 골수의 SUVmean은 악성 흑색종에서 무진행 생존율을 예측할 수 있는 예후적 정보를 제공할 수 있다.
순천향대학교 천안병원 1영상의학과, 2핵의학과, 3피부과