Transcranial Doppler: examination techniques and interpretation
Youngrok Do1, Yong-Jae Kim2, and Jun Hong Lee3
1Department of Neurology, Catholic University of Daegu School of Medicine, Daegu, Korea
2Department of Neurology, College of Medicine, The Catholic University of Korea, Seoul, Korea
3Department of Neurology, National Health Insurance Service Ilsan Hospital, Ilsan, Korea
Transcranial Doppler (TCD) was introduced in 1982 to assess intracranial arteries noninvasively, since when it has been widely used to assess and monitor cerebrovascular hemodynamics.
The clinical applications of TCD are broadening to include other fields that require monitoring of the cerebral blood flow. TCD has fewer temporal and spatial restrictions than other meth- ods, can be performed on less-compliant patients, and causes no harm to the body. However, its reliance on high levels of examiner skill and experience, as well as a lack of standardized scanning protocols are obstacles that still need to be overcome. In this report we review TCD examination techniques and interpret their findings for several conditions.
Key words: Transcranial Doppler; Standard examination; Interpretation
Ann Clin Neurophysiol 2019;21(2):71-78 https://doi.org/10.14253/acn.2019.21.2.71
Special article
The Korean SocieTy of clinical neurophySiology
Received: December 21, 2017 Revised: January 3, 2018 Accepted: January 3, 2018
Correspondence to
The Korean Society of Clinical Neurophysiology
Daeil Building 1111, 12 Insadong-gil, Jongno-gu, Seoul 03163, Korea Tel: +82-2-2291-2290 Fax: +82-2-737-6531 E-mail: [email protected]
Basic requirements for visual evoked potentials
Hung Youl Seok1, Eun-Mi Lee2, Kee Duk Park3, Dae-Won Seo4; and on behalf of the Korean Society of Clinical Neurophysiology Education Committee
1Department of Neurology, Keimyung University School of Medicine, Daegu, Korea
2Department of Neurology, Ulsan University Hospital, University of Ulsan College of Medicine, Ulsan, Korea
3Department of Neurology, Mokdong Hospital, Ewha Womans University College of Medicine, Seoul, Korea
4Department of Neurology, Samsung Medical Center, Sungkyunkwan University School of Medicine, Seoul, Korea
Visual evoked potentials (VEPs) are frequently used to assess the anterior and posterior visual pathways. In particular, the use of VEPs have been increasing in various fields such as evalua- tion of the optic nerves in patients with multiple sclerosis. The performance of VEP test can be affected by various factors such as stimulus type and subject condition, and its interpretation is also difficult. However, there have been no guidelines for performing and interpreting VEPs in Korea. Therefore, we aimed to provide comprehensive information regarding basic require- ment and interpretation for VEPs.
Key words: Visual evoked potential; Optic nerve; Visual pathway
Ann Clin Neurophysiol 2018;20(1):12-17 https://doi.org/10.14253/acn.2018.20.1.12
THE KOREAN SOCIETY OF CLINICAL NEUROPHYSIOLOGY
INTRODUCTION
A visual evoked potential (VEP) measures an electrophysiological response of the visual pathway to a patterned or unpatterned visual stimulus. It is a reliable, sensitive, and non- invasive technique that can measure impairment of visual pathways.1-4 While stimulation with a relatively low frequency (up to 4/s) generates transient VEPs, stimulation with a high frequency (over 10/s) generates responses corresponding to relatively simple waves in accordance to the stimulation. These are called steady-state VEPs.5 Responses induced by a patterned stimulus are called patterned VEPs (PVEPs), while those induced by an un- patterned stimulus are called flash VEPs (FVEPs).1-4 In this overview we describe compre- hensive information regarding basic requirement and interpretation for VEPs.
SPECIAL ARTICLE
Received: May 22, 2019 Revised: July 5, 2019 Accepted: July 10, 2019
Correspondence to Youngrok Do
Department of Neurology, Catholic University of Daegu School of Medicine, 33 Duryugongwon-ro 17-gil, Nam-gu, Daegu 42472, Korea
Tel: +82-53-650-3064 Fax: +82-53-654-9786 E-mail: [email protected]
ORCID Youngrok Do
https://orcid.org/0000-0001-7204-4991 Yong-Jae Kim
https://orcid.org/0000-0002-8193-1469 Jun Hong Lee
https://orcid.org/0000-0002-5023-6009
IntroductIon
Transcranial Doppler (TCD) was first introduced by Rune Aaslid in 1982 to allow noninva- sive assessments of intracranial arteries,1 since when it has become the general practice for the diagnosis and monitoring of cerebral hemodynamics in multiple conditions. Com- pared to other vascular imaging methods, TCD has fewer temporal and spatial restrictions than other methods, can be performed on less-compliant patients, and causes no harm to the body. However, acquiring a good acoustic window is difficult in some patients, and the success of the technique is highly dependent on the skill of the examiner.
tcd examInatIon
TCD uses 2-MHz ultrasound and sweep speed of 3-5 seconds. The area receiving the ul- trasound is referred to as the acoustic window, and in the head this can be the transtem-
poral, transorbital, suboccipital, or submandibular window (Fig. 1). The transtemporal window allows inspection of the terminal internal carotid artery (ICA), middle cerebral artery (MCA), anterior cerebral artery (ACA), posterior cerebral artery (PCA), and communicating arteries; the transorbital window allows inspection of the ophthalmic artery (OA) and ICA siphon (carotid siphon); the suboccipital window allows inspection of the vertebral artery (VA) and basilar artery (BA);
and the submandibular window allows inspection of the extracranial ICA and common carotid artery. In order to find blood vessels rapidly, the power is initially set to 100% (not exceeding 720 mW) and a broad sampling gate is used (12- 15 mm).
Since blood flow in the distal artery depends on steno-oc- clusion of the proximal artery, the insonation is performed from the proximal to the distal artery. Several principles must be adhered to when performing TCD: 1) when inspecting
major cerebral arteries emerging from the circle of Willis, start closest to the heart and proceed distally; 2) when a blood-flow signal is located, find and record the best sig- nal; 3) inspect at least two locations for each artery; and 4) find the location where the waveforms exhibit the greatest abnormalities. The examiner adjusts the angle and depth of insonation and monitors the direction and waveform of blood flow to determine which intracranial vessels are being insonated (Table 1).
Transtemporal window
In the transtemporal window, the MCA is inspected first, fol- lowed in sequence by the ACA, terminal ICA, and PCA.
MCA
The ultrasound probe is placed on the zygomatic arch an- terior to the tragus, and directed toward the contralateral
fig. 1. The acoustic windows used in the head in routine transcranial Doppler: transtemporal (A), transorbital (B), suboccipital (C), and submandibular (D) windows. The patient consented to the use of these photographs.
A
C
B
D
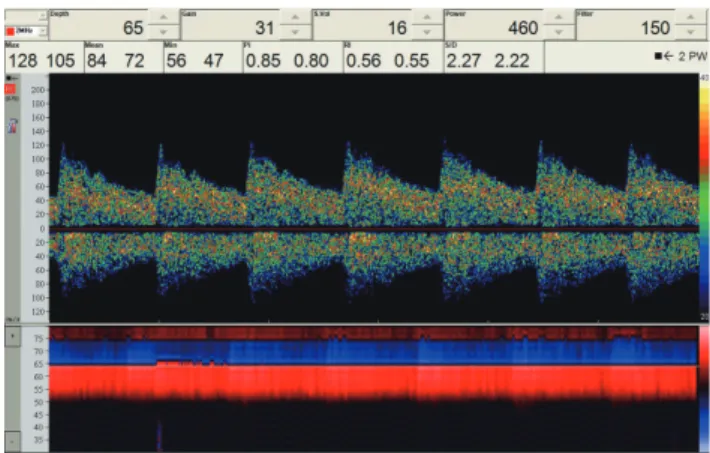
side. If the probe is turned slightly superoanteriorly, a blood- flow signal from the ICA bifurcation should be detected at a depth of approximately 65 mm. The toward- and away- flow signals are from the MCA and ACA, respectively (Fig. 2).
When a toward-flow signal is detected, the probe is moved to locate the fastest flow and the clearest spectral wave- form. The depth is gradually decreased to trace the mid-M1 segment of the MCA at 50 mm, the distal M1 segment at 45 mm, and up to the MCA bifurcation, where the signal disappears at a depth of 30-45 mm. If the signal is lost while reducing the depth, the examiner starts again from a depth of 65 mm, and makes small movements to precisely adjust the angle of insonation. If a blood-flow signal is not detected this does not necessarily indicate that the vessel is obstruct- ed. The presence of the contralateral MCA or the ipsilateral PCA and ACA flows through a temporal window helps to determine the suboptimal temporal window.
ACA
From the ICA bifurcation, the depth is increased to 70-75 mm following the away-flow signal. At 72 mm, angling the probe slightly anterosuperiorly to the MCA will allow the blood- flow signal in segment A1 to be observed. Only segment A1 is inspected since it is difficult to examine segment A2 using TCD.
Terminal ICA
From the ICA bifurcation, turning the probe anteroinferiorly and setting the depth to 70 mm allows the distal part of the supraclinoid siphon to be inspected.
PCA
From the ICA bifurcation, the probe is set to a depth of 63 mm and slowly turned 10-30º posteriorly. After an interval with no blood-flow signal, segments P2 and P1 are detected as away- and toward-flow signals, respectively, at a similar depth (55-75 mm). It is difficult to measure the posterior communicating artery because the large insonation angle is almost orthogonal to the artery.
Transorbital window
Since powerful ultrasound can induce cataracts, the Doppler power is reduced to the minimum (17 mW) or 10% of the maximum while examining the transorbital window. The patient closes their eyes and the probe is placed gently over
table 1. Normal depth, access window, flow direction, and mean flow velocity of each intracranial artery
artery Window Depth (mm) Direction MfV (cm/sec)
MCA M1 segment Transtemporal 45-65 Toward <80
ACA Transtemporal 62-75 Away <80
ICA siphon Transorbital 60-65 Bidirectional <70
OA Transorbital 40-60 Toward Variable
PCA Transtemporal 55-75 Bidirectional <60
BA Suboccipital 80-100 Away <60
VA Suboccipital 45-80 Away <50
MFV, mean flow velocity; MCA, middle cerebral artery; ACA, anterior cerebral artery; ICA, internal carotid artery; OA, ophthalmic artery; PCA, posterior ce- rebral artery; BA, basilar artery; VA, vertebral artery.
fig. 2. Blood-flow signal from the internal carotid artery bifurcation at a depth of approximately 65 mm. Toward- and away-flow signals are from the middle cerebral artery and the anterior cerebral artery, respec- tively. PI, pulsatility index; RI, resistance index; S/D, systolic diastolic ratio.
the upper eyelid and directed slightly medially. A depth of 50-55 mm is used to look for a toward-flow signal. Since the OA has a high resistance to blood flow, the signal is observed during the systolic phase only. Once the OA has been identified, the depth is set to 60-65 mm to find the ICA siphon, where toward-flow signals (segment C4) and away- flow signals (segment C2) can be observed.
Suboccipital window
The Doppler power is set to 100% when insonating the sub- occipital window, from three locations: at the midline 2.5 cm below where the occipital bone meets the neck, and 2-3 cm to the left or right of the midline. The probe is placed over the midline of the suboccipital window and pointed toward the nose. At a depth of 80-100 mm, the away-flow signal is from the BA. Blood-flow signals should be found and re- corded for the proximal (80 mm), mid- (90 mm), and distal (100 mm) BA. Since the cerebellar arteries originate from the BA, TCD may show blood-flow signals in both directions. The toward-flow signals are from cerebellar arteries.
After scanning the BA, the probe is placed 2-3 cm left and right of the midline and angled toward the nose. At a depth of 45-80 mm, the away-flow signal is from the VA. The blood-flow signal at a depth of 70-75 mm is recorded. It is normal for the VA to show some hypoplasia or aplasia on one side. The posterior inferior cerebellar artery appears as a toward-flow signal when examining the VA.
Submandibular window
The proximal ICA can be examined in the submandibular window. The proximal ICA is most-accurately examined using duplex ultrasound. In the submandibular window, a 4-MHz probe is used since there is no need to penetrate bone (the depth is only 30 mm). The probe is placed antero- medially to the attachment of the sternocleidomastoid mus- cle on the mandible, and insonated in the superior direction.
At a depth of 40-60 mm, the low-resistance away-flow signal is from the proximal ICA, and the high-resistance flow sig- nal is from the external carotid artery (ECA). The temporal tapping maneuver should be used when these two arteries are difficult to differentiate: tapping gently on the superficial temporal artery produces a sawtooth waveform in the ECA.
InterpretatIon of doppler spec- tral waveforms
TCD results can be analyzed rapidly during the examination process. The examiner listens to the sound while inspecting the spectral waveforms on the screen. The signal-to-noise ratio of the device is increased to enable accurate observa- tions of the waveforms and make the spectral waveforms clear. The examiner checks whether an envelope-which au- tomatically measures flow velocity-is a good fit for the wave- form. The scale is adjusted according to the peak velocity.
An appropriate baseline is set to prevent false signals. The same signal intensity is maintained throughout each record- ing sweep.
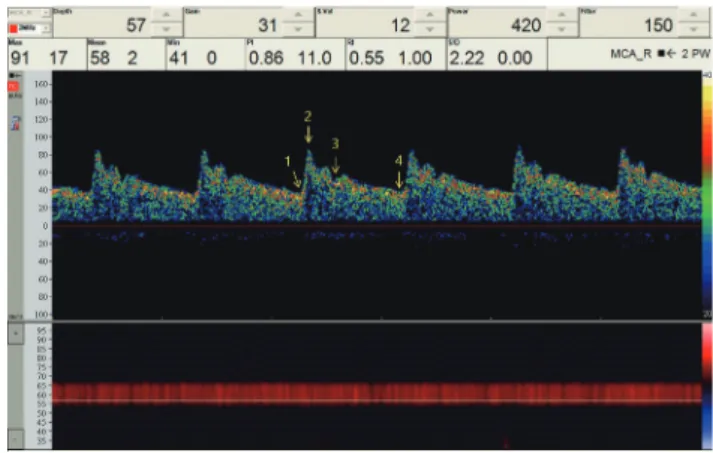
The spectral waveform changes according to the systol- ic and diastolic phases of the heart: 1) the systolic phase begins, the aortic valve closes, the heart contracts, and the aortic valve opens; 2) the peak systolic velocity (PSV) is mea- sured; 3) the aortic valve is closed by the dicrotic notch; and 4) the end diastolic velocity (EDV) is measured. The interval from phase 1 to phase 2 is referred to as systolic accelera- tion or upstroke, and reflects the resistance from the heart to the artery of interest. Systolic deceleration occurs from phase 2 to phase 3. The interval from phase 3 to phase 4 is the diastolic phase, and reflects the resistance from the ar- tery of interest to the periphery (Fig. 3). If the artery is dilated and the resistance is low, the velocity increases from phase
fig. 3. Normal transcranial Doppler spectral waveform of the middle cerebral artery. The interval from phase 1 to phase 2 is referred to as sys- tolic acceleration, and reflects the resistance from the heart to the artery of interest. The interval from phase 3 to phase 4 is the diastolic phase, and reflects the resistance from the artery of interest to the periphery.
PI, pulsatility index; RI, resistance index; S/D, systolic diastolic ratio.
3 to phase 4. EDV is normally around 30% of PSV, and the difference between PSV and EDV divided by the mean flow velocity (MFV) is the pulsatility index (PI). When the intracra- nial pressure is elevated in subarachnoid hemorrhage (SAH), EDV decreases and PI increases. When the distal part of the artery is dilated due to severe arterial stenosis, its resistance decreases, EDV increases, and PI decreases. The gradient of the systolic upstroke changes according to the arterial resis- tance between the heart and the artery of interest. If TCD is performed in the MCA when severe stenosis is present in the ICA, the gradient of the systolic upstroke will be shallower.
The flow velocity typically decreases in the following order: MCA≥ACA≥ICA≥BA≥VA. It is normal to observe differences of up to 30% between bilateral arteries, which is due to physiological changes during examinations and differences in the angle between the artery and the Doppler insonation. The flow velocity decreases with increasing age, and hypertension can increase flow pulsatility.
Intracranial arterial stenosis
Diagnosis of arterial stenosis using TCD is based on MFV. Ste- nosis of 50% is usually defined as an MCA MFV of >100 cm/
sec and a BA MFV of >80 cm/sec, while stenosis of ≥70% is defined as values of >120 and >110 cm/sec, respectively.2-4 The sensitivity and specificity of TCD for diagnosing stenosis are both around 90%.2,3
Signs additional to an elevated MFV that can suggest ce-
rebral arterial stenosis include poststenotic waveforms, an increased MFV in the ACA suggests flow diversion, murmur, and microembolic signals (MES) in distal vessels.5 ACA flow diversion can be detected by an increase in the ACA MFV that is caused by stenosis or hypoplasia in segment A1 of the ACA or a compensatory flow increase in the contralater- al MCA due to proximal carotid artery disease.
Intracranial arterial occlusion
Depending on the distance between the examination site and the site of occlusion, there may be changes in spectral waveforms when examining occluded arteries. No blood- flow signal will be detectable when directly insonating the occlusion, and only systolic spikes will be present at adjacent locations. The systolic acceleration is lower and diastolic blood flow is observed at more-distal sites. The spectral waveform is normal at sites that are even more distal, but the flow velocity is low, at ≤30 cm/sec. The Thrombolysis in Brain Ischemia grading system provides a good summary of
fig. 4. Thrombolysis in Brain Ischemia grading system.
Absent Minimal Blunted
Dempened
Stenotic
Normal
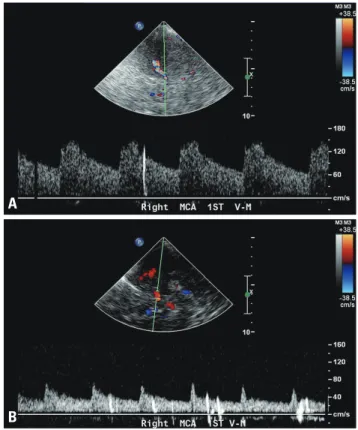
fig. 5. A right-to-left shunt. One (A) and multiple (B) microembolic sig- nals in the right middle cerebral artery are observed when performing the Valsalva maneuver. MCA, middle cerebral artery.
A
B
characteristic changes in blocked or stenotic blood vessels (Fig. 4).6
Secondary findings suggestive of arterial occlusion include 1) absence or delayed systolic acceleration of the distal ar- tery waveform, 2) development of a collateral circulation, and 3) flow reversal.7,8 For example, if the left proximal ICA is occluded, the examiner may observe flow reversal in the left OA and left ACA, as well as a lower systolic acceleration in the left MCA.7
Right-to-left shunt
Like echocardiography, TCD can detect a right-to-left shunt, but it is unable to provide information about the size and lo- cation of intracardiac right-to-left shunts. The testing meth- od involves alternating between mixing a syringe containing 9 mL of normal saline with a syringe containing 1 mL of air via a three-way stopcock to make microbubble-containing saline. The resulting agitated saline is injected intravenously via an 18-gauge needle. MES are observed in the MCA for
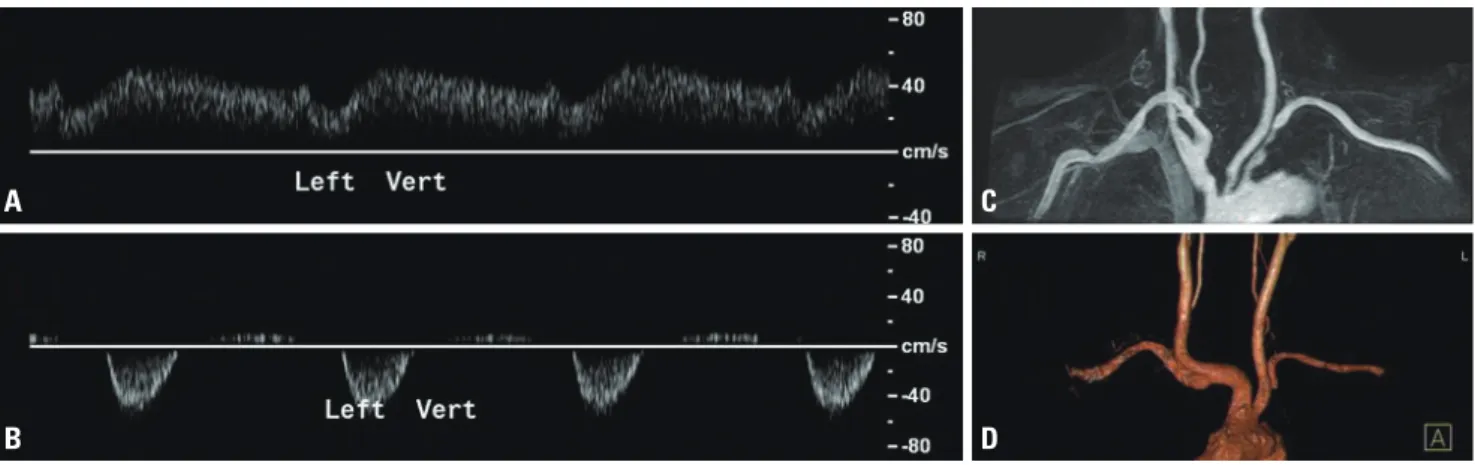
fig. 6. The subclavian steal phenomenon. Bunny (A) and reversed (B) waveforms can be used to predict the presence of moderate stenosis (C) and occlusion (D) of the ipsilateral subclavian arteries, respectively.
A C
B D
fig. 7. Waveforms in the middle cerebral artery of cerebral circulatory arrest. As the intracranial pressure and resistance increase, the end diastolic ve- locity decreases and finally the peak systolic velocity disappears.
Decreasing end-diastolic velocity
Bi-directional flow (oscillating flow) Systolic spikes No signal
one minute. The microbubbles are stabilized during agita- tion by mixing a small amount of the patient’s blood with the saline. Applying the Valsalva maneuver to the patient can help with detecting MES, since this increases the shunt (Fig. 5).9-11
The Spencer Logarithmic Scale (SLS) has been widely used to grade a right-to-left shunt during bilateral MCA monitor- ing as follows: grade 0, 0 MES; grade I, 1-10 MES; grade II, 11- 30 MES; grade III, 31-100 MES; grade IV, 101-300 MES; and grade V, >300 MES. An SLS grade of III or higher can predict a larger shunt on transesophageal echocardiography.12
A right-to-left shunt can cause a paradoxical embolism by bypassing the pulmonary circulation, resulting in stroke. The main causes of paradoxical embolism are patent foramen ovale (PFO) and pulmonary arteriovenous malformation.
TCD is more sensitive but less specific than transthoracic echocardiography (TTE) in detecting PFO in patients with cryptogenic ischemic stroke or transient ischemic attack.
Sensitivity and specificity values of 96.1% and 92.4%, respec- tively, have been found for TCD, and 45.1% and 99.6% for TTE.13
Subclavian steal phenomenon
The subclavian steal phenomenon occurs when there is stenosis of the subclavian artery before the origin of the VA.
Stenosis is detected more often on the left side than the right side. The systolic blood pressure is higher in the VA than in the subclavian artery, which causes blood to flow from the VA to the subclavian artery, presenting as a loss of blood flow or even a reverse flow. The blood pressure increases in the subclavian artery during the diastolic phase, and the normal blood flow direction is restored (Fig. 6).14-16
When it is unclear whether the subclavian steal phenom- enon is present, it can be induced using the hyperemia test.
TCD is used to observe the ipsilateral VA, a blood pressure cuff is placed on the ipsilateral arm, and the pressure in it is then increased to 20 mmHg higher than the systolic blood pressure, which blocks blood flow in the brachial artery. Af- ter 3-5 minutes the cuff is rapidly released, resulting in tem- porarily elevation of the blood flow to the arm. Flow reversal can then be confirmed in the VA.
Brain death
TCD is commonly used as an ancillary test for diagnosing
brain death. Typical TCD findings for brain death are oscil- lating, reverberating, to-and-fro flow, or systolic spikes in the MCA, ICA, or BA. The blood flow moves toward the brain in the systolic phase, but in the opposite direction during the diastolic phase, which indicates a lack of brain perfusion and increased intracranial pressure resulting in a higher intracra- nial resistance (Fig. 7). TCD reportedly has a sensitivity of 90%
and a specificity of 98% for the diagnosis of brain death.17,18 Vasospasm
Vasospasm often occurs 3-12 days after SAH, and can cause delayed ischemic neurological deficits resulting in disabil- ity.19,20 TCD performed soon after SAH can determine the flow velocity in the major cerebral arteries, and repeating the test at regular intervals will facilitate the early detection of changes in the flow velocity and subsequent vasospasm.
Vasospasm is diagnosed when the ratio of the flow velocities between the ICA and MCA (the Lindegaard ratio) is ≥3 and the MCA MFV is >200 cm/sec. Vasospasm can be excluded if the MCA MFV is <120 cm/sec.21 When examining the BA, vasospasm is diagnosed when the ratio of the VA and BA flow velocities (the modified Lindegaard ratio) is ≥3 and the BA MFV is >85 cm/sec.22,23
conclusIons
TCD is a noninvasive, inexpensive monitoring method that provides real-time physiological information about the ce- rebral blood flow and vessels in stroke, cerebrovascular, and surgical patients. The clinical applications of TCD are broad- ening to include the diverse fields that require monitoring of the cerebral blood flow.
Acknowledgement
This article is translated from the original guideline that was published in The Guidelines of Neurophysiologic Procedures on November 2009. The Guidelines were published by The Korean Society of Clinical Neurophysiology.
Conflicts of Interest
The authors have no conflicts to disclose.
references
1. Aaslid R, Markwalder TM, Nornes H. Noninvasive transcranial Doppler ultrasound recording of flow velocity in basal cerebral arteries. J Neurosurg 1982;57:769-774.
2. Navarro JC, Lao AY, Sharma VK, Tsivgoulis G, Alexandrov AV. The accuracy of transcranial Doppler in the diagnosis of middle cere- bral artery stenosis. Cerebrovasc Dis 2007;23:325-330.
3. Feldmann E, Wilterdink JL, Kosinski A, Lynn M, Chimowitz MI, Sarafin J, et al. The Stroke Outcomes and Neuroimaging of Intracra- nial Atherosclerosis (SONIA) trial. Neurology 2007;68:2099-2106.
4. Zhao L, Barlinn K, Sharma VK, Tsivgoulis G, Cava LF, Vasdekis SN, et al. Velocity criteria for intracranial stenosis revisited: an inter- national multicenter study of transcranial Doppler and digital subtraction angiography. Stroke 2011;42:3429-3434.
5. Alexandrov AV, Neumyer MM. Diagnostic criteria for cerebro- vascular ultrasound. In: Alexandrov AV, ed. Cerebrovascular ul- trasound in stroke prevention and treatment. 2nd ed. New York:
Wiley Blackwell Publishing, 2008;79-129.
6. Demchuk AM, Burgin WS, Christou I, Felberg RA, Barber PA, Hill MD, et al. Thrombolysis in brain ischemia (TIBI) transcranial Dop- pler flow grades predict clinical severity, early recovery, and mor- tality in patients treated with intravenous tissue plasminogen activator. Stroke 2001;32:89-93.
7. Schneider PA, Rossman ME, Bernstein EF, Ringelstein EB, Otis SM. Noninvasive assessment of cerebral collateral blood supply through the ophthalmic artery. Stroke 1991;22:31-36.
8. Kim Y, Sin DS, Park HY, Park MS, Cho KH. Relationship between flow diversion on transcranial Doppler sonography and lep- tomeningeal collateral circulation in patients with middle cere- bral artery occlusive disorder. J Neuroimaging 2009;19:23-26.
9. Jauss M, Zanette E. Detection of right-to-left shunt with ultra- sound contrast agent and transcranial Doppler sonography.
Cerebrovasc Dis 2000;10:490-496.
10. Wu CT, Han K, Guo ZN, Yang Y, Gao YS, Bai J, et al. Effects of pa- tient position on right-to-left shunt detection by contrast tran- scranial Doppler. Ultrasound Med Biol 2015;41:654-658.
11. Agustin SJ, Yumul MP, Kalaw AJ, Teo BC, Eng J, Phua Z, et al.
Effects of posture on right-to-left shunt detection by contrast transcranial Doppler. Stroke 2011;42:2201-2205.
12. Spencer MP, Moehring MA, Jesurum J, Gray WA, Olsen JV, Reis- man M. Power M-mode transcranial Doppler for diagnosis of patent foramen ovale and assessing transcatheter closure. J Neuroimaging 2004;14:342-349.
13. Katsanos AH, Psaltopoulou T, Sergentanis TN, Frogoudaki A, Vrettou AR, Ikonomidis I, et al. Transcranial Doppler versus trans- thoracic echocardiography for the detection of patent foramen ovale in patients with cryptogenic cerebral ischemia: a systemat- ic review and diagnostic test accuracy meta-analysis. Ann Neurol 2016;79:625-635.
14. Osiro S, Zurada A, Gielecki J, Shoja MM, Tubbs RS, Loukas M. A re- view of subclavian steal syndrome with clinical correlation. Med Sci Monit 2012;18:RA57-RA63.
15. Sakima H, Wakugawa Y, Isa K, Yasaka M, Ogata T, Saitoh M, et al.
Correlation between the degree of left subclavian artery stenosis and the left vertebral artery waveform by pulse Doppler ultraso- nography. Cerebrovasc Dis 2011;31:64-67.
16. Kliewer MA, Hertzberg BS, Kim DH, Bowie JD, Courneya DL, Carroll BA. Vertebral artery Doppler waveform changes indicating sub- clavian steal physiology. AJR Am J Roentgenol 2000;174:815-819.
17. Chang JJ, Tsivgoulis G, Katsanos AH, Malkoff MD, Alexandrov AV. Diagnostic accuracy of transcranial Doppler for brain death confirmation: systematic review and meta-analysis. AJNR Am J Neuroradiol 2016;37:408-414.
18. Ducrocq X, Hassler W, Moritake K, Newell DW, von Reutern GM, Shiogai T, et al. Consensus opinion on diagnosis of cerebral circulatory arrest using Doppler-sonography: Task Force Group on cerebral death of the Neurosonology Research Group of the World Federation of Neurology. J Neurol Sci 1998;159:145-150.
19. Frontera JA, Fernandez A, Schmidt JM, Claassen J, Wartenberg KE, Badjatia N, et al. Defining vasospasm after subarachnoid hem- orrhage: what is the most clinically relevant definition? Stroke 2009;40:1963-1968.
20. Yamakami I, Isobe K, Yamaura A, Nakamura T, Makino H. Vaso- spasm and regional cerebral blood flow (rCBF) in patients with ruptured intracranial aneurysm: serial rCBF studies with the xe- non-133 inhalation method. Neurosurgery 1983;13:394-401.
21. Lindegaard KF, Nornes H, Bakke SJ, Sorteberg W, Nakstad P. Cere- bral vasospasm after subarachnoid haemorrhage investigated by means of transcranial Doppler ultrasound. Acta Neurochir Suppl (Wien) 1988;42:81-84.
22. Sviri GE, Ghodke B, Britz GW, Douville CM, Haynor DR, Mesiwala AH, et al. Transcranial Doppler grading criteria for basilar artery vasospasm. Neurosurgery 2006;59:360-366; discussion 360-366.
23. Soustiel JF, Shik V, Shreiber R, Tavor Y, Goldsher D. Basilar vaso- spasm diagnosis: investigation of a modified “Lindegaard Index”
based on imaging studies and blood velocity measurements of the basilar artery. Stroke 2002;33:72-77.