GAB2 Amplification in Squamous Cell Lung Cancer of Non- Smokers
Lung squamous cell cancer (SCC) is typically found in smokers and has a very low incidence in non-smokers, indicating differences in the tumor biology of lung SCC in smokers and non-smokers. However, the specific mutations that drive tumor growth in non-smokers have not been identified. To identify mutations in lung SCC of non-smokers, we performed a genetic analysis using arrays comparative genomic hybridization (ArrayCGH). We analyzed 19 patients with lung SCC who underwent surgical treatment between April 2005 and April 2015. Clinical characteristics were reviewed, and DNA was extracted from fresh frozen lung cancer specimens. All of copy number alterations from ArrayCGH were validated using The Cancer Genome Atlas (TCGA) copy number variation (CNV) data of lung SCC. We examined the frequency of copy number changes according to the smoking status (non-smoker [n = 8] or smoker [n = 11]). We identified 16 significantly altered regions from ArrayCGH data, three gain and four loss regions overlapped with the TCGA lung squamous cell carcinoma (LUSC) patients. Within these overlapped significant regions, we detected 15 genes that have been reported in the Cancer Gene census. We also found that the proto-oncogene GAB2 (11q14.1) was significantly amplified in non- smokers patients and vice versa in both ArrayCGH and TCGA data. Immunohistochemical analyses showed that GAB2 protein was relatively upregulated in non-smoker than smoker tissues (37.5% vs. 9.0%, P = 0.007). GAB2 amplification may have an important role in the development of lung SCC in non-smokers. GAB2 may represent a potential biomarker for lung SCC in non-smokers.
Keywords: ArrayCGH; Lung SCC; Non-Smoker; GAB2; Proto-oncogene
Yu Rang Park,1,2* Soo Hyeon Bae,3*Wonjun Ji,3 Eul-Ju Seo,4 Jae Cheol Lee,5 Hyeong Ryul Kim,6 Se Jin Jang,7 and Chang-Min Choi3,5,8
1Clinical Research Center, Asan Institute of Life Science, University of Ulsan College of Medicine, Asan Medical Center, Seoul, Korea; 2Department of Biomedical Informatics, University of Ulsan College of Medicine, Asan Medical Center, Seoul, Korea;
3Department of Pulmonology and Critical Medicine, University of Ulsan College of Medicine, Asan Medical Center, Seoul, Korea; 4Departments of Laboratory Medicine, University of Ulsan College of Medicine, Asan Medical Center, Seoul, Korea;
5Department of Oncology, University of Ulsan College of Medicine, Asan Medical Center, Seoul, Korea; 6Department of Thoracic Surgery, University of Ulsan College of Medicine, Asan Medical Center, Seoul, Korea; 7Department of Pathology, University of Ulsan College of Medicine, Asan Medical Center, Seoul, Korea; 8Office of Clinical Research Information, Asan Institute of Life Science, University of Ulsan College of Medicine, Asan Medical Center, Seoul, Korea
* Yu Rang Park and Soo Hyeon Bae contributed equally to this work.
Received: 13 September 2016 Accepted: 4 August 2017 Address for Correspondence:
Chang-Min Choi, MD, PhD
Department of Pulmonary and Critical Care Medicine, University of Ulsan College of Medicine, Asan Medical Center, 88 Olympic- ro 43-gil, Songpa-gu, Seoul 05505, Korea
E-mail: [email protected]
Funding: This study was supported by a grant of the Korea Health Technology R & D Project through the Korea Health Industry Development Institute (KHIDI), funded by the Ministry of Health and Welfare, Republic of Korea (grant HI15C0516).
https://doi.org/10.3346/jkms.2017.32.11.1784 • J Korean Med Sci 2017; 32: 1784-1791
INTRODUCTION
Lung cancer is one of the most prevalent cancers worldwide (1,2). Over 85% of lung cancer cases are attributed to smoking, which contributes to the accumulation of ge- netic alterations that cause lung cancer. Previous studies have indicated that only a small proportion of lung cancer patients are non-smokers. This has not been well stud- ied in Western western countries; however, in Asian countries, the proportion of pa- tients who are non-smokers is higher (3), and approximately 10%–15% of patients di- agnosed with lung cancer have no history of smoking (4).
Non-smokers with lung cancer are more likely to be female, have adenocarcinoma histology, and East Asian ethnicity. In addition to epidemiological differences, recent findings have shown that several molecular alterations are more frequently detected in non-smoking cancer patients (5-10).
Genetic alterations associated with lung cancer have been identified mainly in ade- nocarcinoma patients and have led to the development of targeted treatment strate- gies. In lung squamous cell cancer (SCC), comparative genomic hybridization (CGH) analyses have revealed frequent amplification of chromosome 3q25-qter (11). Several candidate genes with a potential role in the pathogenesis of lung SCC have been inves- tigated but no genetic mutations have been specifically associated with lung SCC, es- pecially in non-smokers.
Oncology & Hematology
2017-03-16 https://crossmark-cdn.crossref.org/widget/v2.0/logos/CROSSMARK_Color_square.svg
In this study, we performed CGH arrays in 19 patients with lung SCC. We analyzed tissue samples from these patients to identify common genetic mutations associated with lung SCC in non-smokers. Furthermore, we performed retrospective anal- ysis to validate our results using the public lung squamous cell carcinoma (LUSC) database from The Cancer Genome Atlas (TCGA) (12).
MATERIALS AND METHODS
Patient materialPatients with lung SCC who underwent surgical treatment for lung cancer between April 2005 and April 2015 were identified for review. Nineteen fresh frozen specimens from lung SCC pa- tients were collected. Clinical characteristics, including age, sex, tumor stage, treatment history, Eastern Cooperative Oncol- ogy Group status, pulmonary function test, and smoking histo- ry, were recorded (Table 1). DNA was extracted from fresh fro- zen lung cancer specimens and stored at −196°C in liquid nitro- gen and from methanol/acetic acid fixed cells stored at −80°C, using the Qiagen QIAamp
®DNA Micro/Midi Kit (Qiagen, Hilden, Germany). The tissue specimens and data used in this study were provided by Asan Bio-Resource Center, Korea Biobank Network (2013-5[64]).
Array comparative genomic hybridization (ArrayCGH)
ArrayCGH was performed using Agilent customized SurePrint G3 Microarray 60K (Agilent Technologies, Waldbronn, Germa- ny), a high-resolution 60-mer oligonucleotide-based microar- ray. DNA labeling, hybridization, and washing were performed according to the manufacturer’s instructions (protocol version 6.1). Tumor DNA samples were hybridized to pooled male DNA (Human Genomic DNA male, Promega G152A). The slides were
scanned on an Agilent microarray scanner, and captured imag- es were analyzed with feature extraction software. Filtered, nor- malized signal log ratios between lung tumor DNA and normal male reference DNA were used for analysis. The BioConductor package Limma version 3.24.15 was used to perform within-ar- ray normalization using the Loess method and between-array normalization was performed using the Aquantile method (13).
After normalization, the replicate spots were averaged. Probes with less than two valid replicate values and probes that showed a standard deviation above 0.1 between replicate values were excluded. Chromosomal regions with a ratio between 1.11 and 1.41 were scored as “gained” and a ratio of 1.41 or greater was scored as “amplified.” Chromosomal regions with a ratio of be- tween 0.84 and 0.73 were scored as “loss,” whereas a second thresh- old for loss was set for regions showing a ratio less than 0.73.
TCGA single nucleotide polymorphism (SNP) array data and clinical characteristics
Publically available level 3 copy number variation (CNV) data (SNP array) and clinical data of LUSC patients were download- ed from TCGA data portal (https://tcga-data.nci.nih.gov/tcga/) on June 19, 2015. Clinical data from 488 patients and 201 CNV data from primary solid tumors were downloaded. To validate ArrayCGH data, we used 196 CNV and clinical data which were above the intersection of the patient clinical and CNV data. Ta- ble 2 shows the clinical characteristics of lung SCC patients from TCGA.
Copy number segmentation
To identify genomic regions that were significantly amplified or deleted, Genomic Identification of Significant Targets in Cancer (GISTIC, version 2.0.1) was used (14). This method identifies chromosomally altered regions that are over-represented across
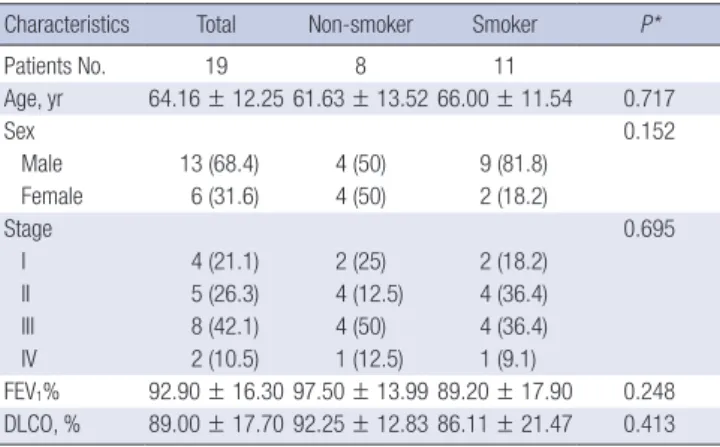
Table 1. Clinical characteristics of LUSC patients
Characteristics Total Non-smoker Smoker P*
Patients No. 19 8 11
Age, yr 64.16 ± 12.25 61.63 ± 13.52 66.00 ± 11.54 0.717
Sex 0.152
Male 13 (68.4) 4 (50) 9 (81.8)
Female 6 (31.6) 4 (50) 2 (18.2)
Stage 0.695
I 4 (21.1) 2 (25) 2 (18.2)
II 5 (26.3) 4 (12.5) 4 (36.4)
III 8 (42.1) 4 (50) 4 (36.4)
IV 2 (10.5) 1 (12.5) 1 (9.1)
FEV1% 92.90 ± 16.30 97.50 ± 13.99 89.20 ± 17.90 0.248 DLCO, % 89.00 ± 17.70 92.25 ± 12.83 86.11 ± 21.47 0.413 Data are shown as mean ± standard deviation or number (%).
LUSC = lung squamous cell carcinoma, FEV1= forced expiratory volume in one sec- ond, DLCO = diffusion lung capacity for carbon monoxide.
*Student’s t-test for groups with continuous outcomes; Fisher's exact test for cate- gorical outcomes.
Table 2. Clinical characteristics of LUSC patients with CNVs from TCGA
Parameters Total Non-smoker Smoker P*
Patients No. 196 9 187
Age, yr 68.05 ± 8.53 62.23 ± 6.42 68.20 ± 8.29 0.024
Sex 0.717
Male 140 6 (4.29) 134 (95.71)
Female 56 3 (5.36) 53 (94.64)
PKY NA† 54.68 ± 35.17
Stage 0.021
I 109 (55.61) 105 (56.15) 4 (44.44) II 45 (22.96) 42 (22.46) 3 (33.33) III 38 (19.39) 37 (19.79) 1 (11.11)
IV 4 (2.04) 3 (1.6) 1 (11.11)
Data are shown as mean ± standard deviation or number (%).
LUSC = lung squamous cell carcinoma, TCGA = The Cancer Genome Atlas, PKY = pack years, NA = not applicable, CNV = copy number variation.
*Student’s t-test for groups with continuous outcomes; Fisher’s exact test for cate- gorical outcomes. †Nine subjects were lifelong non-smokers.
different tumor samples (region of interest) based on the am- plitude and frequency of the alterations and quantifies the de- gree of overrepresentation using a G-score. Each G-score is as- signed a P value by comparing the G-score at each locus to a background G-score distribution, which is corrected using the false discovery rate. This yields multiple testing corrected q-val- ues. Individual significant regions of interest may cover more than one target region, and some false positive regions may ap- pear significant because they are close to a target region. To ad- dress these issues, an additional correction of the q-values is re- quired to confirm independently significant regions. A cutoff q- value of 0.25 was applied to select regions containing Somatic Copy Number Abnormalities (SCNAs) that were significantly over-represented. In a final step, GISTIC was used to determine the peak region and wide peak region for each region of interest.
Immunohistochemistry and scoring
Immunohistochemical assay was performed on paraformalde- hyde-fixed paraffin sections. The GAB2 (OriGene Technologies, Rockville, MD, USA) primary antibodies were used at a 1:50 di- lution in the immunohistochemistry analysis. The immunos- taining intensity and average percentage of positive cells were evaluated as previous reported (15). The immunostaining in-
tensity was scored as: 0 (no staining), 1 (weak staining), 2 (mod- erate staining), and 3 (strong staining). The percentage of stained cells on each section was scored as: 0 (less than 5%), 1 (5%–25%), 2 (26%–50%), and 3 (> 51%) accordingly. Then, the total immu- nostaining score was calculated by multiplying stained intensi- ty score with staining cells score and thus ranged from 0 to 9. A final staining scoring at least 2 points in our study were consid- ered to be positive.
Statistical analysis
We used the Student’s t-test to analyze the ArrayCGH data pro- cessed by GISTIC. The mean log
2(relative ratios) and normal- ized measure of total signal intensity was calculated along each segment between the non-smoker and smoker groups. Multi- ple logistic regression analysis of the copy numbers was applied after age and sex adjustment using the logit function in R (v3.0.2;
R Foundation, Vienna, Austria). We used copy number values calculated by GISTIC and defined the dependent variable as smoking status (Equation 1). This revealed a significant copy number association between non-smoker and smoker groups.
ln = β
Non-Smoker 0+β
1×CNV
1+β
2×Age
2+β
3×Sex
3(Equation 1)
1-Non-smokerFig. 1. Genomic positions of amplified and deleted regions in lung SCC.
Statistically significant (A) six amplified and (B) ten deleted regions were found. The X-axis represents the normalized amplification signals (top) and significance by q-value (bottom). The green line represents the significance cutoff at q-value = 0.25.
SCC = squamous cell cancer.
Significance (q-value) 1
3
5
7
9
11
13 15 17 19 21
1
3
5
7
9
11
13 15 17 19 21 2
4
6
8
10
12 14 16 18 20 22
2
4
6
8
10
12 14 16 18 20 22
Significance (q-value)
0.1 0.2 0.4 0.57 0.8 0.1 0.12 0.2 0.4
0.25 10–1 10–2 10–3 0.25 10–1 10–2 10–3 10–4 10–7
3q27.1
3p14.1
7q3-5 8p23.1
11q22.3 12q13.2
17p12 8p12
12q14.1
5p15.33 4q3-5.2
9p21.3 10q23.31
15q11.2 8q24.21
11q13.3
A B
Ethics statement
All patients signed and submitted informed consent forms. The
project protocol was reviewed and approved by the Institutional Review Board of Asan Medical Center (approval No. 2013-0695).
Table 3. Over-represented CNVs in SCC
Copy number Cytoband Start End Residual q-value Cancer gene (COSMIC)
Gain 3q27.1 183855527 184300347 0.06707
5p15.33* 1 944015 0.01634 TERT
8p12 32859697 33229373 0.18491 NRG1, WRN, WHSC1L1
8q24.21* 128479462 129641935 0.10039
11q13.3* 68549309 69587836 0.10039 NUMA1, CCND1, MEN1
12q14.1 58122100 58216570 0.14608 LRIG3
Loss 3p14.1 53345892 99361511 0.14027 FOXP1, MITF
4q35.2* 189457939 191154276 0.01142
7q35 143656847 145824683 0.07011 EZH2
8p23.1 2088727 9759624 0.01190
9p21.3* 21547337 22519884 1.50E-05 CDKN2A
10q23.31* 89698254 91483602 0.14027 PTEN
11q22.3 102736596 116623316 0.04929 ATM
12q13.2 55025566 55789221 0.11125
15q11.2* 1 22866887 4.44E-07
17p12 9794524 16021198 0.10363
CNV = copy number variation, SCC = squamous cell cancer, COSMIC = catalogue of somatic mutations in cancer, GISTIC = Genomic Identification of Significant Targets in Cancer, TCGA = The Cancer Genome Atlas, LUSC = lung squamous cell carcinoma.
*Tagged cytobands overlapped with GISTIC analysis of TCGA LUSC patients.
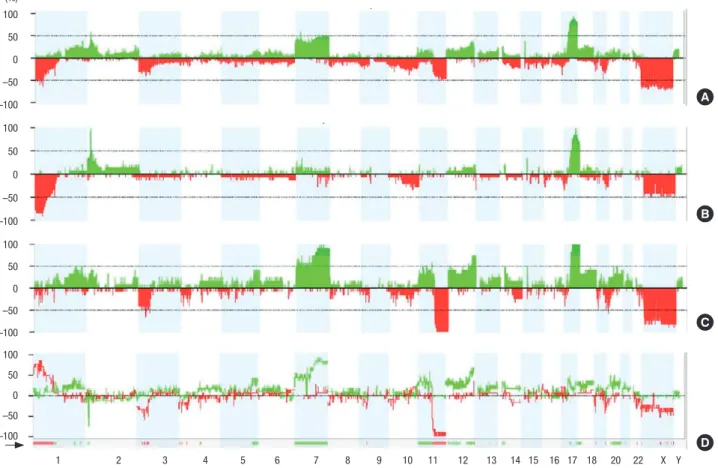
Fig. 2. Frequency of copy number changes for non-smokers and smokers. The frequency of copy number changes was calculated for all measurement points in the arrays and plotted relative to the position along the chromosome for (A) all squamous lung cancer sample, (B) smoker samples, (C) non-smoker samples, and (D) significant copy number differences bewteen smoker and non-smoker. The number of analyzed tumors is indicated. Green bars above the horizontal line indicate the percentage of tumors with copy number gains and red bars below the horizontal line indicate the percentage of tumors with copy number losses.
100 50 0 –50 –100 100 50 0 –50 –100 100 50 0 –50 –100
1 2 3 4 5 6 7 8 9 10 11 12 13 14 15 16 17 18 20 22 X Y
100 50 0 –50 –100 (%)
A
B
C
D
RESULTS
Identification of over-represented significant CNVs in SCC using GISTIC
Using GISTIC, we identified 16 significantly altered regions (six regions of gain on five different chromosomes and ten regions of loss on ten different chromosomes) as depicted in Fig. 1. Three gain (5p15.33, 8q24.21, and 11q13.3) and four loss regions (4q35.2, 9p21.3, 10q23.31, and 15q11.2) overlapped with the GISTIC analysis of TCGA LUSC patients (16). Based on the highest q- value (cutoff > 0.25), Table 3 shows the 16 significant regions of gain and loss. The GISTIC algorithm defines “peak regions” of major chromosomal instability by the magnitude and frequen- cy of a copy number event. Within these significant regions, we detected 15 genes (ATM, CCND1, CDKN2A, DUX4L1, EZH2,
FOXP1, LRIG3, MEN1, MITF, NRG1, NUMA1, PTEN, TERT, WHSC1L1, and WRN) that have been reported in the Cancer
Gene Census downloaded on March 21, 2016, from the cata- logue of somatic mutations in cancer (COSMIC) (17).
Identification of smoking status with different genomic signatures
We examined the frequency of copy number changes accord- ing to the smoking status in the ArrayCGH dataset (non-smoker [n = 8] and smoker [n = 11]) (Fig. 2). Statistical analysis of copy number changes between smokers and non-smokers revealed 539 protein-coding genes that were differentially altered be- tween the two groups (P < 0.05). The genetic differences be- tween smoker and non-smoker SCC patients are illustrated in Fig. 3.
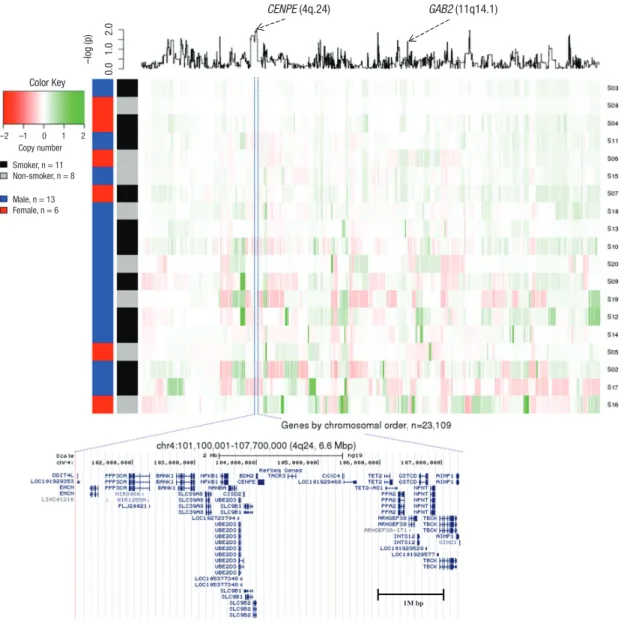
Fig. 3. Genetic differences in non-smoking SCC patients compared with smoking SCC patients. X-axis represents genes by chromosomal order, and Y-axis represents 19 sam- ples that are clustered by Euclidian distance based on normalized intensity values. A line plot at the top panel is the P value from a t-test which was log2 transformed.
SCC = squamous cell cancer.
( q ) ( q )
1M bp
CENPE (4q.24)
–log (p) 0.0 1.0 2.0 Color Key
Copy number Smoker, n = 11 Non-smoker, n = 8
Male, n = 13 Female, n = 6 –2 –1 0 1 2
GAB2 (11q14.1)
The most significant (P = 0.0093) protein-coding gene was
CENPE (4q24) (the full gene list is presented in SupplementaryTable 1). CENPE was amplified in the smoker and deleted in the non-smoker group. A SNP (rs1400363) in this gene was also reported in the Genome-wide Association Study and was highly associated with nicotine dependence in smokers (P = 9.9E-06) (18). A multiple logistic regression model with adjustment for age and sex was used to test copy number associations between nine lifelong non-smokers and 187 smokers to determine wheth- er SCC depends on the smoking status in the TCGA LUSC data- set. To validate our ArrayCGH, we compared the differentially altered 539 genes with significant copy number changes from the TCGA LUSC dataset. The proto-oncogene GAB2 (11q14.1) was significantly associated in both datasets (ArrayCGH: P = 0.039;
TCGA: P = 0.038). GAB2 was deleted in smokers and amplified in non-smokers in both datasets.
Immunohistochemistry result of GAB2
To further investigate the expression of GAB2 protein in lung SCC of smoker and non-smoker tissues, immunohistochemistry staining was performed. According to the established evaluation principle for immunostaining, GAB2 protein positive expression rate was 37.5% (3/8) in non-smoker tissues; whereas was weak expression or only one positive expression (9%, 1/11) in smoker tissue, exhibiting a significant difference of comparison within this result (P = 0.007, Fig. 4). Data were analyzed by χ
2-test.
DISCUSSION
Tumors are caused by mutations in genes that affect cell prolif- eration and regulation (19). Activation of oncogenes, inactiva- tion of tumor suppressor genes, and increased instability of var-
Fig. 4. Immunohistochemical staining for GAB2 in Lung SCC of non-smoker and smoker. (A) Lung SCC of non-smoker was positive for GAB2 staining. The total immunostaining score was 3% and 20% of cancer cells were stained. (B) Lung SCC of smoker was negative for GAB2 staining. While some cancer cells were shown weak positive for GAB2 staining, the percentage of stained cancer cell was less than 5%, and the total immunostaining score was 0.
SCC = squamous cell cancer.
A B
A B
A B
ious genes comprise the genetic changes that affect the growth, differentiation, and survival of cells and ultimately lead to lung cancer. Lung cancer in non-smokers is a distinct disease driven by isolated genetic events rather than widespread genetic and epigenetic changes, which are frequent in smokers. Genomic alterations in lung cancer are related to the progression and de- termine the optimal treatment of the disease. In this study, we performed an ArrayCGH experiment to determine the genetic characteristics of SCC lung cancer in nonsmokers. We verified the results of the ArrayCGH experiment through TCGA SNP ar- ray data, a public genomic database, and found a new proto- oncogene, GAB2. In addition, we measured the protein expres- sion of GAB2 in immunohistochemistry and analyzed it in smok- ers and non-smokers tissues.
GAB2 is a member of the GAB protein family, which also in- cludes GAB1, GAB3, and GAB4. In Drosophila, this gene is called daughter of sevenless (Dos) and in Caenorhabditis elegans sup- pressor of Clr (Soc)-1 (20). GAB proteins promote human tu- morigenesis by facilitating oncoproteins or by amplifying sig- naling via GAB2 overexpression (21-25).
GAB2 is developing a strong track record as an oncoprotein
in various solid tumors (26). GAB2 can stimulate Erk and AKT
signaling through interactions with SHP2 and the p85 subunit
of PI3K respectively (27,28). Amplification of GAB2 has been
reported in several cancers, including melanoma (25), ovarian
cancer (22), breast cancer (21), gliomas (23), and gastic cancer
(24). The SHP2/Ras and PI3K/Akt pathways are the two major
signaling trasduction pathways of GAB2 (29). Increased PI3K
signaling and abberation of the PI3K pathway genes PIK3CA,
PKB, and PTEN have been implicated in several types of cancerincluding lung cancer (30). A recent study showed that the as-
sociation of c-Met with PI3K and GAB2 was diminished by c-
Met inhibition in small cell lung cancer (31). In addition, abla- tion of GAB2 severely suppressed lung metastasis (32), impli- cating GAB2 as an important therapeutic target. GAB2 was over- expressed and coupled with ErbB2 (also known as Neu or HER2) receptor signaling in breast cancer (33). GAB2 is also important for the progression of tumorigenesis and is overexpressed in lung cancer tissue. However, further investigation into GAB2 expression is required.
However, the role of GAB2 in lung SCC of non-smoker has not been reported. In this study, we characterized the genetic variations of SCC in non-smokers using ArrayCGH. Our results suggested that copy numbers in non-smokers are different from smokers, and we identified a proto-oncogene GAB2 that was significantly associated with SCC development in non-smok- ers. Although we used SNP chip data, which is a different ap- proach to TCGA, we adjusted for age and sex to obtain accurate data that could be compared with public databases. We also measured the expression of GAB2 protein through IHC, and we found a statistically significantly higher number of highly ex- pressed in non-smokers.
There are some limitations in our study. First, we did not per- form other functional analyses. However, there is a wealth of evidence that GAB2 has an important role in carcinogenesis (29). Moreover, it is well known that genetic variations in Kore- an and Asian patients differ from those in American patients.
Second, the number of tissues was small in this study. Most of lung cancer patients had an advanced stage at the diagnosis, and the proportioin of squamous cell carcinoma in Korea has decreased continously in recent (34). Because LUSC is well known smoking related carcinoma of the lung, the numbers of LUSC in non-smokers are too small. In this reason, we got a few sam- ples from LUSC patients who were never smokers. Although the number of tissues was small, the differenece of GAB2 in squamous cell carcinoma between smokers and non-smokers was significant. So, further large population based study to clar- ify the clinical significance of GAB2 in squamous cell carcino- ma is required.
In summary, we identified a GAB2 genetic variation that was associated with lung cancer in non-smokers by ArrayCGH and this result was validated by TCGA data. We also found that the protein expression of GAB2 was relatively upregulated in non- smoker than smoker tissues. Smoking is a major risk factor for lung cancer, but specific genetic alterations affect the develop- ment of lung cancer in non-smokers. Identification of these spe- cific genetic alterations may uncover new biomarkers to identi- fy individuals at high risk of developing lung cancer. This may have implications for early detection and targeted therapy.
ACKNOWLEDGMENT
The array comparative genomic hybridization (ArrayCGH) vali-
dation results shown here are in part based upon data generat- ed by the The Cancer Genome Atlas (TCGA) Research Network (http://cancergenome.nih.gov/). The biospecimen and data used in this study was provided by Asan Bio-Resource Center, Korea Biobank Network (2013-5[64]).
DISCLOSURE
The authors have no potential conflicts of interest to disclose.
AUTHOR CONTRIBUTION
Conceptualization: Park YR, Bae SH, Ji W, Seo EJ, Lee JC, Kim HR, Jang SJ, Choi CM. Data curation: Park YR, Choi CM, Seo EJ, Lee JC, Kim HR, Jang SJ. Investigation: Park YR, Bae SH, Ji W, Seo EJ, Lee JC, Kim HR, Jang SJ, Choi CM. Writing - original draft:
Park YR, Bae SH, Ji W, Seo EJ, Lee JC, Kim HR, Jang SJ, Choi CM.
Writing - review & editing: Park YR, Bae SH, Ji W, Seo EJ, Lee JC, Kim HR, Jang SJ, Choi CM.
ORCID
Yu Rang Park https://orcid.org/0000-0002-4210-2094 Soo Hyeon Bae https://orcid.org/0000-0002-3124-3326 Wonjun Ji https://orcid.org/0000-0001-7164-2770 Eul-Ju Seo https://orcid.org/0000-0002-8247-3746 Jae Cheol Lee https://orcid.org/0000-0001-5963-0259 Hyeong Ryul Kim https://orcid.org/0000-0002-6691-7693 Se Jin Jang https://orcid.org/0000-0001-8239-4362 Chang-Min Choi https://orcid.org/0000-0002-2881-4669 REFERENCES
1. Siegel R, Naishadham D, Jemal A. Cancer statistics, 2013. CA Cancer J Clin 2013; 63: 11-30.
2. Ferlay J, Shin HR, Bray F, Forman D, Mathers C, Parkin DM. Estimates of worldwide burden of cancer in 2008: GLOBOCAN 2008. Int J Cancer 2010;
127: 2893-917.
3. Subramanian J, Govindan R. Lung cancer in never smokers: a review. J Clin Oncol 2007; 25: 561-70.
4. Thun MJ, Hannan LM, Adams-Campbell LL, Boffetta P, Buring JE, Feska- nich D, Flanders WD, Jee SH, Katanoda K, Kolonel LN, et al. Lung cancer occurrence in never-smokers: an analysis of 13 cohorts and 22 cancer registry studies. PLoS Med 2008; 5: e185.
5. Koo LC, Ho JH. Worldwide epidemiological patterns of lung cancer in non- smokers. Int J Epidemiol 1990; 19 Suppl 1: S14-23.
6. Gao YT, Blot WJ, Zheng W, Ershow AG, Hsu CW, Levin LI, Zhang R, Frau- meni JF Jr. Lung cancer among Chinese women. Int J Cancer 1987; 40:
604-9.
7. Pao W, Miller V, Zakowski M, Doherty J, Politi K, Sarkaria I, Singh B, Hee- lan R, Rusch V, Fulton L, et al. EGF receptor gene mutations are common in lung cancers from “never smokers” and are associated with sensitivity
of tumors to gefitinib and erlotinib. Proc Natl Acad Sci U S A 2004; 101:
13306-11.
8. Lynch TJ, Bell DW, Sordella R, Gurubhagavatula S, Okimoto RA, Branni- gan BW, Harris PL, Haserlat SM, Supko JG, Haluska FG, et al. Activating mutations in the epidermal growth factor receptor underlying respon- siveness of non-small-cell lung cancer to gefitinib. N Engl J Med 2004;
350: 2129-39.
9. Paez JG, Jänne PA, Lee JC, Tracy S, Greulich H, Gabriel S, Herman P, Kaye FJ, Lindeman N, Boggon TJ, et al. EGFR mutations in lung cancer: corre- lation with clinical response to gefitinib therapy. Science 2004; 304: 1497- 500.
10. Nordquist LT, Simon GR, Cantor A, Alberts WM, Bepler G. Improved sur- vival in never-smokers vs current smokers with primary adenocarcino- ma of the lung. Chest 2004; 126: 347-51.
11. Brunelli M, Bria E, Nottegar A, Cingarlini S, Simionato F, Caliò A, Eccher A, Parolini C, Iannucci A, Gilioli E, et al. True 3q chromosomal amplifica- tion in squamous cell lung carcinoma by FISH and aCGH molecular anal- ysis: impact on targeted drugs. PLoS One 2012; 7: e49689.
12. Cancer Genome Atlas Research Network. Comprehensive genomic char- acterization of squamous cell lung cancers. Nature 2012; 489: 519-25.
13. Ritchie ME, Phipson B, Wu D, Hu Y, Law CW, Shi W, Smyth GK. limma powers differential expression analyses for RNA-sequencing and micro- array studies. Nucleic Acids Res 2015; 43: e47.
14. Mermel CH, Schumacher SE, Hill B, Meyerson ML, Beroukhim R, Getz G.
GISTIC2.0 facilitates sensitive and confident localization of the targets of focal somatic copy-number alteration in human cancers. Genome Biol 2011; 12: R41.
15. Ding C, Luo J, Fan X, Li L, Li S, Wen K, Feng J, Wu G. Elevated GAB2 induc- es tumor growth and angiogenesis in colorectal cancer through upregu- lating VEGF levels. J Exp Clin Cancer Res 2017; 36: 56-67.
16. Broad Institute TCGA Genome Data Analysis Center (US). SNP6 copy number analysis (GISTIC2) [Internet]. Available at http://gdac.broadin- stitute.org/runs/analyses__2015_04_02/reports/cancer/LUSC/CopyNum- ber_ Gistic2/nozzle.html [accessed on 9 September 2016].
17. Forbes SA, Beare D, Gunasekaran P, Leung K, Bindal N, Boutselakis H, Ding M, Bamford S, Cole C, Ward S, et al. COSMIC: exploring the world’s knowledge of somatic mutations in human cancer. Nucleic Acids Res 2015;
43: D805-11.
18. Caporaso N, Gu F, Chatterjee N, Sheng-Chih J, Yu K, Yeager M, Chen C, Jacobs K, Wheeler W, Landi MT, et al. Genome-wide and candidate gene association study of cigarette smoking behaviors. PLoS One 2009; 4: e4653.
19. Minna JD. Molecular biology overview. In: Pass HI, Mitchell JB, Johnson DH, Turrisi AT, editors. Lung Cancer: Principles and Practice. Philadel- phia, PA, Lippincott-Raven, 1996, p143-8.
20. Wöhrle FU, Daly RJ, Brummer T. Function, regulation and pathological roles of the Gab/DOS docking proteins. Cell Commun Signal 2009; 7: 22.
21. Bentires-Alj M, Gil SG, Chan R, Wang ZC, Wang Y, Imanaka N, Harris LN, Richardson A, Neel BG, Gu H. A role for the scaffolding adapter GAB2 in breast cancer. Nat Med 2006; 12: 114-21.
22. Wang Y, Sheng Q, Spillman MA, Behbakht K, Gu H. GAB2 regulates the migratory behaviors and E-cadherin expression via activation of the PI3K pathway in ovarian cancer cells. Oncogene 2012; 31: 2512-20.
23. Shi L, Sun X, Zhang J, Zhao C, Li H, Liu Z, Fang C, Wang X, Zhao C, Zhang X, et al. GAB2 expression in glioma and its implications for tumor invasion.
Acta Oncol 2013; 52: 1739-50.
24. Lee SH, Jeong EG, Nam SW, Lee JY, Yoo NJ, Lee SH. Increased expression of GAB2, a scaffolding adaptor of the tyrosine kinase signalling, in gastric carcinomas. Pathology 2007; 39: 326-9.
25. Chernoff KA, Bordone L, Horst B, Simon K, Twadell W, Lee K, Cohen JA, Wang S, Silvers DN, Brunner G, et al. GAB2 amplifications refine molecu- lar classification of melanoma. Clin Cancer Res 2009; 15: 4288-91.
26. Xu XL, Wang X, Chen ZL, Jin M, Yang W, Zhao GF, Li JW. Overexpression of Grb2-associated binder 2 in human lung cancer. Int J Biol Sci 2011; 7:
496-504.
27. Dunn GP, Cheung HW, Agarwalla PK, Thomas S, Zektser Y, Karst AM, Bo- ehm JS, Weir BA, Berlin AM, Zou L, et al. In vivo multiplexed interroga- tion of amplified genes identifies GAB2 as an ovarian cancer oncogene.
Proc Natl Acad Sci U S A 2014; 111: 1102-7.
28. Zhang X, Zhang Y, Tao B, Wang D, Cheng H, Wang K, Zhou R, Xie Q, Ke Y.
Docking protein GAB2 regulates mucin expression and goblet cell hyper- plasia through TYK2/STAT6 pathway. FASEB J 2012; 26: 4603-13.
29. Ding CB, Yu WN, Feng JH, Luo JM. Structure and function of GAB2 and its role in cancer (Review). Mol Med Rep 2015; 12: 4007-14.
30. Liu P, Cheng H, Roberts TM, Zhao JJ. Targeting the phosphoinositide 3-ki- nase pathway in cancer. Nat Rev Drug Discov 2009; 8: 627-44.
31. Maulik G, Madhiwala P, Brooks S, Ma PC, Kijima T, Tibaldi EV, Schaefer E, Parmar K, Salgia R. Activated c-Met signals through PI3K with dramatic effects on cytoskeletal functions in small cell lung cancer. J Cell Mol Med 2002; 6: 539-53.
32. Xu LJ, Wang YC, Lan HW, Li J, Xia T. Grb2-associated binder-2 gene pro- motes migration of non-small cell lung cancer cells via Akt signaling path- way. Am J Transl Res 2016; 8: 1208-17.
33. Daly RJ, Gu H, Parmar J, Malaney S, Lyons RJ, Kairouz R, Head DR, Hen- shall SM, Neel BG, Sutherland RL. The docking protein GAB2 is overex- pressed and estrogen regulated in human breast cancer. Oncogene 2002;
21: 5175-81.
34. Shin A, Oh CM, Kim BW, Woo H, Won YJ, Lee JS. Lung cancer epidemiol- ogy in Korea. Cancer Res Treat 2017; 49: 616-26.
Supplementary Table 1. A list of statistically differentially altered 539 protein coding genes between smoker and non-smoker
Gene Symbol Locus ID Cytoband FDR Value P*
CENPE 1062 4q24 0.966 0.009
TACR3 6870 4q24 0.966 0.010
CXXC4 80319 4q24 0.966 0.010
TET2 54790 4q24 0.966 0.010
PPA2 27068 4q24 0.966 0.010
ARHGEF38 54848 4q24 0.966 0.010
INTS12 57117 4q24 0.966 0.010
GSTCD 79807 4q24 0.966 0.010
NPNT 255743 4q24 0.966 0.010
TBCK 93627 4q24 0.966 0.010
AIMP1 9255 4q24 0.966 0.010
DKK2 27123 4q25 0.966 0.010
PAPSS1 9061 4q25 0.966 0.010
SGMS2 166929 4q25 0.966 0.010
CYP2U1 113612 4q25 0.966 0.010
HADH 3033 4q25 0.966 0.010
LEF1 51176 4q25 0.966 0.010
RPL34 6164 4q25 0.966 0.010
OSTC 58505 4q25 0.966 0.010
AGXT2L1 64850 4q25 0.966 0.010
COL25A1 84570 4q25 0.966 0.010
SEC24B 10427 4q25 0.966 0.010
CCDC109B 55013 4q25 0.966 0.010
CASP6 839 4q25 0.966 0.010
PLA2G12A 81579 4q25 0.966 0.010
CFI 3426 4q25 0.966 0.010
GAR1 54433 4q25 0.966 0.010
RRH 10692 4q25 0.966 0.010
EGF 1950 4q25 0.966 0.010
LRIT3 345193 4q25 0.966 0.010
ELOVL6 79071 4q25 0.966 0.010
ENPEP 2028 4q25 0.966 0.010
PITX2 5308 4q25 0.966 0.010
NDUFAF1 51103 15q15.1 0.966 0.011
GRID2 2895 4q22.1 0.966 0.012
ATOH1 474 4q22.2 0.966 0.013
SMARCAD1 56916 4q22.3 0.966 0.013
HPGDS 27306 4q22.3 0.966 0.013
PDLIM5 10611 4q22.3 0.966 0.013
BMPR1B 658 4q22.3 0.966 0.013
UNC5C 8633 4q22.3 0.966 0.013
PDHA2 5161 4q22.3 0.966 0.013
C4orf37 285555 4q22.3 0.966 0.013
RAP1GDS1 5910 4q23 0.966 0.013
TSPAN5 10098 4q23 0.966 0.013
EIF4E 1977 4q23 0.966 0.013
METAP1 23173 4q23 0.966 0.013
ADH4 127 4q23 0.966 0.013
ADH5 128 4q23 0.966 0.013
PCNAP1 359806 4q23 0.966 0.013
ADH6 130 4q23 0.966 0.013
ADH1A 124 4q23 0.966 0.013
ADH1B 125 4q23 0.966 0.013
ADH1C 126 4q23 0.966 0.013
ADH7 131 4q23 0.966 0.013
C4orf17 84103 4q23 0.966 0.013
(continued to the next)
Supplementary Table 1. Continued
Gene Symbol Locus ID Cytoband FDR Value P*
RG9MTD2 93587 4q23 0.966 0.013
MTTP 4547 4q23 0.966 0.013
DAPP1 27071 4q23 0.966 0.013
DNAJB14 79982 4q23 0.966 0.013
LAMTOR3 8649 4q23 0.966 0.013
H2AFZ 3015 4q23 0.966 0.013
DDIT4L 115265 4q24 0.966 0.013
EMCN 51705 4q24 0.966 0.013
PPP3CA 5530 4q24 0.966 0.013
FLJ20021 90024 4q24 0.966 0.013
BANK1 55024 4q24 0.966 0.013
SLC39A8 64116 4q24 0.966 0.013
NFKB1 4790 4q24 0.966 0.013
MANBA 4126 4q24 0.966 0.013
UBE2D3 7323 4q24 0.966 0.013
CISD2 493856 4q24 0.966 0.013
SLC9B1 150159 4q24 0.966 0.013
SLC9B2 133308 4q24 0.966 0.013
BDH2 56898 4q24 0.966 0.013
RTF1 23168 15q15.1 0.966 0.014
ITPKA 3706 15q15.1 0.966 0.014
LTK 4058 15q15.1 0.966 0.014
RPAP1 26015 15q15.1 0.966 0.014
TYRO3 7301 15q15.1 0.966 0.014
MGA 23269 15q15.1 0.966 0.014
JMJD7 100137047 15q15.1 0.966 0.014
MAPKBP1 23005 15q15.1 0.966 0.014
PLA2G4B 100137049 15q15.1 0.966 0.014
SPTBN5 51332 15q15.1 0.966 0.014
EHD4 30844 15q15.1 0.966 0.014
WAPAL 23063 10q23.2 0.966 0.014
OPN4 94233 10q23.2 0.966 0.014
LDB3 11155 10q23.2 0.966 0.014
BMPR1A 657 10q23.2 0.966 0.014
MMRN2 79812 10q23.2 0.966 0.014
SNCG 6623 10q23.2 0.966 0.014
C10orf116 10974 10q23.2 0.966 0.014
AGAP11 119385 10q23.2 0.966 0.014
FAM25A 643161 10q23.2 0.966 0.014
GLUD1 2746 10q23.2 0.966 0.014
FAM35A 54537 10q23.2 0.966 0.014
FAM22A 728118 10q23.2 0.966 0.014
FAM22D 728130 10q23.2 0.966 0.014
MINPP1 9562 10q23.2 0.966 0.014
PAPSS2 9060 10q23.2 0.966 0.014
ATAD1 84896 10q23.31 0.966 0.014
CFL1P1 142913 10q23.31 0.966 0.014
KLLN 100144748 10q23.31 0.966 0.014
PTEN 5728 10q23.31 0.966 0.014
ACSS1 84532 20p11.21 0.966 0.018
VSX1 30813 20p11.21 0.966 0.018
ENTPD6 955 20p11.21 0.966 0.018
PYGB 5834 20p11.21 0.966 0.018
ABHD12 26090 20p11.21 0.966 0.018
GINS1 9837 20p11.21 0.966 0.018
NINL 22981 20p11.21 0.966 0.018
(continued to the next page)
Supplementary Table 1. Continued
Gene Symbol Locus ID Cytoband FDR Value P*
SPP1 6696 4q22.1 0.966 0.020
PKD2 5311 4q22.1 0.966 0.020
ABCG2 9429 4q22.1 0.966 0.020
PPM1K 152926 4q22.1 0.966 0.020
HERC6 55008 4q22.1 0.966 0.020
HERC5 51191 4q22.1 0.966 0.020
PIGY 84992 4q22.1 0.966 0.020
HERC3 8916 4q22.1 0.966 0.020
NAP1L5 266812 4q22.1 0.966 0.020
FAM13A 10144 4q22.1 0.966 0.020
TIGD2 166815 4q22.1 0.966 0.020
GPRIN3 285513 4q22.1 0.966 0.020
SNCA 6622 4q22.1 0.966 0.020
MMRN1 22915 4q22.1 0.966 0.020
FAM190A 401145 4q22.1 0.966 0.020
NMU 10874 4q12 0.966 0.020
EXOC1 55763 4q12 0.966 0.020
CEP135 9662 4q12 0.966 0.020
KIAA1211 57482 4q12 0.966 0.020
AASDH 132949 4q12 0.966 0.020
PPAT 5471 4q12 0.966 0.020
PAICS 10606 4q12 0.966 0.020
SRP72 6731 4q12 0.966 0.020
ARL9 132946 4q12 0.966 0.020
HOPX 84525 4q12 0.966 0.020
SPINK2 6691 4q12 0.966 0.020
REST 5978 4q12 0.966 0.020
NOA1 84273 4q12 0.966 0.020
POLR2B 5431 4q12 0.966 0.020
IGFBP7 3490 4q12 0.966 0.020
LPHN3 23284 4q13.1 0.966 0.021
TECRL 253017 4q13.1 0.966 0.021
EPHA5 2044 4q13.1 0.966 0.021
CENPC1 1060 4q13.2 0.966 0.021
STAP1 26228 4q13.2 0.966 0.021
UBA6 55236 4q13.2 0.966 0.021
GNRHR 2798 4q13.2 0.966 0.021
TMPRSS11D 9407 4q13.2 0.966 0.021
TMPRSS11A 339967 4q13.2 0.966 0.021
TMPRSS11GP 644759 4q13.2 0.966 0.021
SYT14L 401135 4q13.2 0.966 0.021
TMPRSS11F 389208 4q13.2 0.966 0.021
FTLP10 100130017 4q13.2 0.966 0.021
TMPRSS11BNL 401136 4q13.2 0.966 0.021
TMPRSS11B 132724 4q13.2 0.966 0.021
YTHDC1 91746 4q13.2 0.966 0.021
TMPRSS11E 28983 4q13.2 0.966 0.021
UGT2B10 7365 4q13.2 0.966 0.021
UGT2B15 7366 4q13.2 0.966 0.021
UGT2B17 7367 4q13.2 0.966 0.021
UGT2A3 79799 4q13.2 0.966 0.021
UGT2B7 7364 4q13.2 0.966 0.021
UGT2B11 10720 4q13.2 0.966 0.021
UGT2B28 54490 4q13.2 0.966 0.021
UGT2B4 7363 4q13.2 0.966 0.021
UGT2A1 10941 4q13.2 0.966 0.021
(continued to the next)
Gene Symbol Locus ID Cytoband FDR Value P*
UGT2A2 574537 4q13.2 0.966 0.021
SULT1B1 27284 4q13.3 0.966 0.021
SULT1E1 6783 4q13.3 0.966 0.021
CSN1S1 1446 4q13.3 0.966 0.021
CSN2 1447 4q13.3 0.966 0.021
STATH 6779 4q13.3 0.966 0.021
HTN3 3347 4q13.3 0.966 0.021
HTN1 3346 4q13.3 0.966 0.021
C4orf40 401137 4q13.3 0.966 0.021
CSN1S2AP 286828 4q13.3 0.966 0.021
CSN1S2BP 100337616 4q13.3 0.966 0.021
ODAM 54959 4q13.3 0.966 0.021
FDCSP 260436 4q13.3 0.966 0.021
CSN3 1448 4q13.3 0.966 0.021
CABS1 85438 4q13.3 0.966 0.021
SMR3A 26952 4q13.3 0.966 0.021
SMR3B 10879 4q13.3 0.966 0.021
PROL1 58503 4q13.3 0.966 0.021
MUC7 4589 4q13.3 0.966 0.021
AMTN 401138 4q13.3 0.966 0.021
AMBN 258 4q13.3 0.966 0.021
ENAM 10117 4q13.3 0.966 0.021
IGJ 3512 4q13.3 0.966 0.021
UTP3 57050 4q13.3 0.966 0.021
RUFY3 22902 4q13.3 0.966 0.021
GRSF1 2926 4q13.3 0.966 0.021
MOB1B 92597 4q13.3 0.966 0.021
DCK 1633 4q13.3 0.966 0.021
SLC4A4 8671 4q13.3 0.966 0.021
GC 2638 4q13.3 0.966 0.021
NPFFR2 10886 4q13.3 0.966 0.021
ADAMTS3 9508 4q13.3 0.966 0.021
COX18 285521 4q13.3 0.966 0.021
ANKRD17 26057 4q13.3 0.966 0.021
ALB 213 4q13.3 0.966 0.021
AFP 174 4q13.3 0.966 0.021
AFM 173 4q13.3 0.966 0.021
RASSF6 166824 4q13.3 0.966 0.021
IL8 3576 4q13.3 0.966 0.021
CXCL6 6372 4q13.3 0.966 0.021
CXCL1 2919 4q13.3 0.966 0.021
PF4V1 5197 4q13.3 0.966 0.021
PF4 5196 4q13.3 0.966 0.021
PPBP 5473 4q13.3 0.966 0.021
CXCL5 6374 4q13.3 0.966 0.021
CXCL3 2921 4q13.3 0.966 0.021
PPBPL2 10895 4q13.3 0.966 0.021
CXCL2 2920 4q13.3 0.966 0.021
MTHFD2L 441024 4q13.3 0.966 0.021
EPGN 255324 4q13.3 0.966 0.021
EREG 2069 4q13.3 0.966 0.021
AREG 374 4q13.3 0.966 0.022
BTC 685 4q13.3 0.966 0.022
PARM1 25849 4q13.3 0.966 0.022
RCHY1 25898 4q21.1 0.966 0.022
THAP6 152815 4q21.1 0.966 0.022
Supplementary Table 1. Continued
(continued to the next page)
Gene Symbol Locus ID Cytoband FDR Value P*
C4orf26 152816 4q21.1 0.966 0.022
CDKL2 8999 4q21.1 0.966 0.022
G3BP2 9908 4q21.1 0.966 0.022
USO1 8615 4q21.1 0.966 0.022
PPEF2 5470 4q21.1 0.966 0.022
NAAA 27163 4q21.1 0.966 0.022
SDAD1 55153 4q21.1 0.966 0.022
CXCL9 4283 4q21.1 0.966 0.022
ART3 419 4q21.1 0.966 0.022
CXCL10 3627 4q21.1 0.966 0.022
CXCL11 6373 4q21.1 0.966 0.022
NUP54 53371 4q21.1 0.966 0.022
SCARB2 950 4q21.1 0.966 0.022
FAM47E 100129583 4q21.1 0.966 0.022
STBD1 8987 4q21.1 0.966 0.022
CCDC158 339965 4q21.1 0.966 0.022
SHROOM3 57619 4q21.1 0.966 0.022
SOWAHB 345079 4q21.1 0.966 0.022
CCNI 10983 4q21.1 0.966 0.022
CCNG2 901 4q21.1 0.966 0.022
CXCL13 10563 4q21.1 0.966 0.022
CNOT6L 246175 4q21.1 0.966 0.022
MRPL1 65008 4q21.1 0.966 0.022
FRAS1 80144 4q21.21 0.966 0.022
ANXA3 306 4q21.21 0.966 0.022
BMP2K 55589 4q21.21 0.966 0.022
PAQR3 152559 4q21.21 0.966 0.022
NAA11 84779 4q21.21 0.966 0.022
GK2 2712 4q21.21 0.966 0.022
GDEP 118425 4q21.21 0.966 0.022
ANTXR2 118429 4q21.21 0.966 0.022
PRDM8 56978 4q21.21 0.966 0.022
FGF5 2250 4q21.21 0.966 0.022
C4orf22 255119 4q21.21 0.966 0.022
BMP3 651 4q21.21 0.966 0.022
PRKG2 5593 4q21.21 0.966 0.022
RASGEF1B 153020 4q21.21 0.966 0.022
HNRNPD 3184 4q21.22 0.966 0.022
HNRPDL 9987 4q21.22 0.966 0.022
NANP 140838 20p11.21 0.966 0.022
ZNF337 26152 20p11.1 0.966 0.022
FAM182A 284800 20p11.1 0.966 0.022
FAM182B 728882 20p11.1 0.966 0.022
NCOR1P1 149934 20p11.1 0.966 0.022
EXD1 161829 15q15.1 0.966 0.023
CHP 11261 15q15.1 0.966 0.023
OIP5 11339 15q15.1 0.966 0.023
NUSAP1 51203 15q15.1 0.966 0.023
POU1F1 5449 3p11.2 0.966 0.023
HTR1F 3355 3p11.1 0.966 0.023
CGGBP1 8545 3p11.1 0.966 0.023
C3orf38 285237 3p11.1 0.966 0.023
ZNF654 55279 3p11.1 0.966 0.023
EPHA3 2042 3p11.1 0.966 0.023
SRP14 6727 15q15.1 0.966 0.026
PLA2G4E 123745 15q15.1 0.966 0.026
Supplementary Table 1. Continued
(continued to the next)
Supplementary Table 1. Continued
Gene Symbol Locus ID Cytoband FDR Value P*
DCUN1D4 23142 4q12 0.966 0.027
LRRC66 339977 4q12 0.966 0.027
SGCB 6443 4q12 0.966 0.027
SPATA18 132671 4q12 0.966 0.027
IPO9 55705 1q32.1 0.966 0.028
LMOD1 25802 1q32.1 0.966 0.028
SHISA4 149345 1q32.1 0.966 0.028
RNPEP 6051 1q32.1 0.966 0.028
TIMM17A 10440 1q32.1 0.966 0.028
ELF3 1999 1q32.1 0.966 0.028
GPR37L1 9283 1q32.1 0.966 0.028
ARL8A 127829 1q32.1 0.966 0.028
PTPN7 5778 1q32.1 0.966 0.028
LGR6 59352 1q32.1 0.966 0.028
PTPRVP 148713 1q32.1 0.966 0.028
C4orf32 132720 4q25 0.966 0.030
AP1AR 55435 4q25 0.966 0.030
TIFA 92610 4q25 0.966 0.030
ALPK1 80216 4q25 0.966 0.030
NEUROG2 63973 4q25 0.966 0.030
C4orf21 55345 4q25 0.966 0.030
LARP7 51574 4q25 0.966 0.030
ANK2 287 4q25 0.966 0.030
FAM91A2 57234 1q21.2 0.966 0.030
FCGR1A 2209 1q21.2 0.966 0.030
FCGR1C 100132417 1q21.2 0.966 0.030
HIST2H2BF 440689 1q21.2 0.966 0.030
HIST2H3D 653604 1q21.2 0.966 0.030
ASNS 440 7q21.3 0.966 0.033
MGC72080 389538 7q21.3 0.966 0.033
OCM2 4951 7q21.3 0.966 0.033
NPR1 4881 1q21.3 0.966 0.034
INTS3 65123 1q21.3 0.966 0.034
SLC27A3 11000 1q21.3 0.966 0.034
GATAD2B 57459 1q21.3 0.966 0.034
DENND4B 9909 1q21.3 0.966 0.034
CRTC2 200186 1q21.3 0.966 0.034
SLC39A1 27173 1q21.3 0.966 0.034
CREB3L4 148327 1q21.3 0.966 0.034
JTB 10899 1q21.3 0.966 0.034
RAB13 5872 1q21.3 0.966 0.034
RPS27 6232 1q21.3 0.966 0.034
NUP210L 91181 1q21.3 0.966 0.034
TPM3 7170 1q21.3 0.966 0.034
C1orf189 388701 1q21.3 0.966 0.034
C1orf43 25912 1q21.3 0.966 0.034
UBAP2L 9898 1q21.3 0.966 0.034
HAX1 10456 1q21.3 0.966 0.034
AQP10 89872 1q21.3 0.966 0.034
ATP8B2 57198 1q21.3 0.966 0.034
IL6R 3570 1q21.3 0.966 0.034
SHE 126669 1q21.3 0.966 0.034
TDRD10 126668 1q21.3 0.966 0.034
UBE2Q1 55585 1q21.3 0.966 0.034
CHRNB2 1141 1q21.3 0.966 0.034
ADAR 103 1q21.3 0.966 0.034
(continued to the next page)
Supplementary Table 1. Continued
Gene Symbol Locus ID Cytoband FDR Value P*
KCNN3 3782 1q21.3 0.966 0.034
PMVK 10654 1q21.3 0.966 0.034
PBXIP1 57326 1q21.3 0.966 0.034
PYGO2 90780 1q21.3 0.966 0.034
SHC1 6464 1q21.3 0.966 0.034
CKS1B 1163 1q21.3 0.966 0.034
FLAD1 80308 1q21.3 0.966 0.034
LENEP 55891 1q21.3 0.966 0.034
ZBTB7B 51043 1q21.3 0.966 0.034
DCST2 127579 1q21.3 0.966 0.034
DCST1 149095 1q22 0.966 0.034
ADAM15 8751 1q22 0.966 0.034
EFNA4 1945 1q22 0.966 0.034
EFNA3 1944 1q22 0.966 0.034
EFNA1 1942 1q22 0.966 0.034
SLC50A1 55974 1q22 0.966 0.034
DPM3 54344 1q22 0.966 0.034
KRTCAP2 200185 1q22 0.966 0.034
TRIM46 80128 1q22 0.966 0.034
THBS3 7059 1q22 0.966 0.034
MTX1 4580 1q22 0.966 0.034
FAM189B 10712 1q22 0.966 0.034
GBAP1 2630 1q22 0.966 0.034
GBA 2629 1q22 0.966 0.034
SCAMP3 10067 1q22 0.966 0.034
CLK2 1196 1q22 0.966 0.034
FDPS 2224 1q22 0.966 0.034
PKLR 5313 1q22 0.966 0.034
RUSC1 23623 1q22 0.966 0.034
ASH1L 55870 1q22 0.966 0.034
POU5F1P4 645682 1q22 0.966 0.034
MSTO1 55154 1q22 0.966 0.034
DAP3 7818 1q22 0.966 0.034
YY1AP1 55249 1q22 0.966 0.034
GON4L 54856 1q22 0.966 0.034
MSTO2P 100129405 1q22 0.966 0.034
SYT11 23208 1q22 0.966 0.034
RIT1 6016 1q22 0.966 0.034
SNORA42 677823 1q22 0.966 0.034
SCARNA4 677771 1q22 0.966 0.034
RXFP4 339403 1q22 0.966 0.034
ARHGEF2 9181 1q22 0.966 0.034
SSR2 6746 1q22 0.966 0.034
UBQLN4 56893 1q22 0.966 0.034
LAMTOR2 28956 1q22 0.966 0.034
MEX3A 92312 1q22 0.966 0.034
LMNA 4000 1q22 0.966 0.034
SEMA4A 64218 1q22 0.966 0.034
PMF1 11243 1q22 0.966 0.034
SLC25A44 9673 1q22 0.966 0.034
BGLAP 632 1q22 0.966 0.034
PAQR6 79957 1q22 0.966 0.034
SMG5 23381 1q22 0.966 0.034
C1orf85 112770 1q22 0.966 0.034
CCT3 7203 1q22 0.966 0.034
VHLL 391104 1q22 0.966 0.034
(continued to the next)
Gene Symbol Locus ID Cytoband FDR Value P*
C1orf182 128229 1q22 0.966 0.034
RHBG 57127 1q22 0.966 0.034
NES 10763 1q23.1 0.966 0.034
CRABP2 1382 1q23.1 0.966 0.034
ISG20L2 81875 1q23.1 0.966 0.034
RRNAD1 51093 1q23.1 0.966 0.034
MRPL24 79590 1q23.1 0.966 0.034
HDGF 3068 1q23.1 0.966 0.034
PRCC 5546 1q23.1 0.966 0.034
SH2D2A 9047 1q23.1 0.966 0.034
NTRK1 4914 1q23.1 0.966 0.034
LRRC71 149499 1q23.1 0.966 0.034
PEAR1 375033 1q23.1 0.966 0.034
ARHGEF11 9826 1q23.1 0.966 0.034
ZNF678 339500 1q42.13 0.966 0.034
ZNF847P 401983 1q42.13 0.966 0.034
JMJD4 65094 1q42.13 0.966 0.034
SNAP47 116841 1q42.13 0.966 0.034
PRSS38 339501 1q42.13 0.966 0.034
WNT3A 89780 1q42.13 0.966 0.034
ARF1 375 1q42.13 0.966 0.034
C1orf35 79169 1q42.13 0.966 0.034
MRPL55 128308 1q42.13 0.966 0.034
GUK1 2987 1q42.13 0.966 0.034
GJC2 57165 1q42.13 0.966 0.034
IBA57 200205 1q42.13 0.966 0.034
OBSCN 84033 1q42.13 0.966 0.034
TRIM17 51127 1q42.13 0.966 0.034
HIST3H3 8290 1q42.13 0.966 0.034
HIST3H2A 92815 1q42.13 0.966 0.034
HIST3H2BB 128312 1q42.13 0.966 0.034
DUSP5P 574029 1q42.13 0.966 0.034
RHOU 58480 1q42.13 0.966 0.034
RNF187 149603 1q42.13 0.966 0.034
USP46 64854 4q12 0.966 0.035
SNORA26 677810 4q12 0.966 0.035
RASL11B 65997 4q12 0.966 0.035
SCFD2 152579 4q12 0.966 0.035
FIP1L1 81608 4q12 0.966 0.035
LNX1 84708 4q12 0.966 0.035
RPL21P44 402176 4q12 0.966 0.035
CHIC2 26511 4q12 0.966 0.035
GSX2 170825 4q12 0.966 0.035
PDGFRA 5156 4q12 0.966 0.035
KIT 3815 4q12 0.966 0.035
KDR 3791 4q12 0.966 0.035
SRD5A3 79644 4q12 0.966 0.035
TMEM165 55858 4q12 0.966 0.035
PDCL2 132954 4q12 0.966 0.035
KLHL8 57563 4q22.1 0.966 0.035
HSD17B13 345275 4q22.1 0.966 0.035
HSD17B11 51170 4q22.1 0.966 0.035
NUDT9 53343 4q22.1 0.966 0.035
SPARCL1 8404 4q22.1 0.966 0.035
DSPP 1834 4q22.1 0.966 0.035
DMP1 1758 4q22.1 0.966 0.035
Supplementary Table 1. Continued
(continued to the next page)
Gene Symbol Locus ID Cytoband FDR Value P*
IBSP 3381 4q22.1 0.966 0.035
MEPE 56955 4q22.1 0.966 0.035
HSP90AB3P 3327 4q22.1 0.966 0.035
OR8U8 504189 11q12.1 0.966 0.035
OR9G1 390174 11q12.1 0.966 0.035
OR9G4 283189 11q12.1 0.966 0.035
OR9G9 504191 11q12.1 0.966 0.035
UBE2T 29089 1q32.1 0.966 0.036
PPP1R12B 4660 1q32.1 0.966 0.036
SYT2 127833 1q32.1 0.966 0.036
KDM5B 10765 1q32.1 0.966 0.036
RABIF 5877 1q32.1 0.966 0.036
KLHL12 59349 1q32.1 0.966 0.036
ADIPOR1 51094 1q32.1 0.966 0.036
CYB5R1 51706 1q32.1 0.966 0.036
MYOG 4656 1q32.1 0.966 0.036
PPFIA4 8497 1q32.1 0.966 0.036
ADORA1 134 1q32.1 0.966 0.036
MYBPH 4608 1q32.1 0.966 0.036
CHI3L1 1116 1q32.1 0.966 0.036
CHIT1 1118 1q32.1 0.966 0.036
BTG2 7832 1q32.1 0.966 0.036
FMOD 2331 1q32.1 0.966 0.036
PRELP 5549 1q32.1 0.966 0.036
OPTC 26254 1q32.1 0.966 0.036
ATP2B4 493 1q32.1 0.966 0.036
LINC00260 84719 1q32.1 0.966 0.036
SNORA77 677843 1q32.1 0.966 0.036
LAX1 54900 1q32.1 0.966 0.036
ZBED6 100381270 1q32.1 0.966 0.036
ZC3H11A 9877 1q32.1 0.966 0.036
SNRPE 6635 1q32.1 0.966 0.036
LINC00303 284573 1q32.1 0.966 0.036
SOX13 9580 1q32.1 0.966 0.036
GAB2 9846 11q14.1 0.966 0.039
CA14 23632 1q21.2 0.966 0.040
APH1A 51107 1q21.2 0.966 0.040
MRPS21 54460 1q21.2 0.966 0.040
PRPF3 9129 1q21.2 0.966 0.040
RPRD2 23248 1q21.3 0.966 0.040
CAMK2D 817 4q26 0.966 0.041
ARSJ 79642 4q26 0.966 0.041
UGT8 7368 4q26 0.966 0.041
NDST4 64579 4q26 0.966 0.041
TRRAP 8295 7q22.1 0.966 0.042
SMURF1 57154 7q22.1 0.966 0.042
KPNA7 402569 7q22.1 0.966 0.042
MYH16 84176 7q22.1 0.966 0.042
ENOPH1 58478 4q21.22 0.966 0.043
C4orf11 439934 4q21.22 0.966 0.043
SCD5 79966 4q21.22 0.966 0.043
SEC31A 22872 4q21.22 0.966 0.043
THAP9 79725 4q21.22 0.966 0.043
LIN54 132660 4q21.22 0.966 0.043
COPS4 51138 4q21.22 0.966 0.043
PLAC8 51316 4q21.22 0.966 0.043
Supplementary Table 1. Continued
(continued to the next)
Gene Symbol Locus ID Cytoband FDR Value P*
COQ2 27235 4q21.23 0.966 0.043
HPSE 10855 4q21.23 0.966 0.043
HELQ 113510 4q21.23 0.966 0.043
MRPS18C 51023 4q21.23 0.966 0.043
FAM175A 84142 4q21.23 0.966 0.043
AGPAT9 84803 4q21.23 0.966 0.043
CDS1 1040 4q21.23 0.966 0.043
WDFY3 23001 4q21.23 0.966 0.043
ARHGAP24 83478 4q21.23 0.966 0.043
MAPK10 5602 4q21.3 0.966 0.043
PTPN13 5783 4q21.3 0.966 0.043
SLC10A6 345274 4q21.3 0.966 0.043
C4orf36 132989 4q21.3 0.966 0.043
AFF1 4299 4q21.3 0.966 0.043
COL4A1 1282 13q34 0.966 0.043
COL4A2 1284 13q34 0.966 0.043
RAB20 55647 13q34 0.966 0.043
CARKD 55739 13q34 0.966 0.043
CARS2 79587 13q34 0.966 0.043
ING1 3621 13q34 0.966 0.043
LINC00346 283487 13q34 0.966 0.043
ANKRD10 55608 13q34 0.966 0.043
ARHGEF7 8874 13q34 0.966 0.043
TEX29 121793 13q34 0.966 0.043
SOX1 6656 13q34 0.966 0.043
SPACA7 122258 13q34 0.966 0.043
TUBGCP3 10426 13q34 0.966 0.043
C13orf35 400165 13q34 0.966 0.043
GNAI1 2770 7q21.11 0.966 0.045
GNAT3 346562 7q21.11 0.966 0.045
CD36 948 7q21.11 0.966 0.045
SEMA3C 10512 7q21.11 0.966 0.045
HCN1 348980 5p12 0.966 0.045
PAX1 5075 20p11.22 0.966 0.049
FOXA2 3170 20p11.21 0.966 0.049
FDR = False Discovery Rate.
*Student's t-test for groups with continuous outcomes; Fisher's exact test for cate- gorical outcomes.
Supplementary Table 1. Continued