Received: May 27, 2015 Revised: June 11, 2015 Accepted: June 13, 2015.
Corresponding author: DaeHyun Kim
Department of Family Medicine, Keimyung University College of Medicine, 56 Dalsung-ro, Jung-gu, Daegu 700-712, Korea Tel: +82-53-250-7607, Fax: +82-53-250-7071, E-mail: [email protected]
The study was performed by using the Korean Longitudinal Study on Aging (KLoSA) data from Labor Institute of Korea.
Copyright Ⓒ 2015 The Korean Academy of Clinical Geriatrics
This is an open access article distributed under the term s of the Creative Com m ons Attribution Non-Com m ercial License (http://creativecom m ons.org/ licenses/by-nc/4.0) which perm its unrestricted non-com m ercial use, distribution, and reproduction in any m edium , provided the original work is properly cited.
한국 노인에서 인지기능 감소와 관련된 요인
김대현
1
, 이재혁1
, Hedenori Arai2
, 김성희3
1계명대학교 의과대학 가정의학교실, 2일본 국립장수의료연구센타, 3대구가톨릭대학교 의과대학 가정의학교실
Factors Related with Cognitive Frailty in Korean Elderly
DaeHyun Kim
1, JaeHyuck Lee
1, Hidenori Arai
2, SungHee Kim
31
Department of Family Medicine, Keimyung University College of Medicine, Daegu, Korea,
2National Center for Geriatrics and Gerontology, Obu, Aichi, Japan,
3Department of Family Medicine, Catholic University of Daegu, School of Medicine, Daegu, Korea
Background: Cognitive impairment is important in clinical geriatrics as a mental frailty. The objective of this study was to investigate the factors related with cognitive impairment in Korean elderly.
Methods: We analyzed data from the Korean Longitudinal Study on Aging (KLoSA). A total of 4,165 Korean community-dwell- ing elderly (>65 years, male/female 1,739/2,426) at the first wave (2006) of KLoSA were used for analysis. Cognitive function was assessed with the Mini-Mental State Examination Korean version (MMSE-K) through personal interviews by a trained interviewer with Computer Assisted Personal Interviewing (CAPI). Multiple logistic regression analysis was performed among participants to estimate the odd ratios (OR) and 95% confidence interval (CI) for MMSE score<23.
These estimates were controlled for age, sex, education, MMSE score at baseline, alcohol consumption, current smoking, body mass index and disease history.
Results: 2,120 subjects (50.9%) were classified as cognitive impaired (MMSE score<23). Age, sex, depression score (CESD-10), function (ADL, IADL), education, employment, income, smoking, drinking and BMI was significantly different between normal and impaired cognitive groups. Cognitive impairment ratio after covariates the female was 2.16 (1.63∼
2.86), age 70∼74, 75∼79, ≥80 were 3.51 (2.05∼5.99), 2.24 (1.55∼3.24), 1.87 (1.39∼2.52) low (elementary and no) education groups were 2.77 (1.99∼3.84) and 8.18 (5.66∼11.82) compare to more educated group (≥9 years).
Among health related factors, only ADL and IADL was significantly different after multivariates adjustment. Among social activities, number of meeting with friendly people volunteer group activity were significant factors.
Conclusion: Age, sex, depression score (CESD-10), fuction (ADL, IADL), education, ADL, IADL personal and group social activities were significantly related with cognitive decline in Korean elderly.
Key Words: Frailty, Cognitive frailty, Elderly
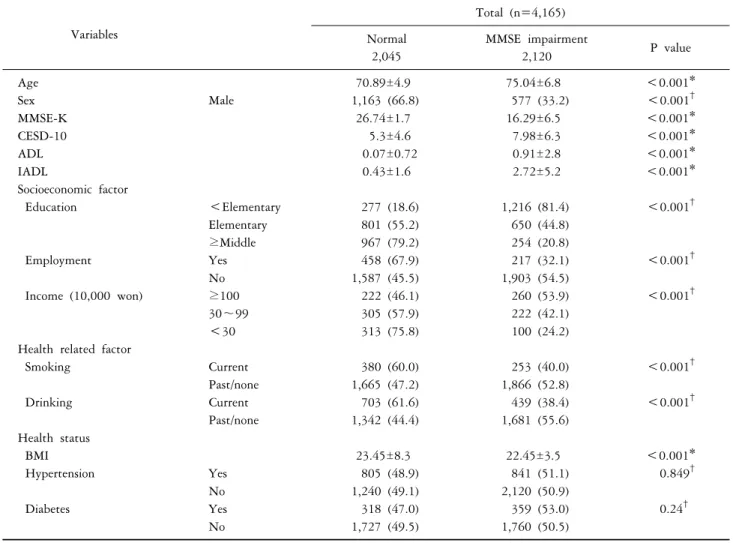
Table 1. General characteristics of normal and impaired cognitive group
Variables
Total (n=4,165) Normal
2,045
MMSE impairment
2,120 P value
Age 70.89±4.9 75.04±6.8 <0.001*
Sex Male 1,163 (66.8) 577 (33.2) <0.001
†MMSE-K 26.74±1.7 16.29±6.5 <0.001*
CESD-10 5.3±4.6 7.98±6.3 <0.001*
ADL 0.07±0.72 0.91±2.8 <0.001*
IADL 0.43±1.6 2.72±5.2 <0.001*
Socioeconomic factor
Education <Elementary 277 (18.6) 1,216 (81.4) <0.001
†Elementary 801 (55.2) 650 (44.8)
≥Middle 967 (79.2) 254 (20.8)
Employment Yes 458 (67.9) 217 (32.1) <0.001
†No 1,587 (45.5) 1,903 (54.5)
Income (10,000 won) ≥100 222 (46.1) 260 (53.9) <0.001
†30∼99 305 (57.9) 222 (42.1)
<30 313 (75.8) 100 (24.2)
Health related factor
Smoking Current 380 (60.0) 253 (40.0) <0.001
†Past/none 1,665 (47.2) 1,866 (52.8)
Drinking Current 703 (61.6) 439 (38.4) <0.001
†Past/none 1,342 (44.4) 1,681 (55.6)
Health status
BMI 23.45±8.3 22.45±3.5 <0.001*
Hypertension Yes 805 (48.9) 841 (51.1) 0.849
†No 1,240 (49.1) 2,120 (50.9)
Diabetes Yes 318 (47.0) 359 (53.0) 0.24
†No 1,727 (49.5) 1,760 (50.5)
Values were presented as mean±SD or n (%). MMSE: mini-mental status examination, CESD: center for epidemiologic studies short depression scale, ADL: activities of daily living, IADL: instrumental activities of daily living. *Analyzed by t-test.
†Analyzed by chi-square
INTRODUCTION
Approximately 35.6 million people worldwide (estimated in 2010) and 600 thousand Koreans suffer from dementia (estimated in 2012), with the prevalence among the elderly nearly doubling every five years, from approximately 1.5 per- cent among 60∼69 year olds to 40 percent among 80∼89 year olds.1,2) Research has suggested that cognitive decline and dementia are associated with many factors, including genetic factors, comorbidities, physical and social activities, diet and smoking.3)
Frailty is a losses of human functioning (physical, men- tal/cognitive, social) which increases the risk of adverse out- comes,4) and cognitive impairment is important aspect of
mental frailty.5,6) Compare to physical and cognitive factors, social factors were not studied and included in the assess- ment of frailty. It has been proposed that social factors, in- cluding social network ratings, leisure time physical activity, inactivity and physical/ social activity influence to cognitive function through the epigenetic and disease morbidity. Re- search on the physical and social activity show to prevent cognitive decline and dementia.7)
The objective of the study was to investigate the factors associated with cognitive frailty in Korean elderly.
Table 2. Cognitive impairment ratios according to socioeconomic factors
Variables Model 1 Model 2 Model 3
Sex Women 3.52 (3.09∼4.01) 1.78 (1.52∼2.07) 2.16 (1.63∼2.86)
Men 1 1 1
P value <0.001 <0.001 <0.001
Age ≥80 7.64 (6.14∼9.50) 5.27 (4.11∼6.75) 3.51 (2.05∼5.99)
75∼79 3.00 (2.52∼3.58) 2.38 (1.95∼2.90) 2.24 (1.55∼3.24) 70∼74 1.76 (1.51∼2.06) 1.71 (1.43∼2.04) 1.87 (1.39∼2.52)
65∼69 1 1 1
P value <0.001 <0.001 <0.001
Education (y) 0 16.71 (13.82∼20.21) 9.56 (7.78∼11.75) 8.18 (5.66∼11.82)
6 3.08 (2.60∼3.67) 2.47 (2.05∼2.96) 2.77 (1.99∼3.84)
≥6 1 1 1
P value <0.001 <0.001 <0.001
Work No 3.03 (2.66∼3.40) 1.52 (1.23∼1.86) 1.28 (0.96∼1.70)
Yes 1 1 1
P value <0.001 <0.001 0.088
Living with spouse No 3.03 (2.66∼3.40) 1.08 (0.91∼1.29) 1.12 (0.80∼1.57)
Yes 1 1 1
P value <0.001 0.36 0.518
Residential district Urban 1.58 (1.36∼1.83) 1.15 (0.96∼1.38) 1.10 (1.03∼1.91)
City 1.19 (1.03∼1.38) 1.22 (1.03∼1.46) 1.27 (0.89∼1.81)
Metropolitan 1 1 1
P value <0.001 0.064 0.099
Income (10,000 won) ≥0, <30 3.67 (2.75∼4.89) 1.50 (1.08∼2.10) 1.36 (0.95∼1.93)
≥30, <100 1.60 (1.25∼2.06) 1.15 (0.83∼1.60) 1.05 (0.75∼1.48)
≥100 1 1 1
P value <0.001 0.04 0.140
Model 1: raw, Model 2: adjusted for age, sex, education, Model 3: adjusted for age, sex, education, Income, CESD-10, ADL, IADL.
MATERIALS AND METHODS
1. Participants
Data for this survey were collected from the Korean Longitudinal Study on Aging (KLoSA). In this project, the normal aging process has been assessed over time using de- tailed questionnaires, socioeconomic factors, frailty related fac- tors (activities of daily living (ADL), instrumental ADL (IADL), grip strength, depression score) and medical history. Partici- pants in the KLoSA included randomly selected age- and sex-stratified individuals from Korea. The first wave of the KLoSA was conducted in 2006 and comprised 10,254 par- ticipants (4,460) men, 5,794 women; age range, 40∼79 years). Details of the KLoSA study have been reported else- where.8)
Exclusion criteria were as follows: (1) those who were
<65 years (n=6,099), as cognitive function tested by the
Mini-Mental State Examination (MMSE); and (3) those who did not complete either the MMSE assessments or the self- reported questionnaire (n=721). A total of 4,165 Korean community-dwelling elderly (>65 years, male/female 1,739/
2,426) who had been between 65 and 79 years in the first wave of the KLoSA were available for analysis.
2. Assessment of cognitive function
Cognitive function was assessed by the Korean version of the MMSE-K through interviews with a trained interviewer with Computer Assisted Personal Interview (CAPI). The MMSE is widely used as a brief screening test for dementia, and scores range from 0 to 30 points, which was validated in Korean.9) The MMSE includes questions on orientation of time and place, registration, attention and calculation, recall, language and visual construction. We used cutoff scores of
<23, which is traditionally used to represent ‘suggestive
Table 3. Cognitive impairment ratios according to health related factors
Variables Model 1 Model 2 Model 3
Alcohol No 2.01 (1.75∼2.31) 1.05 (0.87∼1.26) 1.05 (0.72∼1.52)
Yes 1 1 1
P value <0.001 0.633 0.813
Smoking Yes 1.68 (1.42∼2.00) 1.01 (0.81∼1.26) 0.83 (0.60∼1.17)
No 1 1 1
P value <0.001 0.931 0.287
Exercise (≥1/week)
No 3.20 (2.78∼3.67) 1.68 (1.43∼1.97) 1.31 (0.97∼1.76)
Yes 1 1 1
P value <0.001 <0.001 0.077
Obesity degree Underweight 2.24 (1.74∼2.88) 1.23 (0.92∼1.66) 0.90 (0.53∼1.54) Normal 1.46 (1.14∼1.87) 1.21 (1.04∼1.42) 0.94 (0.71∼1.24)
Obese 1 1 1
P value <0.001 0.039 0.875
Depression (CESD-10)
Yes 2.44 (2.15∼2.77) 1.64 (1.42∼1.90) 1.22 (0.93∼1.58)
No 1 1 1
P value <0.001 <0.001 0.147
ADL Dependent 7.65 (5.66∼1034) 6.82 (4.75∼9.80) 3.03 (1.11∼8.29)
Independent 1 1 1
P value <0.001 <0.001 0.022
IADL Dependant 3.71 (3.17∼4.34) 2.82 (2.33∼3.41) 1.54 (1.06∼2.24)
Independent 1 1 1
P value <0.001 <0.001 0.023
Admission in proceeding year
Yes 1.534 (1.29∼1.84) 1.52 (1.23∼1.87) 1.13 (0.78∼1.65)
No 1 1 1
P value <0.001 <0.001 0.523
HTN Yes 0.99 (0.87∼1.12) 1.04 (0.89∼1.20) 0.87 (0.66∼1.15)
No 1 1 1
P value 0.84 0.64 0.325
Diabetes Yes 0.90 (0.77∼1.06) 1.28 (1.06∼1.56) 1.05 (0.72∼1.52)
No 1 1 1
P value 0.224 0.012 0.813
cognitive impairment’.10)
3. Social factors assessments
Socioeconomic status were assessed in the aspects of pop- ulation, family, education (<9, 10∼12 or >13 years of school), income (yes or no), employment (yes or no), mar- riage, religion,
Health behaviors were assessed with subjective health.
smoking status (current, past, none), exercise and drinking.
Chronic disease history of heart disease, hypertension, dia- betes, cancer, lung disease, liver, stroke, mental disease, ar- thritis, prostate disease were collected with personal Interview.
4. Statistical analysis
All statistical analyses were conducted using statistical analysis system software version 20.0 (SPSS Institute, Cary, NC, USA). General characteristic were compared by t-test for continuous variables, and X2 test for nominal variables.
Odd ratios for cognitive decline were analyzed by multiple logistic regression, compare to normal cognitive non-decline.
The covariates were age (year, continuous), sex, education (<9, 10∼12, >13 years), employment, CESD-10, IADL, weight loss. (Model 1=crude: Model 2=adjusted by age, sex, education: Model 3=age, sex, education, employment, CESD-10, IADL, weight loss). All reported P values are two-sided, and a P value o 0.05 was considered significant.
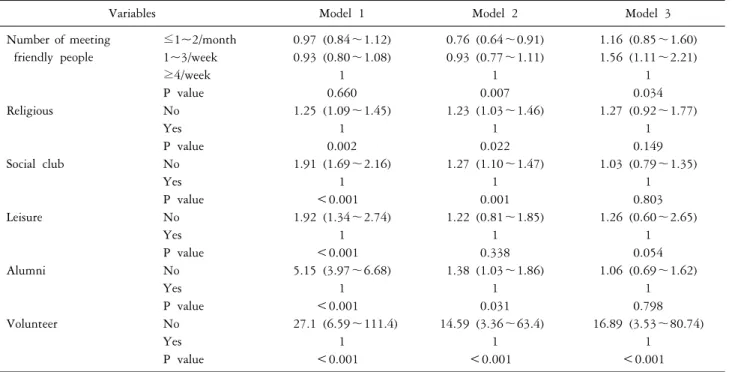
Table 4. Cognitive impairment ratio according to social activities
Variables Model 1 Model 2 Model 3
Number of meeting friendly people
≤1~2/month 0.97 (0.84∼1.12) 0.76 (0.64∼0.91) 1.16 (0.85∼1.60) 1~3/week 0.93 (0.80∼1.08) 0.93 (0.77∼1.11) 1.56 (1.11∼2.21)
≥4/week 1 1 1
P value 0.660 0.007 0.034
Religious No 1.25 (1.09∼1.45) 1.23 (1.03∼1.46) 1.27 (0.92∼1.77)
Yes 1 1 1
P value 0.002 0.022 0.149
Social club No 1.91 (1.69∼2.16) 1.27 (1.10∼1.47) 1.03 (0.79∼1.35)
Yes 1 1 1
P value <0.001 0.001 0.803
Leisure No 1.92 (1.34∼2.74) 1.22 (0.81∼1.85) 1.26 (0.60∼2.65)
Yes 1 1 1
P value <0.001 0.338 0.054
Alumni No 5.15 (3.97∼6.68) 1.38 (1.03∼1.86) 1.06 (0.69∼1.62)
Yes 1 1 1
P value <0.001 0.031 0.798
Volunteer No 27.1 (6.59∼111.4) 14.59 (3.36∼63.4) 16.89 (3.53∼80.74)
Yes 1 1 1
P value <0.001 <0.001 <0.001
Model 1: raw, Model 2: adjusted for age, sex, education, Model 3: adjusted for age, sex, education, Income, CESD-10, ADL, IADL.
RESULTS
Baseline characteristics of 4,165 Korean community-dwell- ing elderly (>65 years, male/female 1,739/2,426) ware ana- lyzed (Table 1). 2,120 subjects (50.9%) were classified as cognitive impaired(MMSE score <23). Between normal and impaired cognitive group, age, sex, depression score (CESD- 10), daily fuction (ADL, IADL), education, employment, in- come was significantly different. Among health related fac- tors, smoking, drinking and BMI was significantly different between normal and impaired cognitive groups.
Table 2 show that cognitive impairment ratio according to socioeconomic factors after covariates (age, sex, education, employment, CESD-10, IADL, weight loss) were controlled.
The multivariate-adjusted odd ratios (ORs) (95% CIs) for the female was 2.16 (1.63∼2.86), for age 70∼74, 75∼79,
≥80 were 3.51 (2.05∼5.99), 2.24 (1.55∼3.24), 1.87 (1.39∼
2.52) compare to 65∼69 years old group. In education, cognitive impairment ratio of elementary graduates and no education groups were 2.77 (1.99∼3.84) and 8.18 (5.66∼
11.82) compare to more educated group (≥9 years).
Among health related factors, only ADL and IADL was
significantly different after adjustment of multivariates (Model 3=age, sex, education, employment, Center for Epidemiologic Studies-Depression (CES-D-10), IADL, weight loss) (Table 3).
Among social activities, less (1~3/week) number of meeting with friendly people group have significantly higher multi- variate-adjusted odd ratios (95% CIs) for 1.56 (1.11~2.21) compare to more (≥4/week) group, and odd ratios (95%
CIs) no volunteer activity group was 16.89 (3.53∼80.74) compare to activity group (Table 4).
DISCUSSION
Frailty is a dynamic state affecting an individual who ex- periences losses in one or more domains of human function- ing (physical, mental, social) that are caused by the influ- ence of a range of variables and which increases the risk of adverse outcomes. Physical, mental and social domain is contribute to increase frailty independently or interact toge- ther.10) Among many frailty assessment scales some scales (ex. Fried, Indexes for prediction of falls and fractures, FRAIL, Korean Frailty Scale) have no social activities assess- ment item, and several (Edmonton, Groningen, Tilburg,
Kihon Checklist) have social activities assessment item (s).11-17) Between normal and impaired cognitive group, age, sex, depression score (CESD-10), daily function (ADL, IADL), education, employment, income smoking, drinking and BMI was significantly different.
Cognitive impairment ratio according to socioeconomic factors after adjusting covariates (age, sex, education, em- ployment, CESD-10, IADL, weight loss) odd ratios (ORs) (95% CIs) for the sex (female) and age (older), education, ADL and IADL was significantly different.
Among social activities, less number of meeting with friendly people group and no volunteer activity group have significantly higher ratios for cognitive decline.
In The Korean Longitudinal Study on Aging (KLoSA) data, age, sex, depression score (CESD-10), function (ADL, IADL), education, ADL, IADL personal and group social ac- tivities were significantly related with cognitive decline. Fac- tors related with cognitive decline need to be clarified with prospective follow up data.