망막앞막 수술 후 초기 황반 오목의 회복과 장기 시력예후의 관계
Early Foveal Pit Contour Recovery after Idiopathic Epiretinal Membrane Surgery as a Long-term Postoperative Visual Prognosis Factor
임준현1, 한용섭2,3, 임형빈4, 이상준1, 남기엽3
Jun Hyun Lim1, Yong Seop Han2,3, Hyoung Bin Lim4, Sang Joon Lee1, Ki Yup Nam3
1고신대학교 의과대학 안과학교실, 2경상대학교 의과대학 안과학교실, 3창원경상대학교병원 안과, 4충남대학교병원 안과
1Department of Ophthalmology, Kosin University College of Medicine, Busan, Korea
2Department of Ophthalmology, Gyeonsang National University College of Medicine, Jinju, Korea
3Department of Ophthalmology, Gyeonsang National University Changwon Hospital, Changwon, Korea
4Department of Ophthalmology, Chungnam National University Hospital, Daejeon, Korea
Purpose: We investigated correlations between early foveal contour recovery after idiopathic epiretinal membrane (iERM) surgery and visual improvement.
Methods: We retrospectively reviewed the medical records of patients who had iERM surgery between June 2015 and June 2017. The patients were sorted into two groups (recovery and non-recovery groups) according to foveal changes within 1 month of surgery. We compared the best-corrected visual acuity (logarithm of the minimum angle of resolution) and central macular thickness (CMT) and their changes from the pre-operative state at 1, 2, 3, 6, and 12 months after surgery for the two groups. The pre-operative optical coherence tomography and fluorescein angiography features were also compared.
Results: A total of 43 patients were enrolled. There were 16 patients in the recovery group, and 27 patients in the non-recovery group.
There was greater visual improvement in the recovery group at all time points compared to that in the non-recovery group. The differ- ences were statistically significant at post-operative 2, 6, and 12 months (p = 0.036, p = 0.023, and p = 0.008, respectively). In addition, there were a significantly larger CMT reductions in the recovery group at all time points compared to that in the non-recovery group (p = 0.006, p = 0.010, p < 0.001, p = 0.010, and p = 0.015, respectively). Pre-operative inner retinal thickening on optical coherence to- mography was significantly associated with foveal contour recovery.
Conclusions: During one year of follow-up, better visual improvement was observed in patients with early foveal pit contour recovery after iERM surgery.
Keywords: Epiretinal membrane; Fovea; Visual prognosis; Vitrectomy
Address reprint requests to Ki Yup Nam, MD
Department of Ophthalmology, Gyeonsang National University Changwon Hospital, #11 Samjeongja-ro, Seong- san-gu, Changwon 51472, Korea
Tel: 82-55-214-2819, Fax: 82-55-214-3257 E-mail: [email protected]
Received: 2019. 12. 13 Revised: 2020. 1. 5 Accepted: 2020. 1. 14
Introduction
Idiopathic epiretinal membrane (iERM) is a disease in which the fibrocellular proliferative membrane on the inner retinal surface causes symptoms such as visual loss and metamorphopsia [1,2]. Vitrectomy and epiretinal membrane (ERM) removal, with or without internal limiting membrane (ILM) peeling, are treatment options for iERM [3,4]. In ap- proximately 70-90% of patients, surgery is successful, and the visual acuity (VA) improves. However, some patients show no improvement, or even a decrease in their post-oper- ative VA [5-7]. Many studies have therefore investigated var- ious factors that may predict the visual prognoses of patients after ERM surgery. Some of these factors include pre-oper- ative VA, symptom duration, and the pre-operative status of the retinal layer [7-15].
Spectral domain optical coherence tomography (SD-OCT), which can detect minute retinal layer abnormalities, is a use- ful tool for evaluation of the ERM. There are several factors that can be evaluated using OCT that serve as good prog- nostic indicators of vision or metamorphopsia after ERM surgery [1,2,7-11,16-18]. These factors include central retinal thickness, disruption of the inner segment outer segment (IS/OS) junction of the photoreceptors, inner nuclear layer (INL) thickening, and some calculated indices based on the thickness or length of the inner retinal layers. In addition, post-operative restoration of the foveal inner retinal config- uration has been reported as an indicator of the 1-year visual prognosis [19]. However, for analyses of these factors, time domain OCT is not appropriate, so SD-OCT is necessary for the determination of fine changes in the retinal layers and in the calculation of indices.
Among the patients who had ERM surgery, some showed definite normalization of the foveal pit contour during the early phase after surgery. Such recovery can be easily identi- fied using OCT. We therefore determined whether post-oper- ative foveal contour recovery was a prognostic factor in the visual prognosis after ERM surgery.
Materials and Methods
We reviewed the medical records of patients who underwent iERM surgery (vitrectomy and ERM removal, ILM peeling) between June 2015 and June 2017 at Kosin University Gos-
pel Hospital. Patients with diabetic retinopathy, retina vessel occlusion, uveitis or trauma history, a retinal break, or a his- tory of vitrectomy surgery, all of which can cause secondary ERM, were excluded. Patients were also excluded if they were followed up for < 1 year, had ERM accompanying a macular hole (partial or full thickness), had a severe cataract (including nuclear sclerosis grade > 3, with severe cortical or posterior subcapsular opacity) before the surgery, or had complications of primary vitrectomy, including retinal de- tachment or vitreous hemorrhage.
Surgery was performed by two retina specialists (S.J.L, K.Y.N) using a 23-gauge vitrectomy (Accurus®, Alcon Lab- oratories, Fort Worth, TX, USA). All patients underwent complete ERM removal with ILM peeling using indocyanine green (ICG) staining. The concentration of the ICG dye solu- tion was 0.2% (2.0 mg/mL). At 10-15 seconds after injection, the ICG solution was removed. All cataract surgeries were performed during the iERM surgery in patients with phakic eyes. We used SD-OCT (Spectralis; Heidelberg Engineering, Heidelberg, Germany) for the pre- and post-operative exam- inations.
The patients were sorted into two groups (pit recovery and non-recovery groups) according to foveal changes within 1 month after ERM surgery (Fig. 1). Foveal pit contour recov- ery was defined as: 1) the pit notching to the level of the INL or more, in addition to 2) exposure of the central outer nucle- ar layer (ONL) to the retina surface within 1 month after sur- gery. Only patients who met both conditions were considered to exhibit recovery of the foveal contour. Despite small pit notching after surgery, if notching did not reach the level of the INL, or if the ONL was not exposed to the surface of the retina, the patient was classified into the non-recovery group (Fig. 2).
We compared the post-operative best-corrected visual acuity (BCVA; logarithm of the minimum angle of resolu- tion [logMAR]) and central macular thickness (CMT) mea- surements between the two groups using OCT at 1, 2, 3, 6, and 12 months after surgery. We also compared the pre- to post-operative changes in BCVA (logMAR) and CMT at 1, 2, 3, 6, and 12 months after surgery between the two groups.
All of these comparisons were only performed in pseu- dophakic eyes to minimize the lens effect on VA changes.
In addition, the pre-operative OCT features, including intraretinal cystic lesions, retinal folds, inner retinal thicken- ing, vitreomacular traction, and IS/OS disruption, were com-
pared between the two groups. Cases in which the central ONL was not exposed to the retina surface were defined as
inner retina thickening. In addition, we determined leaking on fluorescein angiography (FA).
Figure 1. Group classifications: recovery group (A, B) and non-recovery group (C, D). Optical coherence tomography shows the pre-operative state (A, C) and the status at 1 month after epiretinal membrane surgery (B, D).
A
B
C
D
Figure 2. Definition of foveal pit contour recovery after epiretinal membrane surgery. (A, B) We assign patients showing a pit notched to the level of the inner nuclear layer (INL) or more and exposure of the central outer nuclear layer (ONL) to the retina surface to the recovery group. If notch- ing did not reach the level of the INL (C), or if the ONL is not exposed to the surface of the retina (D), the patient is classified into the non-recovery group.
A
C
B
D
We used SPSS statistical software for Windows, version 20.0 (IBM Corp., Armonk, NY, USA) for all statistical anal- yses. The Mann-Whitney U test was used to assess the VA and CMT measurements and comparisons of their changes at each follow-up exam. Changes in VA and CMT over time in each group were analyzed by a repeated measures anal- ysis of variance. The chi-squared test was used to analyze the baseline characteristics, and logistic regression analysis was used to evaluate factors associated with foveal contour recovery.
Results
A total of 43 eyes from 43 patients were enrolled. There were 16 patients in the recovery group, and 27 in the non-recovery group. There were two cases (7.4%) with foveal pit contour recovery at 3 months after ERM surgery among the patients who were originally placed in the non-recovery group. The baseline patient characteristics are shown in Table 1. There were no significant differences between the two groups.
The BCVA and CMT values after ERM surgery were compared between the recovery and non-recovery groups.
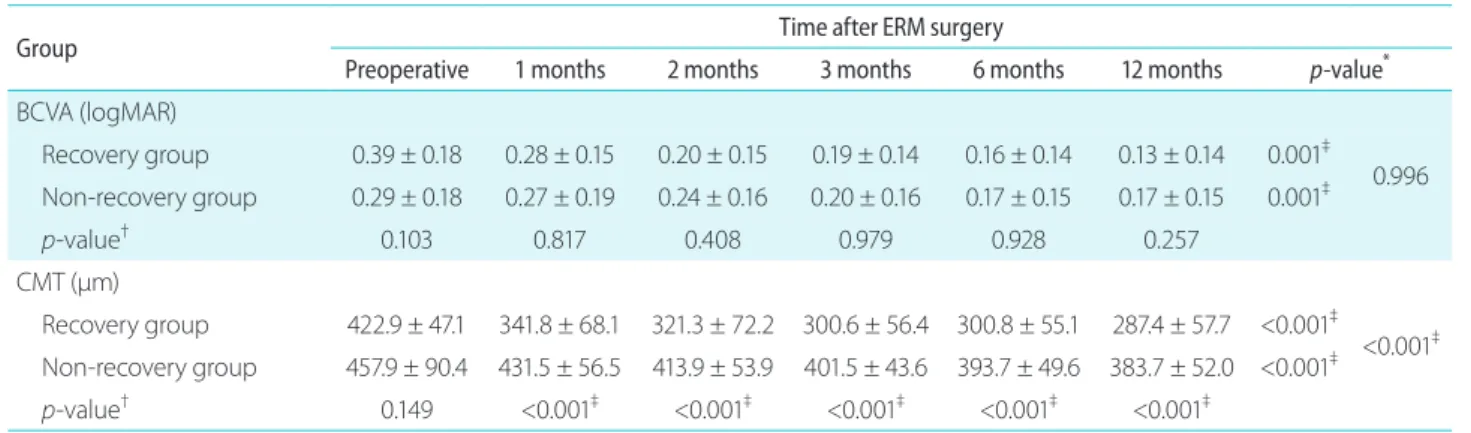
The BCVA was better in the recovery group than in the non-recovery group at 1 year after surgery, but the difference was not statistically significant. During the follow-up period, the BCVA was significantly improved in both groups (p = 0.001 in both groups) and there was no significant difference
(p = 0.996). The CMT was significantly lower in the recov- ery group at all time periods (p < 0.001). The CMT of both groups showed a significant reduction over time (p < 0.001 in both groups), and the degree of reduction was significantly higher in the recovery group (p < 0.001) (Table 2).
The VA improved in 79.1% (34/43 eyes) of patients by 12 months after ERM surgery. The VA change in BCVA af- ter ERM surgery was better in the recovery group at all fol- low-up points when compared with the non-recovery group.
These differences were statistically significant at 2, 6, and
Table 1. Preoperative baseline characteristics Characteristic
Recovery group (n = 16)
Non-recovery group (n = 27)
p-value
Age (years) 67.7 ± 6.4 66.0 ± 8.2 0.421*
Sex (M:F) 5:11 7:20 0.737†
DM 8 (43.8) 5 (18.5) 0.092†
HTN 7 (43.8) 10 (37.0) 0.752†
Pseudophakia 3 (18.8) 8 (29.7) 0.494†
Preoperative VA (logMAR) 0.39 ± 0.18 0.29 ± 0.18 0.103* Preoperative CMT (μm) 422.9 ± 47.1 457.9 ± 90.4 0.149* Values are presented as mean ± standard deviation or number (%).
DM = diabetes mellitus; HTN = hypertension; VA = visual acuity;
logMAR = logarithm of the minimum angle of resolution; CMT = central macular thickness.
*Mann-Whitney U test; †chi-square test.
Table 2. Best-corrected visual acuity (logMAR) and central macular thickness after ERM surgery
Group Time after ERM surgery
Preoperative 1 months 2 months 3 months 6 months 12 months p-value* BCVA (logMAR)
Recovery group 0.39 ± 0.18 0.28 ± 0.15 0.20 ± 0.15 0.19 ± 0.14 0.16 ± 0.14 0.13 ± 0.14 0.001‡ 0.996 Non-recovery group 0.29 ± 0.18 0.27 ± 0.19 0.24 ± 0.16 0.20 ± 0.16 0.17 ± 0.15 0.17 ± 0.15 0.001‡
p-value† 0.103 0.817 0.408 0.979 0.928 0.257
CMT (μm)
Recovery group 422.9 ± 47.1 341.8 ± 68.1 321.3 ± 72.2 300.6 ± 56.4 300.8 ± 55.1 287.4 ± 57.7 <0.001‡
<0.001‡ Non-recovery group 457.9 ± 90.4 431.5 ± 56.5 413.9 ± 53.9 401.5 ± 43.6 393.7 ± 49.6 383.7 ± 52.0 <0.001‡
p-value† 0.149 <0.001‡ <0.001‡ <0.001‡ <0.001‡ <0.001‡ Values are presented as mean ± standard deviation.
BCVA = best-corrected; logMAR = logarithm of the minimum angle of resolution; ERM = epiretinal membrane; CMT = central macular thickness.
*Repeated measures analysis of variance; †Mann-Whitney U test; ‡significant differences.
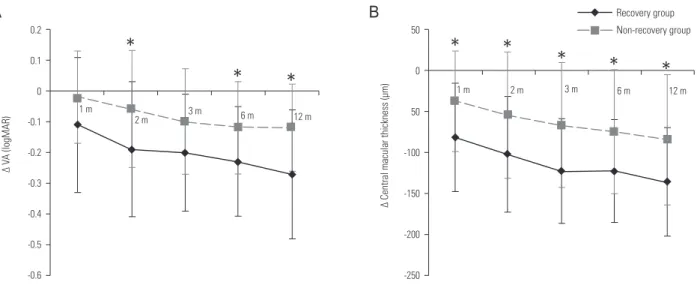
12 months after ERM surgery (p = 0.036, p = 0.023, and p = 0.008, respectively). During the follow-up period, the BCVA change was significantly increased in both groups (p < 0.001 in the recovery group and p = 0.002 in the non-recovery group), and the degree of change was significantly higher in the recovery group (p = 0.031). The reduction in CMT was significantly larger in the recovery group at all time periods (p = 0.006, p = 0.010, p < 0.001, p = 0.010, and p = 0.015).
In both groups, the reduction in CMT showed a significant increase over time (p = 0.008 in the recovery group and p <
0.001 in the non-recovery group), and the degree of reduc- tion was significantly higher in the recovery group (p = 0.028;
Table 3, Fig. 3).
Cataract surgeries were performed at similar rates in both groups. However, VA can be affected by the pre-operative cataract grade, cataract, and ERM surgeries. We therefore
Figure 3. The visual acuity (VA) and central macular thickness (CMT) changes from pre- to post-operative times after epiretinal membrane surgery. (A) The post-operative improvement in VA is better in the recovery group at all follow-up periods than it is in the non-recovery group, with significant differences at 2, 6, and 12 months. (B) The reduction in CMT is significantly larger in the recovery group during the first post-operative 12 months than it is in the non-recovery group. m = month(s). *p < 0.05, error bars denote the mean standard deviation.
0.2 0.1 0 -0.1 -0.2 -0.3 -0.4 -0.5 -0.6
∆ VA (logMAR)
*
* *
1 m 2 m 3 m 6 m 12 m
50
0 50
-100
-150
-200
-250
∆ Central macular thickness (μm)
* *
* * *
1 m 2 m 3 m 6 m 12 m
Non-recovery group Recovery group
A
0.2 0.1 0 -0.1 -0.2 -0.3 -0.4 -0.5 -0.6
∆ VA (logMAR)
*
* *
1 m 2 m 3 m 6 m 12 m
50
0 50
-100
-150
-200
-250
∆ Central macular thickness (μm)
* *
* * *
1 m 2 m 3 m 6 m 12 m
Non-recovery group Recovery group
B
Table 3. Change of VA (logMAR) and central macular thickness from baseline after ERM surgery
Group Time after ERM surgery
1 months 2 months 3 months 6 months 12 months p-value*
Δ VA (logMAR)
Recovery group -0.11 ± 0.22 -0.19 ± 0.22 -0.20 ± 0.19 -0.23 ± 0.18 -0.27 ± 0.21 <0.001‡
0.031‡ Non-recovery group -0.02 ± 0.15 -0.06 ± 0.19 -0.10 ± 0.17 -0.12 ± 0.15 -0.12 ± 0.14 0.002‡
p-value† 0.133 0.036‡ 0.093 0.023‡ 0.008‡
Δ CMT (μm)
Recovery group -81.1 ± 66.1 -101.7 ± 71.0 -122.4 ± 63.9 -122.2 ± 63.3 -135.6 ± 66.6 0.008‡
0.028‡ Non-recovery group -36.4 ± 61.3 -54.1 ± 77.3 -66.4 ± 76.7 -74.2 ± 75.7 -84.2 ± 80.4 <0.001‡
p-value† 0.006‡ 0.010‡ 0.000‡ 0.010‡ 0.015‡
Values are presented as mean ± standard deviation.
VA = visual acuity; logMAR = logarithm of the minimum angle of resolution; ERM = epiretinal membrane; CMT = central macular thick- ness.
*Repeated measure analysis of variance; †Mann-Whitney U test; ‡significant differences.
also analyzed the VA changes in pseudophakic eyes. There were three and eight pseudophakic eyes in the recovery and non-recovery groups, respectively. The VA improvement was better in the recovery group at all times. The differences were significant at 1, 2, 6, and 12 months after ERM surgery (p = 0.038, p = 0.041, p = 0.040, and p = 0.040, respectively).
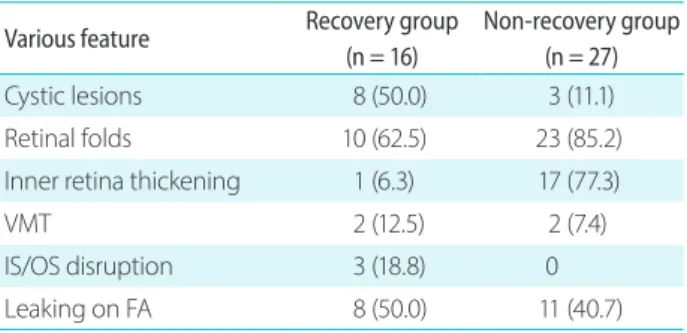
We also analyzed the association between various factors, including baseline characteristics, pre-operative OCT, FA features, and foveal pit contour recovery. The preoperative OCT and FA features in both groups are descripted in Table 4.
Intraretinal cystic lesions, inner retinal thickening on OCT, and pre-operative BCVA were significantly associated with foveal contour recovery by univariate logistic regression analysis (p = 0.009, p = 0.003, and p = 0.009, respectively).
That is, the rate of cases with cystic lesions was significantly higher in recovery group, on the other hand, the rate of inner retinal thickening was higher in non-recovery group. Pre- operative BCVA was significantly better in recovery group.
However, by multivariate logistic regression analysis, only inner retinal thickening was significantly associated with foveal contour recovery (p = 0.011), and it was lower for the recovery group than the non-recovery group. Logistic regression analysis was not appropriate for IS/OS disruption because there was no IS/OS disruption in the non-recovery group, so IS/OS disruption was not included in this analysis (Table 5).
Discussion
There have been many reports regarding visual prognostic factors after iERM surgery. Pre-operative VA and symptom duration are well-known factors associated with the visual prognosis [7,20,21].
SD-OCT has been used in the diagnosis of ERM. Various Table 4. Association between OCT, FA features and foveal contour
recovery
Various feature Recovery group (n = 16)
Non-recovery group (n = 27)
Cystic lesions 8 (50.0) 3 (11.1)
Retinal folds 10 (62.5) 23 (85.2)
Inner retina thickening 1 (6.3) 17 (77.3)
VMT 2 (12.5) 2 (7.4)
IS/OS disruption 3 (18.8) 0
Leaking on FA 8 (50.0) 11 (40.7)
OCT = optical coherence tomography; FA = fluorescein angiogra- phy; VMT = vitreomacular traction; IS/OS = inner segment/outer segment.
Table 5. Association between various factors including baseline characteristics, OCT, FA features and foveal contour recovery by logistic re- gression analysis
Factor
Univariate analyses Multivariate analyses
B OR
(95% confidence interval) p-value* B OR
(95% confidence interval) p-value†
Age -0.031 0.970 (0.892, 1.054) 0.468
VMT 0.58 1.786 (0.226, 14.099) 0.582
Cystic lesion 2.079 8.000 (1.699, 37.672) 0.009‡ 1.669 5.305 (0.806, 34.926) 0.083
Retinal fold -1.238 0.290 (0.067, 1.257) 0.290
IS/OS disruption§ 21.934 3.3 x exp (9) 0.999
Intraretinal thickening -3.239 0.039 (0.004, 0.343) 0.003‡ -3.785 0.023 (0.001, 0.420) 0.011‡
FA leakage 0.167 1.182 (0.333, 4.195) 0.796
Preop BCVA -2.872 0.057 (0.002, 1.986) 0.009‡ -4.227 0.015 (0.000, 2.054) 0.094
Preop CMT 0.01 1.010 (0.999, 1.021) 0.084
OCT = optical coherence tomography; FA = fluorescein angiography; OR = odds ratio; VMT = vitreomacular traction; IS/OS = inner seg- ment/outer segment junction of the photoreceptors; BCVA = best-corrected visual acuity; CMT = central macular thickness.
*Univariate logistic regression analysis; †multivariate logistic regression analysis; ‡significant differences; §IS/OS disruption was not included in the logistic regression analysis because there was no IS/OS disruption case in the non-recovery group, so logistic regression analysis was not appropriate.
OCT features were studied as post-operative visual prog- nostic factors, and several studies have reported that pho- toreceptor disruption, as indicated by IS/OS disruption, is associated with a poor final VA [7-11]. Scheerlinck et al. [11]
explained the mechanism of inner retina damage-like IS/OS disruption in the ERM, which is an inner retina disease. The traction forces on the inner retina can reach the photorecep- tor layer via Müller cells, and vision is affected by anatomi- cal damage to both the inner and outer retina [11].
Several features of the inner retina have been reported as prognostic factors in vision and metamorphopsia after ERM surgery. Okamoto et al. [1] reported that pre-operative INL thickness can predict post-operative metamorphopsia. Cho et al. [2] studied the correlation between the inner retinal irregu- larity index and post-operative visual outcomes. They defined this index as the length of the inferior border of the inner plexiform layer (IPL) by the length of the retinal pigment ep- ithelium (measured within 3.0 mm from the Early Treatment Diabetic Retinopathy Study inner circle). This group used ImageJ software to measure the length. The index was found to be a good post-operative visual prognostic factor [2]. Yang et al. [19] measured each layer of the retina manually. The inner retinal layer thickness was defined as the sum of the thicknesses of the nerve fiber layer (NFL), ganglion cell com- plex (GCL), IPL, and INL. The thinning of the central inner retinal layer thickness after ERM surgery was correlated with post-operative visual outcome. These OCT factors may be a good indicator of visual function after ERM surgery. Howev- er, there remains the need for careful inspection of OCT and complex calculations using specific programs.
A prior study investigated the correlation between post-operative foveal changes and long-term VA after iERM surgery. Yang et al. [19] found that restoration of the post-op- erative foveal inner retinal configuration was well-correlated with visual outcomes after surgery. However, that study differed from ours in several ways. For example, that study only enrolled patients with pre-operative inner retinal thick- ening. Restoration of the inner retinal configuration in that study meant only thinning of the INL (NFL+GCL+IPL+INL) thickness (despite the maintenance of total foveal thickness), and not normalization of the shape of the foveal pit. In addi- tion, manual measurement of each retinal layers was needed for the segmentation.
During follow-up after ERM surgery, we found that the foveal pit returned to its normal contour early after ERM sur-
gery in some patients, while it did not in others. We therefore assumed that this foveal change could serve as a long-term prognostic factor for visual outcomes. Although the BCVA was better in the recovery group than the non-recovery group at 1 year after surgery, the difference was not statistically significant. We also evaluated the association between early post-operative foveal pit contour recovery and visual im- provement after ERM surgery. The results show that there was significantly greater VA improvement after ERM sur- gery in the foveal recovery group at 2, 6, and 12 months after surgery, when compared with the non-recovery group. The degree of improvement over the follow-up time was also sig- nificantly greater in the recovery group using a repeated mea- sures analysis of variance. CMT reductions were significantly larger in the recovery group at all time points compared to that in the non-recovery group. Thus, the early foveal pit con- tour recovery within 1 month after ERM surgery may predict better visual improvement and larger CMT reduction com- pared to non-recovery group during long-term follow-up.
We also evaluated pre-operative factors, which were as- sociated with foveal contour recovery. Although intraretinal cystic lesions, inner retinal thickening on OCT, and pre-op- erative BCVA were significantly associated with foveal contour recovery by univariate logistic regression analysis, inner retinal thickening was the only significant factor by multivariate logistic regression analysis.
The foveal contour change can be detected very easily on OCT, without the need for careful examination using high-resolution OCT. There is no need for manual measure- ments of the specific retinal layers, or complex calculations of the measured length. It is also easy to explain the progno- sis to patients using OCT.
This study has several limitations. Its retrospective design introduced intrinsic bias. In addition, the sample size of eyes was small. It would be better to classify them into more groups for the analysis of correlations between foveal con- tour recovery and visual improvement. However, because of the small number of included cases, we had to simply compare the two groups. In addition, although we excluded patients with severe pre-operative cataracts in an attempt to minimize the effect of the lens, the number of pseudophakic eyes was too small to analyze the differences in VA changes between the two groups without influence from the pre-op- erative lens state. Overall, a prospective study with a larger sample of patients is needed to confirm our results.
In conclusion, the patients in the foveal recovery group had better VA improvement during 1 year of follow-up com- pared to those in the non-recovery group. Early foveal pit contour recovery may therefore be a useful visual prognostic factor after ERM surgery. It can be detected easily on OCT without careful inspections or complex calculations, and is helpful in explaining the long-term prognosis to patients.
Conflicts of Interest
The authors declare no conflicts of interest relevant to this article.
References
1. Okamoto F, Sugiura Y, Okamoto Y, et al. Inner nuclear layer thick- ness as a prognostic factor for metamorphopsia after epiretinal membrane surgery. Retina 2015;35:2107-14.
2. Cho KH, Park SJ, Cho JH, et al. Inner-retinal irregularity index predicts postoperative visual prognosis in idiopathic epiretinal membrane. Am J Ophthalmol 2016;168:139-49.
3. Michels RG. Vitrectomy for macular pucker. Ophthalmology 1984;91:1384-8.
4. Jung JJ, Hoang QV, Ridley-Lane ML, et al. Long-term retrospec- tive analysis of visual acuity and optical coherence topographic changes after single versus double peeling during vitrectomy for macular epiretinal membranes. Retina 2016;36:2101-9.
5. Schadlu R, Tehrani S, Shah GK, Prasad AG. Long-term follow-up results of ilm peeling during vitrectomy surgery for premacular fibrosis. Retina 2008;28:853-7.
6. Bouwens MD, de Jong F, Mulder P, van Meurs JC. Results of mac- ular pucker surgery: 1- and 5-year follow-up. Graefes Arch Clin Exp Ophthalmol 2008;246:1693-7.
7. Kim JH, Kim YM, Chung EJ, et al. Structural and functional pre- dictors of visual outcome of epiretinal membrane surgery. Am J Ophthalmol 2012;153:103-10.e1.
8. Kim HJ, Kang JW, Chung H, Kim HC. Correlation of foveal pho- toreceptor integrity with visual outcome in idiopathic epiretinal membrane. Curr Eye Res 2014;39:626-33.
9. Mitamura Y, Hirano K, Baba T, Yamamoto S. Correlation of visual recovery with presence of photoreceptor inner/outer segment
junction in optical coherence images after epiretinal membrane surgery. Br J Ophthalmol 2009;93:171-5.
10. Inoue M, Morita S, Watanabe Y, et al. Preoperative inner seg- ment/outer segment junction in spectral-domain optical co- herence tomography as a prognostic factor in epiretinal mem- brane surgery. Retina 2011;31:1366-72.
11. Scheerlinck LM, van der Valk R, van Leeuwen R. Predictive fac- tors for postoperative visual acuity in idiopathic epiretinal mem- brane: a systematic review. Acta Ophthalmol 2015;93:203-12.
12. Pesin SR, Olk RJ, Grand MG, et al. Vitrectomy for premacular fibroplasia. Prognostic factors, long-term follow-up, and time course of visual improvement. Ophthalmology 1991;98:1109-14.
13. Miguel AI, Legris A. Prognostic factors of epiretinal membranes:
a systematic review. J Fr Ophtalmol 2017;40:61-79.
14. Sato T, Mori R, Takahashi S, et al. Retrospective comparison of visual prognosis after vitrectomy for idiopathic epiretinal mem- branes with and without an ectopic inner foveal layer. Ophthal- mic Surg Lasers Imaging Retina 2018;49:838-45.
15. González-Saldivar G, Berger A, Wong D, et al. Ectopic inner fo- veal layer classification scheme predicts visual outcomes after epiretinal membrane surgery. Retina 2019 Feb 28. doi: 10.1097/
IAE.0000000000002486. [Epub ahead of print]
16. Falkner-Radler CI, Glittenberg C, Hagen S, et al. Spectral-domain optical coherence tomography for monitoring epiretinal mem- brane surgery. Ophthalmology 2010;117:798-805.
17. Kunikata H, Abe T, Kinukawa J, Nishida K. Preoperative factors predictive of postoperative decimal visual acuity ≥1.0 following surgical treatment for idiopathic epiretinal membrane. Clin Ophthalmol 2011;5:147-54.
18. Kim JH, Kang SW, Kong MG, Ha HS. Assessment of retinal layers and visual rehabilitation after epiretinal membrane removal.
Graefes Arch Clin Exp Ophthalmol 2013;251:1055-64.
19. Yang HS, Kim JT, Joe SG, et al. Postoperative restoration of foveal inner retinal configuration in patients with epiretinal membrane and abnormally thick inner retina. Retina 2015;35:111-9.
20. Wong JG, Sachdev N, Beaumont PE, Chang AA. Visual outcomes following vitrectomy and peeling of epiretinal membrane. Clin Exp Ophthalmol 2005;33:373-8.
21. Rice TA, De Bustros S, Michels RG, et al. Prognostic factors in vit- rectomy for epiretinal membranes of the macula. Ophthalmolo- gy 1986;93:602-10.