Diffusion tensor imaging (DTI) has been used primari- ly to demonstrate microstructure and identify abnormal- ities in the field of neurology, and has recently begun to
be investigated for discriminating cancer (1, 2). DTI uses additional gradients to plot the relative degree of diffu- sion in multiple dimensions. The use of multiple diffu- sion gradient directions allows gradient summation, re- sulting in stronger applied gradients and shorter TE val- ues. Several studies have recently reported the value of measuring the diffusion coefficient to correlate with his- tologic findings of disease extent in prostate cancer (3- 8). These studies have reported the potential usefulness of diffusion weighted image (DWI) for detecting prostate cancer because it shows a lower apparent diffusion coef-
Value of Diffusion Tensor Imaging of Prostate Cancer:
Comparison with Systemic Prostate Biopsy
1Seong Kuk Yoon, M.D., Dong Won Kim, M.D., Dong-Ho Ha, M.D., Hee Jin Kwon, M.D., MyongJin Kang, M.D., Sunseob Choi, M.D., Kyung Jin Nam, M.D., Jung Il Kim, M.D.2
1Department of Radiology, Dong-A University, Medical Center
2Department of Occupational Medicine, Dong-A University, Medical Center
This study was supported by the research fund of Dong-A University Medical Center <grant no. IB-2007>, Korea
Received July 28, 2010 ; Accepted October 7, 2010
Address reprint requests to : Dong Won Kim, M.D., Department of Radiology, Dong-A University, Medical Center, Dongdaesin-dong 3(sam)ga, Seo-gu, Busan 602-715, Korea.
Tel. 82-51-240-5367 Fax. 82- E-mail: [email protected]
Purpose: This study was performed to evaluate the usefulness of diffusion tensor imaging (DTI) and to correlate systemic twelve biopsy in prostate cancer.
Materials and Methods: Thirty-one patients with suspected prostate cancer underwent MR imaging. DTI was performed prior to a prostate biopsy. We prospectively calculat- ed the apparent diffusion coefficient (ADC) and fractional anisotropy (FA) value in each corresponding biopsy site.
Results: Twenty-three of 31 patients had histopathologically proven adenocarcinoma.
Among the 276 biopsy cores of 23 patients with prostate cancer, 109 cores showed pos- itive results (39%). The ADC and FA value of positive cores were 1.31 ± 0.34×10⁻³ mm2/s and 0.68 ± 0.07, and those of the negative cores were 1.74 ± 0.45×10⁻³mm2/s and 0.54 ± 0.09, respectively. Eight patients without carcinoma showed an ADC val- ue of 1.83 ± 0.26×10⁻³mm2/s and an FA value of 0.47 ± 0.07. The ADC and FA value of positive cores were significantly lower and higher than those of negative cores and cancer-free patients, respectively (p < 0.05).
Conclusion: The ADC and FA values using DTI may provide useful diagnostic informa- tion in the differentiation of cancerous tissues, although there is overlap in some cases.
Index words :Prostate
Prostate Neoplasms
Magnetic Resonance Imaging
Diffusion Magnetic Resonance Imaging Diffusion Tensor Imaging
ficient (ADC) than a normal peripheral zone (PZ).
Prostate cancer could be detected more accurately by T2-weighted imaging (T2WI) with a diffusion weighted image as compared with T2WI. However, these studies obtained the DWI and ADC values with the diffusion gradients applied in only three different directions and correlated the ADC values with less than six histologic sites per patient. To our knowledge, few reports exist on the usefulness of ADC and FA values using DTI in cor- relation with histology for prostate cancer diagnosis.
Our study obtained ADC and fractional anisotropy (FA) values using DTI with diffusion gradients applied in six different directions and correlated DTI values with 12 biopsy sites per patient.
The purpose of this study was to evaluate the useful- ness of DTI and to correlate the systemic twelve biopsy in prostate cancer.
Materials and Methods
Patients Population
Our institutional review board approved this study, and the requirement for patient informed consent to participate in this study was waived. Informed consent had been obtained from all patients prior to the biopsy.
Thirty-one patients with suspected prostate cancer were enrolled in our study. The mean patient age ranged from 47 to 72 years (mean, 56 years). Mean prostate volume was 49.7 gm (range, 21.0-78.9 gm) and the mean serum PSA level of the patients was 22.4 ng/mL (range, 4.1-96.0 ng/mL). Twelve patients had PSA levels below 10 ng/mL.
MR Technique
The patients underwent conventional MR imaging and DTI. MR examinations were performed with a 1.5T MR scanner (GE Signa Excite HD, General Electric, Milwaukee, WI, USA) along with an 8-channel phased array coil prior to transrectal ultrasound guided sys-
A B C
D E
Fig. 1. T2-weighted image (A) shows low signal intensity (arrow) of the left periph- eral zone in accordance with a positive biopsy result. We obtained b = 500 s/mm2 image (B) and isotropic image (C) using diffusion tensor imaging. The ADC (D) and FA (E) value shows corresponding de- crease and increase in the same regions.
temic 12-core biopsy. The parameters of conventional MR imaging were as follows: T2-weighted fast spin- echo images were obtained in three orthogonal planes (TR/TE, 4000 ms/109.7 ms; echo train length, 16; num- ber of excitation, 2) with a 320 × 224 matrix, 4-mm slice thickness, 0.4-mm interslice gap, and an 18-cm field of view. T1-weighted spin-echo images were also obtained in the axial plane (TR/TE, 500 ms/14 ms; echo train length, 7; number of excitation, 1) with a 320×224 ma- trix, 4-mm slice thickness, 0.4-mm interslice gap, and a 21-cm field of view. We used a single-shot spin-echo echo-planar imaging (EPI) sequence using the following parameters: TR/TE, 4000 ms/6 ms; number of excita- tion, 4; 192×192 matrix; 5-mm slice thickness; no inter- slice gap; a 20-cm field of view; ASSET factor, 2. The ac- quisition time was 2 minutes and the b-factors were 0 and 500 s/mm2with the diffusion gradients applied in 6 different directions.
Image Analysis and Prostate Biopsy
A faculty radiologist with 10 years of experience in prostate MR imaging prospectively measured the ADC and FA value in each of the sites corresponding to the 12 systemic biopsy sites using an Advantage Windows workstation (Functool 2.6.6i, GE Medical Systems, Fremont, CA, USA). For each patient the radiologist drew 12 regions of interest (ROIs) in both PZs. The area of ROIs kept constant in each patient in order to reduce
the standard error in measurement. These ROIs were manually set on images for EPI acquired with b = 0 s/mm2and accounting for the distortion of EPI on which structures could be easily identified, and then copied.
Examples of ROI placement are shown in Fig. 1.
Transrectal ultrasound (TRUS) guided systemic biopsy of the prostate was performed on an ultrasound system (ACUSON Sequoia 512, Siemens, Mountain View, CA, USA). The patients were examined with gray scale imaging in the axial and sagittal planes with a 10 MHz transrectal probe. Local anesthetics were administered to patients before the prostate biopsy was performed.
We obtained TRUS guided systemic 12 biopsy cores at sites including the lateral and medial regions of the apex, as well as the middle and base in both PZs (Fig. 2).
A biopsy was not obtained in both transitional zones.
The analysis of MR analysis and TRUS guided systemic biopsy were performed by the same radiologist. The ra- diologist made efforts to match the 12 biopsy sites to the ROIs. We classified biopsy cores into “positive” or
“negative” for carcinoma.
Statistical Analysis
After confirming that the data was normally distrib- uted, unpaired t-tests were used to determine whether there was a significant difference for the mean ADC and FA values between positive and negative cores, negative cores in cancer patients and negative cores in cancer- free patients. All of the tests were two-sided, and p <
0.05 was considered to be statistically significant.
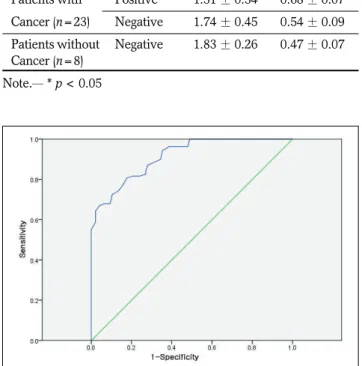
The diagnostic power of the ADC and FA values in differentiating prostate cancer from noncancerous tissue was evaluated by the ROC curve analysis. Analysis was performed between positive cores in cancer patients and negative cores in cancer-free patients. To use the ADC and FA values as a diagnostic tool, we extracted the optimal cutoff value of ADC and FA from the ROC curve analysis. The sensitivity and specificity corre- sponding to the cutoff values were then calculated. A statistical analyses was then performed using SPSS 14.0 KO software for Windows (SPSS, Chicago, IL, USA).
Results
The ADC and FA values were successfully measured for all 31 patients. The time between the MR examina- tion and systemic 12 biopsy was within one week.
Twenty-three of 31 patients had histopathologically proven adenocarcinoma with a Gleason score of 6.2 Fig. 2. Diagrams of the TRUS guided 12 biopsy site at the axial
plane in 3 levels of the prostate glands (A-C).
(range, 3-10). Twelve of the 23 patients with prostate cancer underwent radical prostatectomy. Among the 276 biopsy cores taken from the 23 patients with prostate cancer, 109 showed positive results (39%). The mean ADC and FA values of the positive cores were 1.31±0.34×10⁻³ mm2/s (range, 0.6×10⁻³ - 1.64×10⁻³ mm2/s) and 0.68 ± 0.07 (range, 0.53 - 0.87), respective- ly. In contrast the negative cores had mean ADC and FA values of 1.74 ± 0.45×10⁻³mm2/s (range, 1.21×10⁻³- 2.73×10⁻³mm2/s) and 0.54 ± 0.09 (range, 0.36 - 0.73), respectively. Eight (96 biopsy cores) patients without carcinoma showed ADC and FA values of 1.83 ± 0.26
×10-3mm2/s (range, 1.5×10⁻³- 2.51×10⁻³mm2/s) and 0.47±0.07 (range, 0.33 - 0.64), respectively (Table 1).
Only a slight overlap was observed between the positive and negative cores. The ADC and FA values of the posi- tive cores were significantly lower and higher than those of negative cores and cancer-free patients (p <
0.05), respectively. However, there were no significant differences between the negative cores of cancer pa- tients and the negative cores of cancer-free patients for both the ADC and FA values (p > 0.05).
The ROC curves calculated to determine the diagnos- tic performance of the ADC and FA values for differen- tiating prostate cancer form non-cancerous tissue are demonstrated in Fig. 3 and Fig. 4. The area under the ROC curve (Az) of the ADC was 0.914 (95% confidence interval [CI], 0.879-0.950, p < 0.01). In comparison, the Az of the FA was 0.983 (95% CI, 0.970-0.997, p < 0.01).
The optimal cutoff value of the ADC from the ROC analysis was 1.65×10⁻³ mm2/s with 87.2% sensitivity and 71.9% specificity. The optimal cutoff value of the FA was 0.55 with a 99.1% sensitivity and 88.5% speci- ficity. The ROC analyses showed that the ADC and FA values provided good diagnostic performance for differ- entiating cancer and noncancerous tissue.
Discussion
DTI is an emerging MR imaging method for gaining insight into tissue microstructure through the monitor- ing of random movement of water molecules, which is usually restricted in anisotropic tissues. Tissues that have a regularly ordered microstructure reflect a marked anisotropy in their diffusion properties. DTI to map anisotropy and fiber orientation has primarily been performed in vivo in the human brain. However, the ad- vent of EPI has enabled the use of diffusion imaging in other organ systems. Diffusion in the prostate is also di- rection-dependant (9). Prostate anisotropy measure- ments can provide useful indices for lesion characteriza- tion. Several studies have recently reported the values of measuring diffusion anisotropy to correlate with histo- logic findings of disease extent in prostate cancer (3-8).
However, these studies obtained DWI in three orthogo- Table 1. Comparison of the Apparent Diffusion Coefficient
(ADC) and Fractional Anisotropy (FA) Value in Prostate Cancer Tissue and Noncancerous Tissue
Results of ADC
Biopsy Core (×10-3mm2/s) FA Patients with Positive 1.31 ± 0.34* 0.68 ± 0.07*
Cancer (n=23) Negative 1.74 ± 0.45 0.54 ± 0.09 Patients without Negative 1.83 ± 0.26 0.47 ± 0.07 Cancer (n=8)
Note.─* p < 0.05
Fig. 4. Receiver operating characteristics curve. Graph of the curve for FA shows that the area under the curve is 0.983 for differentiating prostate cancer from non-cancerous tissue.
Fig. 3. Receiver operating characteristics curve. Graph of the curve for ADC shows that the area under the curve is 0.914 for differentiating prostate cancer from non-cancerous tissue.
nal planes (not six orthogonal planes) and correlated them with less than six histologic sites per patient.
We measured the ADC and FA values using diffusion gradients along the six directions of the motion-probing gradients. To our knowledge, there are few studies on the use of ADC and FA values in the correlation with histology for prostate cancer diagnosis. Also, we corre- lated DTI values with 12 biopsy sites in the peripheral zone of a given patient. Several indices have been intro- duced to characterize diffusion anisotropy. Initially, sim- ple scalar indices calculated from DWI or ADCs ob- tained in perpendicular directions were used. However, these indices are not really quantitative, as they do not correspond to a single meaningful physical parameter and, more importantly, are clearly dependent on the choice of directions made for the measurements. The degree of anisotropy would then vary according to the respective orientation of the gradient hardware as well as the tissue frames of reference and would generally be underestimated. Thus, invariant indices have been made of the combination of the terms of the diagonal- ized diffusion tensor, (i.e., the eigenvalues 1, 2, and 3).
The most commonly used invariant indices are the rela- tive anisotropy, the FA, and the volume ratio indices (10). These DTI indices can be used for determining quantitative diffusion metrics. The ADC value reflects molecular diffusivity under motion restriction.
Moreover, the FA index is used to characterize direc- tional variability in diffusion. FA is obtained by using at least 6 different directions which provide directional da- ta pertaining to diffusion anisotropy. A tissue is consid- ered to be fully isotropic when its anisotropy is equal to 0, and fully anisotropic when its anisotropy is equal to 1 (10).
Previous studies have indicated that DWI can distin- guish prostate cancer from normal tissue with the ADC value (3-8). Our results indicated a significant low ADC value in cancerous tissue compared to normal tissue.
The mean ADC value of cancer was 1.31 ± 0.34 10-3 mm2/s, which compared to 1.74 ± 0.45 10-3mm2/s in negative cores. These findings were consistent with the 1.08 ± 0.39 and 1.8 ± 0.41 × 10⁻³mm2/s reported by Sato et al. (3) and reported 0.99 ± 0.21 and 1.5 ± 0.18
× 10-3mm2/s reported by Kim et al. (8). However, the b- value in our study was different from those reports.
Also, our results indicated a significant higher FA value in cancerous tissue than normal tissue. To our knowl- edge, there few reports deal with the FA value in prostate cancer. Only the FA value of normal tissue for
the PZ was reported by Sinha et al. (9). Our FA value, 0.42 ± 0.07 for normal PZ was similar to a previous re- port (0.46 ± 0.04) (9).
With the relatively low b-value employed in our study, the measured ADC primarily reflects the diffu- sion coefficient of extracellular water (11). Applied b- factor was 500 s/mm2in this work. However, there is no consensus about the optimal b-value for prostate cancer.
Although a DTI with a high b-value can allow the de- crease in signal-to-noise ratio (SNR) loss in a high-Tesla MR system, further studies should be performed for the benefit of high b-value in the prostatic tissues. The nor- mal prostate gland consists of a network of water-rich ducts and acini supported by stroma. The stroma is much looser in the PZ than in the central gland (CG), re- sulting in a larger extracellular space. These differences in histology can then account for higher ADC values in the more glandular PZ compared to the CG. In cases of prostate cancer, loose stroma is replaced by densely packed malignant epithelial cells, resulting in a signifi- cant decrease in extracellular space and thus a lower ADC value (4). The anisotropy values (FA) of PZ and CG are close, with a slightly higher value for the PZ com- pared to CG. This is given that the greater structural or- ganization of CG may be expected to yield higher anisotropy values (9). We suggest that densely packed malignant epithelial cells may yield the greater structur- al organization compared to a normal looser structure in the PZ. Our study showed that cancerous lesions had the lower ADC and higher FA values than normal prostate tissue. These findings suggest that the measure- ment of the ADC and FA values may be additional use- ful information for the differentiation of cancerous tis- sues.
The ADC and FA values slightly overlap between can- cer and noncancerous tissue. The indices reflect various physical and physiological characteristics of tissue but are not specific for cancer itself. Various abnormal and different conditions, such as prostatitis, ischemia, be- nign prostatic hyperplasia, intratumoral hemorrhage, age, body temperature, regional gradient, tissue pres- sure, perfusion rate, or magnetic environment of an in- dividual subject, alter the DTI indices (8, 12, 13). Many different MR acquisition protocols and MR devices also make it difficult to determine the cut-off value for differ- entiating cancer from non-cancerous tissue.
There are limitations to our study. Despite our best ef- forts to match the 12 biopsy sites to the ROIs in the PZ, the biopsy sites may be actually different from the ROIs
because of the transrectal ultrasound angle. The biopsy result may not represent the histologic feature in the ROI. Hence, a histopathologic analyses would need to be performed using a total histologic specimen from rad- ical prostatectomy.
In conclusion, the ADC and FA values using DTI may provide useful diagnostic information in the differentia- tion of cancerous tissues, although there is overlap in some cases.
References
1. Sundgren PC, Dong Q, Go′mez-Hassan D, Mukherji SK, Maly P, Welsh R. Diffusion tensor imaging of the brain: review of clinical applications. Neuroradiology 2004;46:339-350
2. Yang Q, Tress BM, Barber PA, Desmond PM, Darby DG, Gerraty RP, et al. Serial study of apparent diffusion coefficient and anisotropy in patients with acute stroke. Stoke 1999;30:2382-2390 3. Sato C, Naganawa S, Nakamura T, Kumada H, Miura S, Takizawa
O, et al. Differentiation of noncancerous tissue and cancer lesions by apparent diffusion coefficient values in transition and peripher- al zones of the prostate. J Magn Reson Imaging 2005;21:258-262 4. Kozlowski P, Chang SD, Jones EC, Berean KW, Chen H,
Goldenberg SL. Combined diffusion-weighted and dynamic con- trast-enhanced MRI for prostate cancer diagnosis-correlation with biopsy and histopathology. J Magn Reson Imaging 2006;24:108-113 5. Haider MA, van der Kwast TH, Tanguay J, Evans AJ, Hashmi AT,
Lockwood G, et al. Combined T2-weighted and diffusion-weight- ed MRI for localization of prostate cancer. AJR Am J Roentgenol 2007;189:323-328
6. Tanimoto A, Nakashima J, Kohno H, Shinmoto H, Kuribayashi S.
Prostate cancer screening: the clinical value of diffusion-weighted imaging and dynamic MR imaging in combination with T2-weight- ed imaging. J Magn Reson Imaging 2007;25:146-152
7. Tamada T, Sone T, Jo Y, Toshimitsu S, Yamashita T, Yamamoto A, et al. Apparent diffusion coefficient values in peripheral and transition zones of the prostate: comparison between normal and malignant prostatic tissues and correlation with histologic grade. J Magn Reson Imaging 2008;28:720-726
8. Kim JH, Kim JK, Park BW, Kim N, Cho KS. Apparent diffusion co- efficient: prostate cancer versus noncancerous tissue according to anatomical region. J Magn Reson Imaging 2008;28:1173-1179 9. Sinha S, Sinha U. In vivo diffusion tensor imaging of the human
prostate. Magn Reson Med 2004;52:530-537
10. Le Bihan D, Mangin JF, Poupon C, Clark CA, Pappata S, Molko N, et al. Diffusion tensor imaging: concepts and applications. J Magn Reson Imaging 2001;13:534-546
11. Gibbs P, Tozer DJ, Liney GP, Turnbull LW. Comparison of quanti- tative T2 mapping and diffusion-weighted imaging in the normal and pathologic prostate. Magn Reson Med 2001;46:1054-1058 12. Hoehn-Berlage M, Eis M, Schmitz B. Regional and directional
anisotropy of apparent diffusion coefficient in rat brain. NMR Biomed 1999;12:45-50
13. Tamada T, Sone T, Toshimitsu S, Imai S, Jo Y, Yoshida K, et al.
Age-related and zonal anatomical changes of apparent diffusion co- efficient values in normal human prostatic tissues. J Magn Reson Imaging 2008;27:552-556
대한영상의학회지 2011;64:179-184
전립선암의 확산텐서영상의 유용성:
규칙적 생검 결과와의 비교11동아의대병원 영상의학과
2동아의대병원 산업의학과
윤성국∙김동원∙하동호∙권희진∙강명진∙최순섭∙남경진∙김정일2
목적: 전립선암 진단에서 규칙적 12분 생검(system twelve biopsy) 결과와 연관하여 확산텐서영상의 유용성을 평가하는 것이다.
대상과 방법: 전립선암이 의심되는 31명의 환자에서 자기공명영상과 확산텐서영상을 얻었다. 이후 경직장초음파 유 도하에 생검을 하였고, 전향적으로 생검 위치에 해당하는 부위에서 겉보기확산계수(apparent diffusion coefficient (ADC) 과 fractional anisotropy (FA)를 측정하였다.
결과: 31명 중 23명이 조직학적으로 샘암종으로 판명되었다. 23명의 276개의 검체 중에서 109개가 암 양성 소견을 보였다(39%). 양성 검체의 ADC와 FA는 1.31 ± 0.34 × 10⁻³ mm2/s 와 0.68 ± 0.07 이었다. 음성 검체의 ADC와 FA는 1.74 ± 0.45 × 10⁻³mm2/s 와 0.54 ± 0.09 이었다. 전립선암이 없는 8명의 검체의 ADC와 FA는 1.83 ± 0.26 × 10⁻³mm2/s 와 0.47 ± 0.07 이었다. 전립선암 환자의 양성 검체를 전립선암 환자의 음성 검체와 암이 없는 환자의 검체와 비교하였을 때 의미있게 ADC는 낮았고 FA는 높았다(p < 0.05).
결론: 확산텐서영상을 이용한 ADC와 FA의 측정은 일부 중복을 보이나 암 조직과 정상 조직을 감별하는데 도움이 될 수 있다.