Usefulness of Apparent
Diffusion Coefficient Value of Diffusion-Weighted
Imaging and Peak
Standardized Uptake Values of Positron Emission
Tomography-CT for Predicting Prognostic Factors of Breast Cancer
유방암 예후 예측에 대한 확산강조영상의 현성 확산계수 값과 양전자방출단층촬영의 최대표준 섭취 계수의 유용성
Tae Sun Kang, MD1 , Keum Won Kim, MD1* , Young Joong Kim, MD1, Jae Young Seo, MD1, Yong jun Cho, MD1 , Cheol Mog Hwang, MD1, Mu-Sik Lee, MD2
Departments of 1Radiology, 2Preventive Medicine, Konyang University Hospital, Daejeon, Korea
Purpose This study was performed to retrospectively correlate the apparent diffusion coeffi- cient (ADC) value and peak standardized uptake value (pSUV) with prognostic factors and MRI findings for breast lesions.
Materials and Methods Ninety four breast cancers in 82 women were included in this study.
Our patients underwent presurgical MRI including diffusion-weighted imaging (DWI), 18-fluoro- deoxyglucose PET-CT, and immunohistological staining of the surgical or biopsy specimens. We evaluated relationships between mean ADCs and pSUVs with a variety of prognostic factors (age, tumor size, histologic grade of tumor, hormone receptors, human epidermal growth factor receptor 2 expression status, and nodal metastasis) and MRI findings (shape, margin and internal enhancement of mass, T2-signal intensity, and kinetics), using statistical methods.
Received May 24, 2018 Revised June 30, 2018 Accepted September 28, 2018
*Corresponding author Keum Won Kim, MD Department of Radiology, Konyang University Hospital, 158 Gwanjeodong-ro, Seo-gu, Daejeon 35365, Korea.
Tel 82-42-600-9180 Fax 82-42-600-9193 E-mail [email protected] This is an Open Access article distributed under the terms of the Creative Commons Attribu- tion Non-Commercial License (https://creativecommons.org/
licenses/by-nc/4.0) which permits unrestricted non-commercial use, distri-bution, and reproduc- tion in any medium, provided the original work is properly cited.
ORCID iDs Keum Won Kim https://
orcid.org/0000-0002-7312-5483 Tae Sun Kang
https://
orcid.org/0000-0002-8500-0303
Results Both mean ADCs and pSUVs were significantly associated with histologic grade (p = 0.000 and p = 0.001) and nodal metastasis (p = 0.013 and p = 0.001). pSUVs were significantly associated with tu- mor size and estrogen receptor status, as well as irregular shape and rim enhancement pattern on MRI findings. On multivariate analysis, mean ADCs were significantly associated with invasiveness, estrogen receptor status and HER-2 expression status. PSUVs were only significantly associated with tumor size.
Conclusion Mean pSUVs on PET-CT and ADCs on DWI helped predict prognosis of breast cancer.
Index terms Breast Cancer; Prognostic Factor; Magnetic Resonance Imaging;
Diffusion Magnetic Resonance Imaging; PET-CT
INTRODUCTION
Breast cancer is one of the major causes of death among women worldwide, and its inci- dence continues to increase (1, 2). Because of the early detection of breast cancer through medical imaging and advances in treatment methods, survival rates of patients with breast cancer have increased recently. Factors that determine the prognosis of breast cancer include age, tumor size, lymph node metastasis (TNM staging), histological characteristics (e.g., histo- logical subtype, nuclear grade, lymphovascular invasion), and hormone receptors such as es- trogen receptor (ER), progesterone receptor (PR), and human epidermal growth factor recep- tor 2 (HER-2) (3). Larger tumor sizes, higher histological grades, more extensive lymph node metastasis, HER-2-positive tumors, and ER- and PR-negative tumors indicate poorer progno- ses. Invasive ductal carcinoma (IDC) is graded from 1 to 3 depending on the extent of tubular formation, nuclear pleomorphism, and mitosis; generally, higher grades indicate poorer prognoses (4). These prognostic factors for breast cancer are important for the follow-up treatment and management of patients (5).
Dynamic contrast-enhanced MRI techniques, using a contrast medium, can reduce the number of histological tests performed and assist in the detection of multifocal breast cancer and the determination of the breast cancer stage. Although dynamic contrast-enhanced MRI is the technique with the highest sensitivity for diagnosing breast lesions, the specificity of MRI is disputed (6). Recently, the specificity of dynamic contrast-enhanced MRI for malig- nant breast lesions has been improved through the use of diffusion-weighted imaging (DWI) (7). Most malignant tumors exhibit high cellularity, thereby preventing water diffusion and displaying high signal intensity on DWI; moreover, these tumors have low apparent diffusion coefficients (ADCs), which measure the magnitude of the diffusion of water molecules that are present within the body. These malignant tumors contain more cells than lesions with high ADCs, indicating that they inhibit water diffusion. Several studies have attempted to uti- lize this phenomenon to diagnose breast cancer, and have reported an association between ADCs and prognostic factors for breast cancer (8-13). In addition, attempts are currently un- derway to predict lesion malignancy through the use of the peak standardized uptake value (pSUV) of PET using 18-fluorodeoxyglucose (FDG) (14). This technique is based on the phe- nomenon that high levels of malignant tumor metabolic activity are observed on PET, as a re-
sult of increased carbohydrate metabolism within the tumor itself, as well as on various bio- chemical characteristics of the tumor and other external factors (15). Previous studies have reported cut-off values for distinguishing between malignant and benign tumors, using ADCs on DWI and pSUVs of PET-CT (8, 10-12, 16, 17). Within this context, we aimed to char- acterize ADCs on DWI and pSUVs of PET-CT, to investigate their correlations with prognostic factors for breast cancer as well as with MRI findings.
MATERIALS AND METHODS
This retrospective study was performed with Institutional Review Board approval and the requirement for obtaining informed patient consent was waived (IRB No. 2018-11-002). A total of 126 patients diagnosed with breast cancer, based on histological examinations at our insti- tution between January 2012 and December 2015 (mean age, 53.5 years; range, 30–87 years), were retrospectively analyzed.
The exclusion criteria were as follows: patients who did not undergo surgery (20 patients), patients who underwent pre-operative neoadjuvant chemotherapy or pre-operative endo- crine treatment (10 patients), patients histologically confirmed to have benign lesions (9 pa- tients), and patients who provided low-quality medical images with MRI artifacts (5 patients).
Of all 126 patients, 44 patients in total were excluded from the study. Ninety-four breast le- sions from 82 women, including six bilateral and three multifocal lesions, were included.
Immunohistochemical staining was performed on all lesions. Those lesions that had been subjected to MRI or PET-CT were further analyzed. Among these, 87 lesions were available for mean ADC measurements. pSUVs were recorded for 87 lesions. Both mean ADCs and pSUVs were recorded for 80 lesions.
For MRI, a Philips Intera Achieva 3.0T MRI system (Philips Medical Systems, Best, the Neth- erlands) was used. A bilateral four-channel phase array breast coil was used while the patient was in a prone position. Axial DW images of both breasts were obtained. In single-shot echo- planar imaging with sense encoding, b-values of 0 mm2/s and 1000 mm2/s were used. The pa- rameters were repetition time/echo time (TR/TE) = 1825/57, field of view (FOV) = 350 × 350 mm2, matrix size = 116 × 115, 2.0 number of excitations (NEX), section thickness = 5 mm, and intersection gap = 0. For the calculation of ADCs, two radiologists, who were blinded to the results, placed as many multiple circular regions of interests (ROIs) with a diameter be- tween 5 and 10 mm. When compared with dynamic contrast-enhanced MRI, the enhancing solid portion of the tumor was used for the ADC measurement without including necrosis or liquids. Mean ADCs were automatically calculated when drawing the ROIs.
T2-weighted MRI images of the axial view of both breasts were obtained, using the spectral adiabatic inversion recovery and spectral attenuated inversion recovery (SPAIR) technique.
The parameters were TR/TR = 2660/70, FOV = 339 × 339 mm2, matrix size = 584 × 342, 1.0 NEX, section thickness = 4 mm, and intersection gap = 0. For T1-weighted MRI images, the axial T1-weighted 3 dimensional dynamic gradient-echo fat-suppressed sequence technique was used to obtain one pre-contrast image, along with seven early and delayed contrast-en- hanced images, each at a 1-minute interval. The parameters were TR/TE = 3.8/1.9, FOV = 340 × 340 mm2, matrix size = 424 × 424, 1.0 NEX, section thickness = 1.5 mm, intersection gap = 0.
For PET-CT, a Gemini TF PET-CT scanner (Philips Medical Systems) was used. PET-CT was performed 50–60 minutes after intravenous administration of FDG. The parameters for CT were slice thickness = 4 mm, 120 kVp, and 100 mAs. A single expert in nuclear medicine ex- amined the PET-CT images, and lesions showing high levels of FDG consumption, compared with surrounding breast tissues, were considered a positive indication for the presence of a tumor. A radiologist confirmed the locations of these lesions and calculated their pSUVs.
For the analysis of the prognostic factors for breast cancer, patients were classified as ≤ 50 or > 50 years of age. Tumor size was measured as the maximum diameter of the tumor in pathologic results, and was divided into ≤ 2 and > 2 cm. Tumors were categorized according to the expression levels of ER, PR, HER-2, and four major subtypes (Luminal A, Luminal B, HER-2-enriched and triple-negative breast cancer). The expression level of HER-2 was semi- quantitatively recorded as 0, 1+, 2+, or 3+. Tumors that scored 3+ were classified as HER- 2-positive. Tumors with an HER-2 expression of 2+ were reevaluated according to recent guidelines (18). Tumors that scored 2+ were studied using fluorescent in situ hybridization to determine the HER-2 gene amplification. Tumors that scored 0 and 1+ were classified as HER-2-negative. Breast cancer was histologically analyzed by referring to reports of patho- logical results. IDC was graded, from grade 1 to grade 3. For lymph node testing, a sentinel lymph node resection was performed, and axillary lymph node resection was immediately performed upon determination that the sentinel lymph node was positive (+). MRI findings regarding breast cancer were classified according to the 5th Edition of the American College of Radiology of the Breast Imaging-Reporting and Data System. Breast lesions were divided into mass and non-mass enhancement (NME). The shape (round/oval vs. irregular), margin (circumscribed vs. not circumscribed), mass internal enhancement (homogeneous vs. hetero- geneous vs. rim enhancement; there were no cases with dark internal septations), and kinetic curve assessment (initial phase: slow vs. medium vs. fast/delayed phase: persistent vs. plateau vs. washout) of the mass lesions were analyzed. Two radiologists analyzed the MRI findings and ADCs on DWI, respectively, and came to a consensus. Mean ADCs and pSUVs of each le- sion were recorded to analyze their correlations with age, tumor size, histologic grade, hor- mone receptor expression, and MRI findings.
For statistical analysis, the SPSS, version 20.0 (IBM Corp., Armonk, NY, USA) was used. Mann- Whitney and Kruskal-Wallis tests were respectively used to analyze how the ADC value and mean pSUV of each lesion correlated with prognostic factors (age, tumor size, cancer grade, lymph node metastasis, ER, PR, and HER-2 receptor) as well as with the MRI findings, and to find differences in the mean pSUVs and ADCs according to the histologic grade of the cancer.
To investigate how histological diagnosis and grade correlated with the pSUVs and ADCs, a Pearson correlation analysis was performed. To analyze how the histologic grade of the breast cancer correlated with the ADCs and pSUVs, a linear regression analysis was performed.
Moreover, prognostic factors were subjected to multiple regression analysis to determine those that were independently associated with the mean ADCs and pSUVs. The level of statis- tical significance was set at p < 0.05.
RESULTS
Of the 94 lesions, 78 (83.0%) were identified as IDC, 13 (13.8%) as ductal carcinoma in situ (DCIS), 2 (2.1%) as invasive lobular carcinoma, and 1 (1.1%) as mucinous carcinoma. There were 10 cases of grade 1 lesions (12.8%), 23 cases of grade 2 lesions (29.5%), and 45 cases of grade 3 lesions (57.7%). As for the age distribution, 40 patients (42.6%) were ≤ 50 years old, whereas 54 patients (57.4%) were > 50 years old. Mean tumor size was 1.99 cm (range, 0.3–5.7 cm). Thirty-three tumors (35.1%) tested positive for lymph node metastasis, whereas 61 (64.9%) tested negative. Among the patients who underwent MRI, 13 had NMEs and 74 had mass lesions. The classification by internal enhancement revealed 39 homogeneous en- hancements, 13 heterogeneous enhancements, and 22 rim enhancements. The kinetic curve assessment showed that four lesions were slow and none were medium during the initial phase. Since most lesions exhibited a fast kinetic curve (83 lesions), a statistical analysis for the initial phase could not be performed. Moreover, during the delayed-phase kinetic curve as- sessment, 3, 28, and 56 lesions were classified as persistent, plateau, and washout, respectively.
A significant difference in mean pSUVs was found between tumors measuring ≤ 2 cm and
ADC: 0.76 A
D E
B C
Fig. 1. A 47-year-old woman with a 3.5-cm grade 3 invasive ductal carcinoma of the left breast with lymph node metastasis.
A. The axial contrast-enhanced T1-weighted gradient-echo image shows a heterogeneously enhancing irregular mass (arrow).
B. The diffusion-weighted imaging (b = 1000 mm2/s) shows diffusion restriction with a high signal intensity (arrow).
C. On the ADC map, the ADC value of the mass was 0.76 × 10⁻³ mm2/s.
D. On the axial PET/CT fusion image, the mass shows intense uptake with a peak standardized uptake value of 7.2.
E. Microscopical findings show rare tubule formation, marked variation of nuclear size and shape with frequent atypical mitosis. According to the Nottingham modification of the Scarff-Bloom-Richardson system, a histologic grade 3 was given (haematoxylin and eosin stain, × 200).
ADC = apparent diffusion coefficient
tumors measuring > 2 cm (2.74 and 6.99, respectively) (p = 0.001). No significant difference was found in mean ADCs according to tumor size (p = 0.270). Significant differences in mean ADCs and pSUVs were found according to the extent of lymph node metastasis (p = 0.013 and p = 0.001, respectively) (Figs. 1, 2). As for the MRI findings, mean ADCs were 0.92 × 10⁻³ mm2/s and 1.04 × 10⁻³ mm2/s for the mass and NME lesions, respectively (p = 0.043). There was a sig- nificant difference in mean pSUVs between round/oval shape mass lesions and irregular shape mass lesions (2.76 and 5.02, respectively) (p = 0.004). In the analysis of internal enhancement of the mass lesions, statistically significant differences were found in mean pSUVs between homogeneous enhancements and rim enhancements (p = 0.001).
The mean pSUV across all patients subjected to PET-CT was 4.50; it was 1.64 for DCIS and 5.05 for IDC. The mean pSUVs for IDC, according to histologic grade, were 1.60 for grade 1, 3.75 for grade 2, and 6.21 for grade 3. Mean pSUVs increased as the histologic grade in- creased, in a statistically significant fashion (p = 0.001). The mean ADC across all patients sub- jected to MRI was 0.94 × 10⁻³ mm2/s, whereas it was 1.11 × 10⁻³ mm2/s for DCIS and 0.89 × 10⁻³ mm2/s for IDC. The mean ADCs for IDC, according to histologic grade, were 0.93 × 10⁻³ mm2/s for grade 1, 0.92 × 10⁻³ mm2/s for grade 2, and 0.90 × 10⁻³ mm2/s for grade 3. Mean ADCs significantly decreased as the histologic grade increased (p = 0.017) (Fig. 3). In the analy- sis of hormone receptors, a significant difference was found in mean pSUVs between ER-neg- ative and ER-positive lesions (5.74 and 3.88, respectively) (p = 0.040). However, there was no significant difference in mean pSUVs and ADCs according to the expression level of other hormone receptors (PR and HER-2). The mean pSUVs of Luminal A and triple-negative breast Fig. 2. A 60-year-old woman with a 1-cm grade 1 invasive ductal carcinoma of the right breast without lymph node metastasis.
A. The axial contrast-enhanced T1-weighted gradient-echo image shows a mildly enhancing lesion (arrow).
B. The diffusion-weighted imaging (b = 1000 mm2/s) shows high signal intensity (arrow).
C. On the ADC map, the ADC value of the lesion was 1.32 × 10⁻³ mm2/s.
D. On the axial PET/CT fusion image, the mass shows mild uptake with a peak standardized uptake value of 1.6.
E. Most tumors show tubule formation and mild variation in nuclear size and shape, with rare mitotic figures. According to the Nottingham modification of the Scarff-Bloom-Richardson system, a histologic grade I was given (haematoxylin and eosin stain, × 200).
ADC = apparent diffusion coefficient
A B C
D E
ADC: 1.32
cancer were significantly different (3.44 and 6.74, respectively) (p = 0.028) (Tables 1, 2).
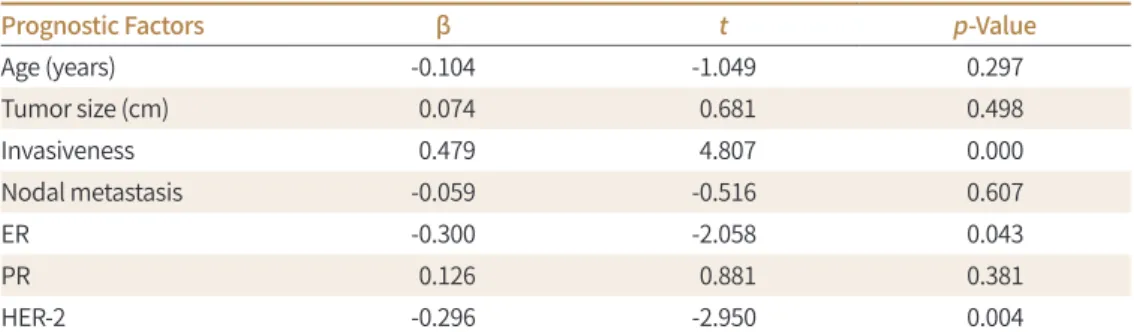
In the multivariate analysis, mean ADCs were significantly associated with invasiveness (p = 0.000), ER status (p = 0.043), and HER-2 expression status (p = 0.004). PSUVs were only significantly associated with tumor size (p = 0.000) (Tables 3, 4).
DISCUSSION
MRI is widely known as an imaging technique that plays an important role in the detec- tion, diagnosis, and staging of breast cancer (19-21). DWI, which is currently a popular focus of research, quantifies the magnitude of water diffusion in breast cancer lesions and express- es it as ADCs. PET-CT utilizes the high metabolic activity of tumors to distinguish between malignant and benign lesions and can thus be used for diagnosing and staging cancer, as well as for assessing relapse and treatment responses (22, 23).
In the current study, we analyzed how pSUVs of PET-CT and ADCs on DWI correlate with age, tumor size, lymph node metastasis, hormone receptors, histologic grade, and MRI find- ings.
Tumor size is an important prognostic factor for breast cancer and is associated with over- all survival (24, 25). In a multivariate analysis in our study, tumor size was significantly asso- ciated with mean pSUVs, but not with mean ADCs. Although the size standard used in this study slightly differed from those used in previous studies (in our study, lesions were classi- fied as ≤ 2 cm or > 2 cm), the results are similar to the majority of previous reports (12, 16, 17, 26). Conversely, Razek et al. (9) reported an association between mean ADC and tumor size; however, in their study, patients with tumors measuring < 1 cm were excluded, since those tumors were assumed to be difficult to detect on DWI.
Breast cancer grade is also closely associated with patient survival. In this study, significant differences were found in mean ADCs between lesions with various levels of invasiveness, Fig. 3. Distribution of ADCs, pSUVs, and pSUV/ADC values for DCIS and grade 1, 2, and 3 of IDC.
A. ADC values show a negative correlation with histologic grade (Pearson’s correlation coefficient = -0.317, p = 0.003).
B. pSUVs show a positive correlation with histologic grade (Pearson’s correlation coefficient = 0.428, p = 0.000).
C. pSUV/ADC values show a positive correlation with histologic grade (Pearson’s correlation coefficient = 0.470, p = 0.000).
ADC = apparent diffusion coefficient, DCIS = ductal carcinoma in situ, G1 = grade 1, G2 = grade 2, G3 = grade 3, IDC = invasive ductal carcinoma, pSUV = peak standardized uptake value
1.50 1.25 1.00 0.75 0.50
ADC value
DCIS IDC G1 IDC G2 IDC G3 Histologic grade
A 25
20 15 10 5
pSUV
DCIS IDC G1 IDC G2 IDC G3 Histologic grade
B 25
20 15 10 5
pSUV/ADC value
DCIS IDC G1 IDC G2 IDC G3 Histologic grade
C
Table 1. Association of ADC and pSUV with Pathological Factors in Breast Cancer
Prognostic Factors ADC pSUV
Lesion Number Value (× 10-3 mm2/s) Lesion Number Value Age (years)
≤ 50 33 0.98 ± 0.21 38 4.58 ± 3.74
> 50 54 0.91 ± 0.20 49 4.44 ± 4.06
p-value 0.123 0.872
Tumor size (cm)
≤ 2.0 53 0.96 ± 0.20 51 2.74 ± 1.61
> 2.0 34 0.90 ± 0.21 36 6.99 ± 4.41
p-value 0.952 0.000
Invasiveness
DCIS 12 1.11 ± 0.14 12 1.97 ± 1.18
IDC 72 0.89 ± 0.19 72 5.05 ± 4.02
p-value 0.000 0.001
Histologic grade of IDC
Grade 1 10 0.93 ± 0.15 7 1.60 ± 0.81
Grade 2 21 0.92 ± 0.22 21 3.75 ± 1.85
Grade 3 41 0.90 ± 0.18 44 6.21 ± 4.14
p-value 0.017 0.000
ER
Positive 57 0.92 ± 0.20 58 3.88 ± 4.02
Negative 30 0.96 ± 0.21 29 5.74 ± 3.73
p-value 0.348 0.040
PR
Positive 45 0.94 ± 0.21 45 3.94 ± 4.46
Negative 42 0.93 ± 0.21 42 5.10 ± 3.37
p-value 0.844 0.177
HER-2
Positive 29 0.87 ± 0.11 26 4.83 ± 2.21
Negative 58 0.97 ± 0.21 61 4.36 ± 3.91
p-value 0.052 0.624
Nodal metastasis
Positive 31 0.86 ± 0.19 29 6.99 ± 4.40
Negative 56 0.98 ± 0.21 58 3.25 ± 1.93
p-value 0.013 0.001
Immunohistochemical type
Luminal A 43 0.96 ± 0.20 44 3.44 ± 3.82
Luminal B 14 0.81 ± 0.18 14 5.24 ± 3.92
HER-2 enriched 15 0.94 ± 0.20 12 4.34 ± 3.28
Triple negative 15 0.99 ± 0.23 17 6.74 ± 4.28
p-value 0.074 0.028*
*Only Luminal A and triple-negative groups show significant differences, according to the Scheffe multiple- comparison test.
ADC = apparent diffusion coefficient, DCIS = ductal carcinoma in situ, ER = estrogen receptor, HER-2 = human epidermal growth factor receptor 2, IDC = invasive ductal carcinoma, PR = progesterone receptor, pSUV = peak standardized uptake value
Table 2. Association of ADC and pSUV with MRI Findings in Breast Cancer
MRI Findings ADC pSUV
Lesion Number Value (× 10-3 mm2/s) Lesion Number Value Mass or NME
Mass 74 0.9166 69 4.5609
NME 13 1.0422 11 2.3409
p-value 0.043 0.083
Mass shape
Round/oval 17 0.9094 14 2.7643
Irregular 57 0.9187 55 5.0182
p-value 0.871 0.004
Mass margin
Well-circumscribed 19 0.9392 18 3.7500
Not-circumscribed 55 0.9087 51 4.8471
p-value 0.580 0.329
Internal enhancement
Homogeneous 39 0.8991 35 2.6371
Heterogeneous 13 0.9346 12 4.6333
Rim enhancement 22 0.9368 22 7.5818
p-value 0.747 0.000
T2 signal intensity
High 60 0.9315 53 3.9972
Iso to low 27 0.9437 27 4.7630
p-value 0.420 0.865
Kinetics initial
Slow 4 0.7975 2 3.4500
Fast 83 0.9420 78 4.2763
p-value 0.302 0.757
Kinetics delayed
Persistent 3 0.9167 1 0.0
Plateu 28 0.9773 27 3.5389
Wash out 56 0.9154 52 4.7096
p-value 0.432 0.256
ADC = apparent diffusion coefficient, NME = non-mass enhancement, pSUV = peak standardized uptake value
Table 3. Multiple Regression Analysis Showing the Effects of Prognostic Factors on Mean ADCs
Prognostic Factors β t p-Value
Age (years) -0.104 -1.049 0.297
Tumor size (cm) 0.074 0.681 0.498
Invasiveness 0.479 4.807 0.000
Nodal metastasis -0.059 -0.516 0.607
ER -0.300 -2.058 0.043
PR 0.126 0.881 0.381
HER-2 -0.296 -2.950 0.004
ADC = apparent diffusion coefficient, ER = estrogen receptor, HER-2 = human epidermal growth factor recep- tor 2, PR = progesterone receptor
(i.e., between IDC and DCIS). In a study by Nakajo et al. (16), similar to our study, a signifi- cant difference in mean ADCs was found between IDC and DCIS; in contrast, there was no significant difference in mean pSUVs.
Numerous prior studies have reported that tumor cellularity is a factor that affects tumor grade and an in inverse correlation exists between mean ADCs and tumor cellularity (25, 27- 29). Since most tumors exhibit increased glucose metabolism as their size or histologic grade increases, FDG consumption consequently increases (15, 30, 31).
In our multivariate analysis on hormone receptors, ER and HER-2 receptor states were sig- nificantly associated with mean ADCs, whereas other receptors were not associated with mean ADCs and pSUVs. Choi et al. (11) found that mean ADCs and pSUVs were significantly higher for ER-negative tumors. Similarly, Ludovini et al. (32) reported that in ER-positive tu- mors, ER blocks the angiogenic pathway and reduces perfusion, thereby affecting ADCs. The results of the present study, although we found no significant differences in pSUVs, are large- ly identical to those of Choi et al. (11) and Ludovini et al. (32).
In the current study, mean pSUVs for ER-negative and ER-positive lesions significantly dif- fered from each other (5.74 and 3.88, respectively), and the same was observed for the pSUVs of Luminal A and triple-negative breast cancer (3.44 and 6.74, respectively). This is consistent with the results of a previous study. Baba et al. (17) also reported that mean pSUVs were sig- nificantly associated with triple-negative breast cancer. As the results of previous studies show, however, considerable variation regarding the relationship between hormone recep- tors and pSUVs or mean ADCs, large-scale research studies may be needed to further clarify this relationship.
In our current study, significant differences in pSUVs and ADCs were found according to the extent of lymph node metastasis; this is consistent with several previous findings (9, 10).
Chung et al. (33) evaluated mean ADCs of the lymph node itself and found that the mean ADC is useful for predicting metastatic axillar lymph nodes. However, in our multivariate study, neither mean ADCs nor pSUVs showed a statistically significant relationship with lymph node state, because the lymph node state is not an independent prognostic factor itself but, rather, is related to other prognostic factors.
This study has several limitations. First, the sample population was small (94 lesions). Of these, 78 (83.0%) were classified as IDC and 13 (13.8%) as DCIS; therefore, there were signifi- cantly fewer cases of DCIS than of IDC. Second, since this study was a retrospective study Table 4. Multiple Regression Analysis Showing the Effects of Prognostic Factors on pSUVs
Prognostic Factors β t p-Value
Age (years) -0.162 -1.642 0.105
Tumor size (cm) 0.507 4.592 0.000
Invasiveness -0.092 -0.983 0.329
Nodal metastasis 0.178 1.633 0.107
ER -0.156 -1.135 0.260
PR 0.049 0.368 0.714
HER-2 -0.097 -1.041 0.301
ER = estrogen receptor, HER-2 = human epidermal growth factor receptor 2, PR = progesterone receptor, pSUV = peak standardized uptake value
conducted at a single institution, there is a possibility of selection bias. Third, since most le- sions were histologically diagnosed as IDC and DCIS, the characteristics of other types of breast cancer [two cases of invasive lobular carcinoma (2.1%), and one case of mucinous car- cinoma (1.1%)] are not reflected in the results. Fourth, it was difficult to objectively measure mean ADCs on DWI. For instance, in the case of NMEs, there may be a lack of consistency be- tween measurements performed by different examiners. Lastly, because PET-CT was per- formed after all patients underwent histological examinations, an effect of the histological examinations on lesion behavior cannot be disregarded.
In conclusion, in this study, we found higher pSUVs for breast lesions of larger size and higher histologic grades, and lower ADCs on DWI for ER-positive breast lesions and lesions of higher histologic grades. These findings show that mean pSUVs of PET-CT and mean ADCs on DWI can help predict the prognosis of breast cancer. A comprehensive interpretation of DWI and PET-CT results may contribute to an improved accuracy of breast cancer diagnosis, histologic grading, and prognosis prediction, but it still has limitations. A larger-scale study is therefore needed.
Conflicts of Interest
The authors have no potential conflicts of interest to disclose.
REFERENCES
1. DeSantis CE, Bray F, Ferlay J, Lortet-Tieulent J, Anderson BO, Jemal A. International variation in female breast cancer incidence and mortality rates. Cancer Epidemiol Biomarkers Prev 2015;24:1495-1506 2. Harding C, Pompei F, Burmistrov D, Welch HG, Abebe R, Wilson R. Breast cancer screening, incidence, and
mortality across US counties. JAMA Intern Med 2015;175:1483-1489
3. Li J, Chen Z, Su K, Zeng J. Clinicopathological classification and traditional prognostic indicators of breast cancer. Int J Clin Exp Pathol 2015;8:8500-8505
4. Arul P, Masilamani S. Comparative evaluation of various cytomorphological grading systems in breast car- cinoma. Indian J Med Paediatr Oncol 2016;37:79-84
5. Runowicz CD, Leach CR, Henry NL, Henry KS, Mackey HT, Cowens-Alvarado RL, et al. American Cancer Soci- ety/American Society of Clinical Oncology breast cancer survivorship care guideline. CA Cancer J Clin 2016;
66:43-73
6. Baltzer PA, Benndorf M, Dietzel M, Gajda M, Runnebaum IB, Kaiser WA. False-positive findings at contrast- enhanced breast MRI: a BI-RADS descriptor study. AJR Am J Roentgenol 2010;194:1658-1663
7. Heusner TA, Kuemmel S, Koeninger A, Hamami ME, Hahn S, Quinsten, A, et al. Diagnostic value of diffusion- weighted magnetic resonance imaging (DWI) compared to FDG PET/CT for whole-body breast cancer stag- ing. Eur J Nucl Med Mol Imaging 2010;37:1077-1086
8. Kızıldag˘ Yırgın I·, Arslan G, Öztürk E, Yırgın H, Tas¸demir N, Gemici AA, et al. Diffusion weighted MR imaging of breast and correlation of prognostic factors in breast cancer. Balkan Med J 2016;33:301-307
9. Razek AA, Gaballa G, Denewer A, Nada N. Invasive ductal carcinoma: correlation of apparent diffusion coef- ficient value with pathological prognostic factors. NMR Biomed 2010;23:619-623
10. Kitajima K, Yamano T, Fukushima K, Miyoshi Y, Hirota S, Kawanaka Y, et al. Correlation of the SUVmax of FDG-PET and ADC values of diffusion-weighted MR imaging with pathologic prognostic factors in breast carcinoma. Eur J Radiol 2016;85:943-949
11. Choi BB, Kim SH, Kang BJ, Lee, JH, Song BJ, Jeong SH, et al. Diffusion-weighted imaging and FDG PET/CT:
predicting the prognoses with apparent diffusion coefficient values and maximum standardized uptake values in patients with invasive ductal carcinoma. World J Surg Oncol 2012;10:126
12. Karan B, Pourbagher A, Torun N. Diffusion-weighted imaging and 18F-fluorodeoxyglucose positron emission tomography/computed tomography in breast cancer: correlation of the apparent diffusion coefficient and
maximum standardized uptake values with prognostic factors. J Magn Reson Imaging 2016;43:1434-1444 13. Park SH, Choi HY, Hahn SY. Correlations between apparent diffusion coefficient values of invasive ductal car-
cinoma and pathologic factors on diffusion-weighted MRI at 3.0 Tesla. J Magn Reson Imaging 2015;41:175- 182
14. Krammer J, Schnitzer A, Kaiser CG, Buesing KA, Sperk E, Brade J, et al. 18F-FDG PET/CT for initial staging in breast cancer patients - Is there a relevant impact on treatment planning compared to conventional staging modalities? Eur Radiol 2015;25:2460-2469
15. Jadvar H, Alavi A, Gambhir SS. 18F-FDG uptake in lung, breast, and colon cancers: molecular biology corre- lates and disease characterization. J Nucl Med 2009;50:1820-1827
16. Nakajo M, Kajiya Y, Kaneko T, Kaneko Y, Takasaki T, Tani A, et al. FDG PET/CT and diffusion-weighted imaging for breast cancer: prognostic value of maximum standardized uptake values and apparent diffusion coeffi- cient values of the primary lesion. Eur J Nucl Med Mol Imaging 2010;37:2011-2020
17. Baba S, Isoda T, Maruoka Y, Kitamura Y, Sasaki M, Yoshida T, et al. Diagnostic and prognostic value of pre- treatment SUV in 18F-FDG/PET in breast cancer: comparison with apparent diffusion coefficient from diffu- sion-weighted MR imaging. J Nucl Med 2014;55:736-742
18. Fan YS, Casas CE, Peng J, Watkins M, Fan L, Chapman J, et al. HER2 FISH classification of equivocal HER2 IHC breast cancers with use of the 2013 ASCO/CAP practice guideline. Breast Cancer Res Treat 2016;155:457- 462
19. Orel SG. High-resolution MR imaging of the breast. Semin Ultrasound CT MR 1996;17:476-493 20. Kuhl CK. MRI of breast tumors. Eur Radiol 2000;10:46-58
21. Bartella L, Smith CS, Dershaw DD, Liberman L. Imaging breast cancer. Radiol Clin North Am 2007;45:45-67 22. Oshida M, Uno K, Suzuki M, Nagashima T, Hashimoto H, Yagata H, et al. Predicting the prognoses of breast
carcinoma patients with positron emission tomography using 2-deoxy-2-fluoro[18F]-D-glucose. Cancer 1998;82:2227-2234
23. Kitajima K, Miyoshi Y, Yamano T, Odawara S, Higuchi T, Yamakado K. Prognostic value of FDG-PET and DWI in breast cancer. Ann Nucl Med 2018;32:44-53
24. Elston CW, Ellis IO. Pathological prognostic factors in breast cancer. I. The value of histological grade in breast cancer: experience from a large study with long-term follow-up. Histopathology 1991;19:403-410 25. Elston CW, Ellis IO, Pinder SE. Pathological prognostic factors in breast cancer. Crit Rev Oncol Hematol 1999;
31:209-223
26. Park EK, Cho KR, Seo BK, Woo OH, Cho SB, Bae JW. Additional value of diffusion-weighted imaging to evaluate prognostic factors of breast cancer: correlation with the apparent diffusion coefficient. Iran J Ra- diol 2016;13:e33133
27. Hatakenaka M, Soeda H, Yabuuchi H, Matsuo Y, Kamitani T, Oda Y, et al. Apparent diffusion coefficients of breast tumors: clinical application. Magn Reson Med Sci 2008;7:23-29
28. Ulaner GA, Eaton A, Morris PG, Lilienstein J, Jhaveri K, Patil S, et al. Prognostic value of quantitative fluoro- deoxyglucose measurements in newly diagnosed metastatic breast cancer. Cancer Med 2013;2:725-733 29. Yoshikawa MI, Ohsumi S, Sugata S, Kataoka M, Takashima S, Mochizuki T, et al. Relation between cancer cel-
lularity and apparent diffusion coefficient values using diffusion-weighted magnetic resonance imaging in breast cancer. Radiat Med 2008;26:222-226
30. Rigo P, Paulus P, Kaschten BJ, Hustinx R, Bury T, Jerusalem G, et al. Oncological applications of positron emission tomography with fluorine-18 fluorodeoxyglucose. Eur J Nucl Med 1996;23:1641-1674
31. Kumar R, Chauhan A, Zhuang H, Chandra P, Schnall M, Alavi A. Clinicopathologic factors associated with false negative FDG-PET in primary breast cancer. Breast Cancer Res Treat 2006;98:267-274
32. Ludovini V, Sidoni A, Pistola L, Bellezza G, De Angelis V, Gori S, et al. Evaluation of the prognostic role of vas- cular endothelial growth factor and microvessel density in stages I and II breast cancer patients. Breast Cancer Res Treat 2003;81:159-168
33. Chung J, Youk JH, Kim JA, Gweon HM, Kim EK, Ryu YH, et al. Role of diffusion-weighted MRI: predicting ax- illary lymph node metastases in breast cancer. Acta Radiol 2014;55:909-916
유방암 예후 예측에 대한 확산강조영상의 현성 확산계수 값과 양전자방출단층촬영의 최대표준 섭취 계수의 유용성
강태선1 · 김금원1* · 김영중1 · 서재영1 · 조영준1 · 황철목1 · 이무식2
목적 유방 확산강조영상의 현성확산계수값과 양전자방출단층촬영의 최대표준섭취 계수와 유방암 예후 예측 인자 및 자기공명영상 소견과 상관관계가 있는지 알아보고자 하였다.
대상과 방법 조직검사상 유방암으로 진단되어 유방 자기공명영상, 양전자방출단층촬영 및 수 술을 시행한 82명 환자의 94례 유방암을 대상으로 후향적으로 연구를 진행하였다. 각 병변의 현성확산계수값, 최대표준섭취계수와 유방암 예후 인자(나이, 종양 크기, 유방암의 조직등 급, 호르몬 수용체 여부, 림프절 전이)와 자기공명영상 소견(모양, 경계, 내부조영증강, T2 강 조영상신호강도)과의 관계를 분석하였다.
결과 조직등급이 높은 병변과 림프절 전이가 있는 경우 현성확산계수값이 유의하게 낮았고, 최대표준섭취계수는 유의하게 높았다. 최대표준섭취계수는 종양 크기와 에스트로겐 호르몬 수용체와 상관관계가 있었고, 유방암의 불규칙한 형태와 테두리조영증강과 상관관계가 있 었다. 다변량 분석에서 평균현성확산계수값은 유방암의 침습성, 에스트로겐 호르몬 수용체 및 HER-2 발현 상태와 유의 한 관련이 있었다. 최대표준섭취계수는 종양 크기와 유의 한 관 련이 있었다.
결론 유방 확산강조영상의 현성확산계수값과 양전자방출단층촬영의 최대표준섭취 계수는 유방암 예후를 예측하는데 도움이 되었다.
건양대학교병원 1영상의학과, 2예방의학과