Discrimination between Lumbar Intraspinal Stenosis and Foraminal Stenosis using Diffusion Tensor Imaging Parameters: Preliminary Results
Yawara Eguchi
1, Seiji Ohtori
2, Munetaka Suzuki
1, Yasuhiro Oikawa
3, Hajime Yamanaka
1, Hiroshi Tamai
1, Tatsuya Kobayashi
1, Sumihisa Orita
2, Kazuyo Yamauchi
2, Miyako Suzuki
2,
Yasuchika Aoki
4, Atsuya Watanabe
4, Hirohito Kanamoto
2, Kazuhisa Takahashi
21Department of Orthopaedic Surgery, National Hospital Organization Shimoshizu National Hospital, Yotsukaido, Japan
2Department of Orthopaedic Surgery, Graduate School of Medicine, Chiba University, Chiba, Japan
3Division of Orthopaedic Surgery, Chiba Children’s Hospital, Chiba, Japan
4Department of Orthopaedic Surgery, Eastern Chiba Medical Center, Chiba, Japan
Study Design: Retrospective observational study.
Purpose: To examine fractional anisotropy (FA) values and apparent diffusion coefficient (ADC) values of damaged nerves to discrimi- nate between lumbar intraspinal stenosis (IS) and foraminal stenosis (FS) using diffusion tensor imaging (DTI)
Overview of Literature: It is important in the selection of surgical procedure to discriminate between lumbar IS and FS, but such discrimination is difficult.
Methods: There were 9 cases of IS, 7 cases of FS, and 5 healthy controls. The regions of interest were established in the lumbar in- traspinal zone (Iz), nerve root (N), and extraforaminal zone (Ez). The FA and ADC values were measured on the affected and unaffected sides of the nerves. The FA ratio and the ADC ratio were calculated as the affected side/unaffected side ×100 (%).
Results: In the Ez, the FA value was significantly lower in FS than in IS (p<0.01). FA ratio was significantly lower in FS than in IS for the Ez (p<0.01). In the Iz, the ADC value was significantly higher in IS than FS (p<0.01). ADC ratio was significantly higher in FS than in IS for the N and Ez (p<0.05). For the Ez, receiver operating characteristic analysis of parameters revealed that the FA values showed a higher accuracy for the diagnosis of FS than the ADC values, and the FA value cut-off value was 0.42 (sensitivity: 85.7%, false posi- tive: 11.1%) and the FA ratio cut-off value was 83.9% (sensitivity: 85.7%, false positive: 22.2%).
Conclusions: The low FA value in the extraforaminal zone suggests the presence of foraminal stenosis. When the FA value and FA ratio cut-off value were established as 0.42 and 83.9%, respectively, the accuracy was high for the diagnosis of foraminal stenosis. It may be possible to use DTI parameters to help in the discrimination between IS and FS.
Keywords: Diffusion tensor imaging; Lumbar foraminal stenosis; Apparent diffusion coefficient; Fractional anisotropy
Copyright Ⓒ 2016 by Korean Society of Spine Surgery
This is an Open Access article distributed under the terms of the Creative Commons Attribution Non-Commercial License (http://creativecommons.org/licenses/by-nc/3.0/) which permits unrestricted non-commercial use, distribution, and reproduction in any medium, provided the original work is properly cited.
Asian Spine Journal • pISSN 1976-1902 eISSN 1976-7846 • www.asianspinejournal.org
Received Aug 13, 2015; Revised Sep 24, 2015; Accepted Sep 24, 2015 Corresponding author: Yawara Eguchi
Department of Orthopaedic Surgery, Shimoshizu National Hospital, 934-5, Shikawatashi, Yotsukaido, Chiba 284-0003, Japan
Tel.: +81-43-422-2511; Fax: +81-43-421-3007, E-mail: [email protected]
ASJ A SJ
Introduction
Diffusion-weighted imaging (DWI) is a magnetic reso-
nance imaging (MRI) technique that depicts movements of water molecules, such as diffusion. The images are ob- tained by applying a motion probing gradient (MPG) in
certain directions relative to proton diffusion [1-4]. In the diagnosis of acute cerebral infarction [5], DWI is indis- pensable and widely-used in current clinical practice [6,7].
DWI shows the ease of diffusion of water molecules and the direction of diffusion. In nerve fibers, axonal mem- branes and myelin sheaths hinder diffusion along nerve fiber bundles, resulting in the loss of isotropy of water molecules. This state is called anisotropy, and tractogra- phy and diffusion tensor imaging (DTI) selectively record this information.
Fractional anisotropy (FA) is an index representing the level of anisotropy and is expressed on a scale of 0 to 1.
FA values closer to 1 indicate stronger anisotropy and 0 indicates complete isotropic diffusion. In recent years,
the usefulness of DTI has been reported in demyelinat- ing degenerative disorders, such as multiple sclerosis, and in chronic compressive peripheral neuropathies, such as carpal tunnel syndrome. The usefulness of DTI has also been reported in spinal regions. However, DTI tends to be affected more by magnetic susceptibility in the spine and spinal cord than in the head [8].Thus, its clinical applica- tion is limited in the spine and spinal cords.
In myelinated nerves in tissues, diffusion of water molecules is restricted along the nerve fibers because of myelin sheaths, and there is high diffusion anisotropy.
However, FA values have been reported to decrease due to decreased anisotropy, resulting from demyelination and degeneration associated with nerve injuries, including the
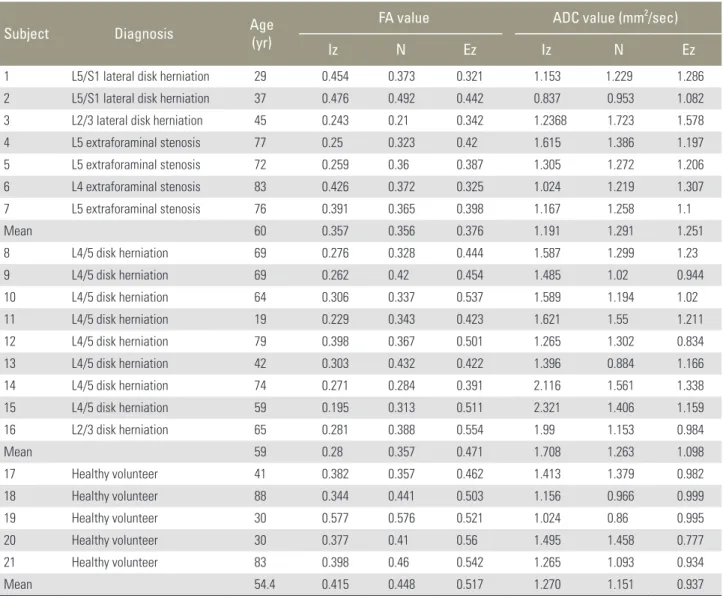
Table 1. DTI parameters of the patients and healthy volunteers
Subject Diagnosis Age
(yr)
FA value ADC value (mm2/sec)
Iz N Ez Iz N Ez
1 L5/S1 lateral disk herniation 29 0.454 0.373 0.321 1.153 1.229 1.286
2 L5/S1 lateral disk herniation 37 0.476 0.492 0.442 0.837 0.953 1.082
3 L2/3 lateral disk herniation 45 0.243 0.21 0.342 1.2368 1.723 1.578
4 L5 extraforaminal stenosis 77 0.25 0.323 0.42 1.615 1.386 1.197
5 L5 extraforaminal stenosis 72 0.259 0.36 0.387 1.305 1.272 1.206
6 L4 extraforaminal stenosis 83 0.426 0.372 0.325 1.024 1.219 1.307
7 L5 extraforaminal stenosis 76 0.391 0.365 0.398 1.167 1.258 1.1
Mean 60 0.357 0.356 0.376 1.191 1.291 1.251
8 L4/5 disk herniation 69 0.276 0.328 0.444 1.587 1.299 1.23
9 L4/5 disk herniation 69 0.262 0.42 0.454 1.485 1.02 0.944
10 L4/5 disk herniation 64 0.306 0.337 0.537 1.589 1.194 1.02
11 L4/5 disk herniation 19 0.229 0.343 0.423 1.621 1.55 1.211
12 L4/5 disk herniation 79 0.398 0.367 0.501 1.265 1.302 0.834
13 L4/5 disk herniation 42 0.303 0.432 0.422 1.396 0.884 1.166
14 L4/5 disk herniation 74 0.271 0.284 0.391 2.116 1.561 1.338
15 L4/5 disk herniation 59 0.195 0.313 0.511 2.321 1.406 1.159
16 L2/3 disk herniation 65 0.281 0.388 0.554 1.99 1.153 0.984
Mean 59 0.28 0.357 0.471 1.708 1.263 1.098
17 Healthy volunteer 41 0.382 0.357 0.462 1.413 1.379 0.982
18 Healthy volunteer 88 0.344 0.441 0.503 1.156 0.966 0.999
19 Healthy volunteer 30 0.577 0.576 0.521 1.024 0.86 0.995
20 Healthy volunteer 30 0.377 0.41 0.56 1.495 1.458 0.777
21 Healthy volunteer 83 0.398 0.46 0.542 1.265 1.093 0.934
Mean 54.4 0.415 0.448 0.517 1.270 1.151 0.937
DTI, diffusion tensor imaging; FA, fractional anisotropy; ADC, apparent diffusion coefficient; Iz, intraspinal zone; N,, nerve root; Ez, extraforaminal zone.
spinal cord and peripheral nerve injury [9-12].
Lumbar foraminal stenosis is a disease where entrap- ment of the nerve roots and lumbar nerves occur in the intra- and extraforaminal regions due to degenerative changes of the spine [13]. There are pain receptors in the dorsal root ganglion at the affected site, and the intense leg pain that develops is intractable. Macnab [14]intro- duced the term “hidden zone” to describe this area, which can be easily missed even in the present clinical setting with advanced diagnostic imaging. Therefore, it can cause the worsening of surgical outcomes. Current MRI has difficulty in establishing the diagnosis of extraforaminal stenosis, such as that affecting the lumbar nerve roots and brachial plexus arising from the spinal cord.
Diseases that cause L5 neuropathy are L4/5 canal ste- nosis (disk herniation) with L5 nerve compression and L5 nerve compression with extraforaminal stenosis at L5/
S1. In such cases, L5 nerve roots can be compressed at both sides (double lesion syndrome). In the selection of surgical procedure, it is important to accurately diagnose whether the compressive lesion is intraspinal or forami- nal. Conventional MRI has been reported to produce false positives in 30% to 40% of lumbar foraminal stenosis cases. So, this is a difficult condition to diagnose and a new diagnostic imaging method is desirable [15].To date, there have been only a few reports of DTI in the lumbar nerve root [16-19]. We have previously reported in DTI studies that the tract is interrupted in the stenosed area in patients with lumbar foraminal stenosis and that the FA values become low, and that DTI canreduce the false- positive rate compared with conventional MRI [15,20].
This study used DTI to examine DTI parameters of FA and apparent diffusion coefficient (ADC) in intraspinal stenosis (IS) and foraminal stenosis (FS), and determined the diagnostic accuracy of these parameters for FS, such as cut-off value, sensitivity, and false positive rate.
Materials and Methods
There were 9 cases of IS (all lumbar disk herniation; mean age, 59 years), 7 cases of FS comprising 4 cases of lumbar foraminal stenosis and 3 cases of lateral disk herniation (mean age, 60 years), and 5 healthy controls (mean age, 54 years). Endoscopic surgery was performed for diagnosis on those with stenosis. DTI was performed preopera- tively using an Achiva 1.5 T MRI system (Philips). Table 1 presents the DTI parameters of patients and healthy vol-
unteers. The patient exclusion criteria were lumbar spinal instrumentation after surgery, multiple levels of lumbar canal stenosis, myelopathy, and spinal tumor, infectious disease, or spinal trauma.
Motion probing gradients (MPGs) in 15 axes and the b-value of 800 sec/mm2 were used. The DTI images were obtained using an imaging sequence with the array special sensitivity encoding technique (factor: 2), chemical shift selective, echo planar imaging, repetition time: 6,000 ms, echo time: 76 ms, axial slice orientation, 3/0 mm slice thickness/gap, 320×256 mm field of view (FOV), 96×192 matrix, and 50 signals averaged. Imaging was performed for 10 minutes.
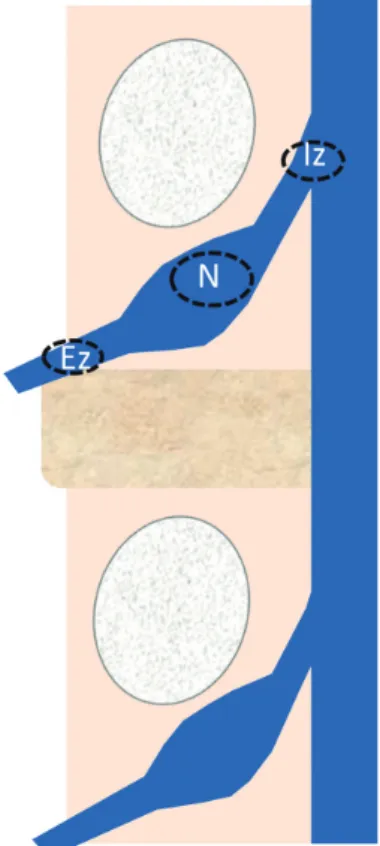
Region of interest (ROIs) were established in the intra- spinal zone (Iz), nerve root (N), and extraforaminal zone (Ez) (Fig. 1). FA and ADC values were measured on the affected and unaffected sides of the nerves. The FA ratio was calculated as the affected side/unaffected side ×100 (%) and the ADC ratio was calculated as the affected side/
unaffected side ×100 (%). Student’s t-test was used to compare between groups, with the significance level set at
Fig. 1. The regions of interest were placed in the intraspinal zone (Iz), nerve root (N), and extraforaminal zone (Ez). The fractional anisotropy and apparent diffusion coefficient values were measured on the af- fected and unaffected sides of the nerves.
0.05. A receiver operating characteristic (ROC) curve was used to examine the diagnostic accuracy and cut-off value of extraforaminal parameters.
Results
In IS, the FA value was 0.280±0.019, 0.357±0.016, and 0.471±0.019 for the intraspinal zone (Iz), nerve root (N), and extraforaminal zone (Ez), respectively. The FA value was 0.357±0.039, 0.356±0.031, and 0.376±0.018, respectively, in FS and 0.436±0.021, 0.441±0.017, and 0.520±0.020, respectively, in the controls. The FA value of the Ez was significantly lower in FS than in IS (p<0.01).
In IS, the ADC value was 1.708±0.118 mm2/sec, 1.263±0.076 mm2/sec, and 1.098±0.054 mm2/sec for the
Iz, N, and Ez, respectively. The ADC value was 1.191±0.091 mm2/sec, 1.291±0.087 mm2/sec, and 1.251±0.063 mm2/ sec, respectively, in FS and 1.280±0.109 mm2/sec, 1.092±0.045 mm2/sec, and 0.924±0.046 mm2/sec, respec- tively, in the controls. The ADC value of the Iz was signifi- cantly higher in IS than in FS (p<0.01) (Fig. 2).
In IS, the FA ratios were 64.1%±4.3%, 86.9%±4.6%, and 92.0%±4.0% for the Iz, N, and Ez, respectively. In FS, the FA ratios were 84.8%±7.2%, 74.8%±4.3%, and 72.8%±4.3%, respectively. In the Iz, the FA ratio was sig- nificantly lower in IS than in FS (p<0.05). In the Ez, the FA ratio was significantly lower in FS than in IS (p<0.01).
In IS, the ADC ratios were 128.5%±9.0%, 109.6%±4.4%, and 117.1%±5.6% for the Iz, N, and Ez, respectively. In FS, the ADC ratios were 116.6%±20.1%, 128.0%±4.2%, and
Fig. 2. FA and ADC values. The FA value of the Ez was significantly lower in FS than in IS (p<0.01). The ADC value of the Iz was significantly higher in IS than in FS (p<0.01). FA, fractional anisotropy; ADC, apparent diffusion coefficient; Ez, extraforaminal zone; FS, foraminal steno- sis; IS, intraspinal stenosis; Iz, intraspinal zone; FS, foraminal stenosis; Cont, control.
Fig. 3. Intraspinal stenosis (IS) and extraforaminal stenosis (FS) values. In the intraspinal zone (Iz), the fractional anisotropy (FA) ratio was significantly lower in IS than in FS (p<0.05). The apparent diffusion coefficient (ADC) ratio was significantly higher in FS than in IS for the nerve root (N) (p<0.05) and extraforaminal zone (Ez) (p<0.05). Cont, control.
147.4%±13.9%, respectively. The ADC ratio was signifi- cantly higher in FS than in IS for the N (p<0.05) and Ez (p<0.05) (Fig. 3).
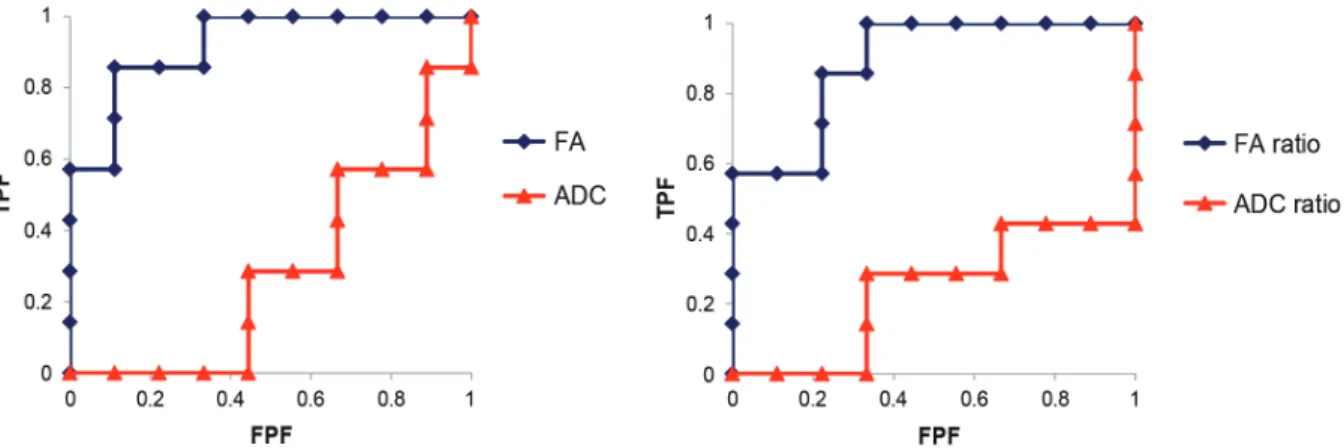
For the Ez, ROC analysis of parameters revealed greater accuracy of FA values for the diagnosis of FS than ADC values. The FA value cut-off value was 0.42 (sensitivity:
85.7%, false positive rate: 11.1%, and odds ratio: 48) and the FA ratio cut-off value was 83.9% (sensitivity: 85.7%, false positive rate: 22.2%, and odds ratio: 21) (Fig. 4).
1. Case presentation
A 77-year-old woman (case 4 in Table 1) had L4–5 lami- nectomy for lumbar spinal stenosis of L4-5 one year pre- viously. She experienced low-back pain and left calf pain in the fifth lumbar dermatome 3 months after the first surgery, with subsequent worsening of pain and numb- ness. Diagnostic images, including plain radiographs, computed tomography (CT) (Fig. 5A), and MRI revealed
Fig. 4. For the exraforaminal zone, receiver operating characteristic analysis of parameters revealed that the FA values showed a higher accuracy for the diagnosis of extraforaminal stenosis than the ADC values. FA, fractional anisotropy; ADC, apparent diffusion coefficient;
TPF, true positive fraction; FPF, false positive fraction.
Fig. 5. Presurgical (A) and postsurgical (B, C) computed tomography and image of endoscopic intrapedicular partial pediculotomy surgery (D) of a 77-year-old woman with L5 foraminal stenosis on the left side. (B, C) Arrows indicate pediculotomy. (D) Arrowhead indicates decompressed L5 roots.
D
A B C
L5 foraminal stenosis on the left side. Selective fifth nerve root block performed using 1 mL of 1% lidocaine relieved the pain in the left calf. FA values were 0.25, 0.323, and 0.420 for Iz, N, and Ez, respectively. FA ratios in the same respective order were 61.3%, 78.6%, and 79.8%. A low FA value was observed in the extraforaminal zone. Micro- endoscopic intrapedicular partial pediculotomy [21]was performed and L5 roots were decompressed (Fig. 5B–
D). The Japanese Orthopedic Association score improved from 11 points to 24 points (normal score is 29 points).
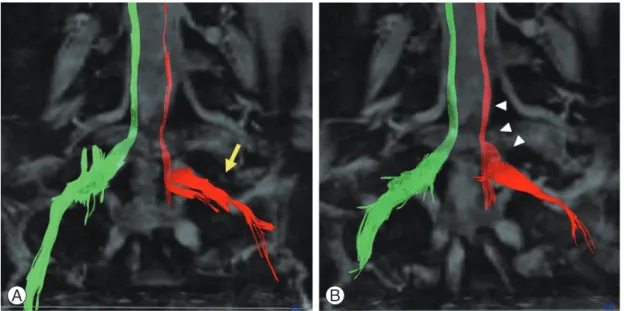
Fig. 6 shows diffusion tensor tractography of bilateral L5 roots. On the entrapment side of the left L5 root, nerve tracts were disrupted (Fig. 6A). Three months after de- compressed surgery, the nerve tracts had increased and improved (Fig. 6B).
Discussion
Appropriately named the “hidden zone” by Macnab [14], lumbar foraminal stenosis is often overlooked, accounts for approximately 60% of failed back surgery syndromes, and plays a major role in lowering surgical success rates [13]. Plain radiography, CT, and MRI [22-24] are use- ful in diagnostic imaging of lumbar foraminal stenosis, but false positive results are common. Thus, diagnosis is made comprehensively by a combination of selective radiculography and nerve root block [25].The usefulness of 3D-CT, MR myelography [26], and 3D-MRI [27]has
been reported. However, there is no diagnostic method to effectively determine the cause of L5 neuropathy, be that L4/5 canal stenosis, L5/S1 FS, or double lesions. When L5 nerve distal latency was measured in an electrophysiologi- cal study, latency was longer for extraforaminal stenosis than for intraspinal stenosis, enabling their discrimina- tion [28]. However, this method is invasive and there is no non-invasive diagnostic method.
We have previously reported in DTI studies that the tract is interrupted in patients with lumbar FS and that the FA values become low [15]. Presently, ROIs were es- tablished at three sites: intraspinal zone, nerve root, and extraforaminal zone. A detailed examination was per- formed on DTI parameters of FA and ADC values. Gen- erally, increased ADC may be due to inflammation or oe- dema, whereas decreased FA may reflect damaged tissue microstructure, demyelination, axonal loss, or increase in isotropic water volume. The changes in DTI param- eters indicating neuropathy were dependent on the site of nerve compression. These changes (low FA value and high ADC value) were marked in the intraspinal zone for IS and in the extraforaminal zone for FS. In addition, the FA value showed higher accuracy than the ADC value in the extraforaminal zone and the low FA value suggested the presence of FS. When the FA value and FA ratio cut-off values were established as 0.42% and 83.9%, respectively, in the extraforaminal zone, the false positive rate was low for the diagnosis of extraforaminal stenosis. The results
Fig. 6. Diffusion tensor tractography of bilateral L5 roots. (A) On the entrapment side of the left L5 root, nerve tracts were seen to be disrupted (arrow). (B) Three months after decompressed surgery, nerve tracts had increased and improved (arrowhead).
A B
indicate that these parameters can help in the discrimina- tion between IS and FS.
There have not been many reports on DTI of lumbar nerve roots [16-19]. Balbi et al. [16] used Fiber Viewer to continuously measure parameters along fiber bundles in cases of neuropathy due to disk herniation. They reported a sharp drop in the FA values and an increase in ADC val- ues in the compressed areas. These results are consistent with ours. Electrophysiology studies can analyze nerve function, however the approach is invasive. We previ- ously reported that no abnormalities of either amplitude or nerve conduction velocity were observed in the tibial or peroneal nerves in patients with L5 foraminal steno- sis [29]. Nerve conduction tests are used to detect nerve conduction disorders peripheral to the knee, but lumbar nerve injuries are localized to the spinal canal, and if Waller degeneration does not extend to the region below the knee, then there is the possibility of false-negative findings. DTI may reveal the local lumbar nerve damage.
There are several limitations of our study. There were a small number of cases. IS cases were disc herniation cases and canal stenosis cases were not examined. Improved resolution and sequence development are needed for lum- bar nerve imaging because DTI is prone to artifacts. Fur- ther studies are necessary with a larger number of cases.
Conclusions
This study examined the usefulness of DTI in the dis- crimination between lumbar IS and FS. The changes in DTI parameters indicating neuropathy were dependent on the site of nerve compression. These changes (low FA value and high ADC value) were marked in the nerve root and the extraforaminal zone for FS. In addition, the FA value was more accurate than the ADC value in the extra- foraminal zone. Low FA value suggested the presence of FS. We anticipate that the diagnosis of FS can be made by a detailed examination of DTI parameters.
Conflict of Interest
No potential conflict of interest relevant to this article was reported.
References
1. Basser PJ, Jones DK. Diffusion-tensor MRI: theory,
experimental design and data analysis: a technical review. NMR Biomed 2002;15:456-67.
2. Beaulieu C, Allen PS. Determinants of anisotropic water diffusion in nerves. Magn Reson Med 1994;31:
394-400.
3. Beaulieu C, Does MD, Snyder RE, Allen PS. Changes in water diffusion due to Wallerian degeneration in peripheral nerve. Magn Reson Med 1996;36:627-31.
4. Basser PJ, Pierpaoli C. Microstructural and physi- ological features of tissues elucidated by quantitative- diffusion-tensor MRI. J Magn Reson B 1996;111:209- 19.
5. Minematsu K, Li L, Fisher M, Sotak CH, Davis MA, Fiandaca MS. Diffusion-weighted magnetic reso- nance imaging: rapid and quantitative detection of focal brain ischemia. Neurology 1992;42:235-40.
6. Lin X, Tench CR, Morgan PS, Constantinescu CS.
Use of combined conventional and quantitative MRI to quantify pathology related to cognitive impair- ment in multiple sclerosis. J Neurol Neurosurg Psy- chiatry 2008;79:437-41.
7. Mamata H, Jolesz FA, Maier SE. Apparent diffusion coefficient and fractional anisotropy in spinal cord:
age and cervical spondylosis-related changes. J Magn Reson Imaging 2005;22:38-43.
8. Fujiyoshi K, Yamada M, Nakamura M, et al. In vivo tracing of neural tracts in the intact and injured spi- nal cord of marmosets by diffusion tensor tractogra- phy. J Neurosci 2007;27:11991-8.
9. Khalil C, Hancart C, Le Thuc V, Chantelot C, Chechin D, Cotten A. Diffusion tensor imaging and tractography of the median nerve in carpal tunnel syndrome: preliminary results. Eur Radiol 2008;18:
2283-91.
10. Lehmann HC, Zhang J, Mori S, Sheikh KA. Diffusion tensor imaging to assess axonal regeneration in pe- ripheral nerves. Exp Neurol 2010;223:238-44.
11. Takagi T, Nakamura M, Yamada M, et al. Visualiza- tion of peripheral nerve degeneration and regenera- tion: monitoring with diffusion tensor tractography.
Neuroimage 2009;44:884-92.
12. Mac Donald CL, Dikranian K, Bayly P, Holtzman D, Brody D. Diffusion tensor imaging reliably detects experimental traumatic axonal injury and indicates approximate time of injury. J Neurosci 2007;27:
11869-76.
13. Jenis LG, An HS. Spine update. Lumbar foraminal
stenosis. Spine (Phila Pa 1976) 2000;25:389-94.
14. Macnab I. Negative disc exploration: an analysis of the causes of nerve-root involvement in sixty-eight patients. J Bone Joint Surg Am 1971;53:891-903.
15. Eguchi Y, Ohtori S, Orita S, et al. Quantitative evalu- ation and visualization of lumbar foraminal nerve root entrapment by using diffusion tensor imaging:
preliminary results. AJNR Am J Neuroradiol 2011;32:
1824-9.
16. Balbi V, Budzik JF, Duhamel A, Bera-Louville A, Le Thuc V, Cotten A. Tractography of lumbar nerve roots: initial results. Eur Radiol 2011;21:1153-9.
17. van der Jagt PK, Dik P, Froeling M, et al. Architec- tural configuration and microstructural properties of the sacral plexus: a diffusion tensor MRI and fiber tractography study. Neuroimage 2012;62:1792-9.
18. Budzik JF, Verclytte S, Lefebvre G, Monnet A, Forzy G, Cotten A. Assessment of reduced field of view in diffusion tensor imaging of the lumbar nerve roots at 3 T. Eur Radiol 2013;23:1361-6.
19. Dallaudiere B, Lincot J, Hess A, et al. Clinical rel- evance of diffusion tensor imaging parameters in lumbar disco-radicular conflict. Diagn Interv Imag- ing 2014;95:63-8.
20. Kitamura M, Eguchi Y, Inoue G, et al. A case of symptomatic extra-foraminal lumbosacral stenosis (“far-out syndrome”) diagnosed by diffusion tensor imaging. Spine (Phila Pa 1976) 2012;37:E854-7.
21. Ozeki N, Aota Y, Uesugi M, et al. Clinical results of intrapedicular partial pediculectomy for lumbar fo- raminal stenosis. J Spinal Disord Tech 2008;21:324-7.
22. Hasegawa T, An HS, Haughton VM, Nowicki BH.
Lumbar foraminal stenosis: critical heights of the intervertebral discs and foramina. A cryomicrotome study in cadavera. J Bone Joint Surg Am 1995;77:32- 8.
23. Kirkaldy-Willis WH, Wedge JH, Yong-Hing K, Tchang S, de Korompay V, Shannon R. Lumbar spi- nal nerve lateral entrapment. Clin Orthop Relat Res 1982;(169):171-8.
24. Vanderlinden RG. Subarticular entrapment of the dorsal root ganglion as a cause of sciatic pain. Spine (Phila Pa 1976) 1984;9:19-22.
25. Herron LD. Selective nerve root block in patient se- lection for lumbar surgery: surgical results. J Spinal Disord 1989;2:75-9.
26. Krudy AG. MR myelography using heavily T2- weighted fast spin-echo pulse sequences with fat pre- saturation. AJR Am J Roentgenol 1992;159:1315-20.
27. Yamada H, Terada M, Iwasaki H, et al. Improved accuracy of diagnosis of lumbar intra and/or extra- foraminal stenosis by use of three-dimensional MR imaging: comparison with conventional MR imaging.
J Orthop Sci 2015;20:287-94.
28. Ando M, Tamaki T, Kawakami M, et al. Electrophysi- ological diagnosis using sensory nerve action po- tential for the intraforaminal and extraforaminal L5 nerve root entrapment. Eur Spine J 2013;22:833-9.
29. Eguchi Y, Ohtori S, Suzuki M, et al. Diagnosis of lum- bar foraminal stenosis using diffusion tensor imag- ing: a case report. Asian Spine J. Forthcoming 2016.