839 https://e-kcj.org
ABSTRACT
Background and Objectives: Macitentan (MAC) reduces morbidity and mortality among advanced-stage pulmonary arterial hypertension (PAH) patients. However, data regarding the histopathologic and hemodynamic benefits of MAC treatment at an early stage of PAH is lacking.
Methods: One week after monocrotaline (MCT) injection, rats were randomly assigned to MAC (n=16), MAC combined with sildenafil (SIL) (MAC+SIL, n=16), or normal saline (MCT, n=16). Twelve sham rats (Sham) were included for comparison. Right ventricular (RV) systolic function was assessed via echocardiography as the RV fractional area change (RV-FAC). An invasive pressure-volume analysis using a Millar conductance catheter was performed 7 weeks after MCT injection. Rats were subsequently euthanized for histopathologic analysis.
Results: RV-right atrial pressure gradient on echocardiography was significantly increased 3 weeks after MCT injection, but was maintained in the Sham. RV-FAC was less deteriorated in the MAC, compared to that in the MCT (44±3% vs. 25±7%, p<0.05), and the co-
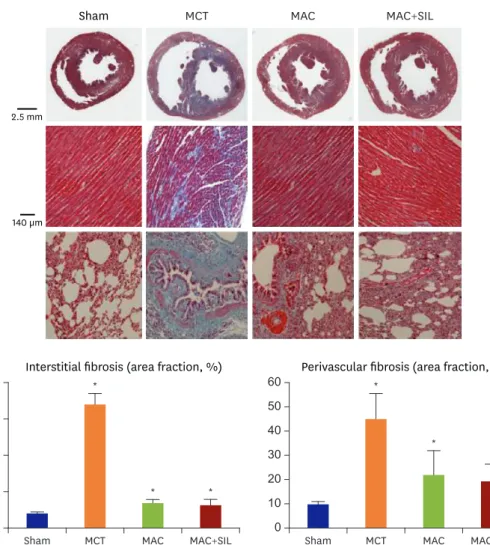
administration of SIL showed no additional benefit (45±8%, p>0.05 vs. the MAC). On invasive hemodynamic analyses, RV end-systolic (196±78 µL) and end-diastolic volumes (310±86 µL), pulmonary artery systolic pressure (89±7.2 mmHg), and end-systolic pressure- volume relationship (−254±25.1) were significantly worse in the MCT vs. in the MAC (101±45 µL, 235±55 µL, 40±10.5 mmHg, and −145±42.1, respectively) and MAC+SIL (109±47 µL, 242±46 µL, 38±9.2 mmHg, and −151±39.2, respectively) (all p<0.05). However, the MAC and MAC+SIL did not differ (all p>0.05). On histopathology, both RV and lung fibrosis were significantly reduced in the MAC and MAC+SIL vs. in the MCT (all p<0.05); the 2 treatment groups did not differ.
Conclusions: MAC treatment at an earlier stage significantly attenuated experimental PAH progression hemodynamically and histopathologically.
Keywords: Macitentan; Pulmonary hypertension; Hemodynamics; Pathology
Original Article
Received: Nov 12, 2017 Revised: Feb 28, 2018 Accepted: Mar 14, 2018 Correspondence to Hyung-Kwan Kim, MD, PhD
Division of Cardiology, Department of Internal Medicine, Cardiovascular Center, Seoul National University Hospital, Seoul National University College of Medicine, 101, Daehak-ro, Jongno-gu, Seoul 03080, Korea.
E-mail: [email protected] [email protected]
Copyright © 2018. The Korean Society of Cardiology
This is an Open Access article distributed under the terms of the Creative Commons Attribution Non-Commercial License (https://
creativecommons.org/licenses/by-nc/4.0) which permits unrestricted noncommercial use, distribution, and reproduction in any medium, provided the original work is properly cited.
ORCID iDs Kyung-Hee Kim
https://orcid.org/0000-0003-0708-8685 Hyung-Kwan Kim
https://orcid.org/0000-0001-7950-2131 Stephen Y. Chan
https://orcid.org/0000-0002-9520-7527 Yong-Jin Kim
https://orcid.org/0000-0002-1366-432X Dae-Won Sohn
https://orcid.org/0000-0002-1092-3285 Funding
This research was funded by Korea Society of Echocardiography research fund (2014).
Kyung-Hee Kim , MD, PhD 1,2 , Hyung-Kwan Kim , MD, PhD 2 , Stephen Y. Chan , MD, PhD 3 , Yong-Jin Kim , MD, PhD 2 , and Dae-Won Sohn , MD, PhD 2
1
Division of Cardiology, Department of Internal Medicine, Sejong General Hospital, Bucheon, Korea
2
Division of Cardiology, Department of Internal Medicine, Cardiovascular Center, Seoul National University Hospital, Seoul National University College of Medicine, Seoul, Korea
3
Pittsburgh Heart, Lung, Blood, and Vascular Medicine Institute, Division of Cardiology, Department of Medicine, University of Pittsburgh Medical Center (UPMC) and University of Pittsburgh School of Medicine, Pittsburgh, PA, USA
Hemodynamic and Histopathologic Benefits of Early Treatment with Macitentan in a Rat Model of
Pulmonary Arterial Hypertension
Conflict of Interest
S.Y.C. acknowledges a consultancy role for Gilead, Actelion, Pfizer, and Vivus. S.Y.C.
acknowledges pending research grant contracts with Actelion, Gilead, and United Therapeutics.
Author Contributions
Conceptualization: Kim HK; Data curation:
Kim HK, Kim HK; Formal analysis: Kim HK;
Investigation: Kim HK; Project administration:
Kim HK; Supervision: Kim HK; Validation:
Kim HK, Kim YJ, Chan SY, Sohn DW; Writing - original draft: Kim HK; Writing - review &
editing: Kim HK.
INTRODUCTION
Pulmonary arterial hypertension (PAH) is a progressive, life-threatening disease affecting pulmonary vasculature, and has a grave prognosis.
1)Although the pathogenesis of PAH is not completely understood, 3 factors are implicated in the increased pulmonary vascular resistance; vasoconstriction, pulmonary vascular remodeling, and thrombosis in situ.
2)3)Thus, the current advanced PAH targeted therapies are directed at one of 3 intracellular pathways
1): the endothelin, prostacyclin or nitric oxide pathway. Despite remarkable progress in the past 10 years, a late diagnosis and the late establishment of PAH-targeted therapy are partly responsible for the poor prognosis.
4)The EARLY study clearly demonstrated that early therapeutic intervention with the endothelin receptor antagonist, bosentan, could delay clinical deterioration in PAH, and thus should be considered for the improved management and prognosis of PAH.
5)However, no data are available regarding the histopathologic and hemodynamic advantages of early treatment with the endothelin receptor antagonist.
Recently, a new dual endothelin receptor antagonist macitentan (MAC) has become available for clinical use to delay disease progression, with clinical evidence of morbidity and mortality benefits.
6)In the present study, we used a monocrotaline (MCT)-induced PAH rat model to explore hemodynamic and histopathologic benefits on the early initiation of MAC. We also evaluated the potential benefits of the early initiation of a combination therapy consisting of MAC as the main PAH-targeted therapy, and sildenafil (SIL), a selective inhibitor of phosphodiesterase type 5. SIL was chosen for the combination therapy because it is the most frequently prescribed PAH drug in the clinical practice. SIL is also known to improve exercise capacity and hemodynamics in patients with symptomatic PAH,
7)and is known to exert additional pleiotropic effects, such as anti-hypertrophic and anti-apoptotic effects on myocytes, limiting myocardial remodeling in response to stress and thus attenuating heart failure development.
8)9)Therefore, MAC and SIL could have additive beneficial effects on fibrosis, remodeling, and right ventricular (RV) hemodynamics during the early stage of PAH.
METHODS
Animal model
Male Sprague Dawley (SD) rats (n=62) with a body weight of 350–400 g were provided free access to tap water and standard rat chow, and were housed in a room with a 12:12-hour light cycle, a temperature of 21°C, and a humidity of 55%. The experimental protocols were approved by the Institutional Animal Care and Use Committee of Seoul National University Hospital.
Although no animal model fully reflects the pathophysiology of human PAH, rat models of PAH have been developed by either MCT injection or chronic hypoxia with pulmonary artery banding (with or without SU-5416).
10)In the present study, MCT subcutaneous injection was chosen to induce PAH, as this model has been a mainstay for the study of new therapeutic interventions.
4)11)Although the precise mechanism involved is unknown,
4)10)MCT-induced PAH models also show similar histological findings to human PAH, such as the excessive proliferation of pulmonary arterial smooth muscle cells, endothelial dysfunction, and pulmonary vascular remodeling.
Since a high dose of MCT (80 mg/kg) is fatal within 3 weeks,
12)a dose of 60 mg/kg was
selected, as in previous studies.
11)13)This resulted in a PAH rat model that developed over an
extended period, more closely reflecting the chronic pathologic process of human PAH. MCT
Early Administration of Macitentan in PAH Rat Model
(Sigma/C2401; Sigma-Aldrich, St. Louis, MO, USA) was dissolved in 0.5 N of HCl, and the pH was adjusted to 7.4 with 0.5 N of NaOH. The solution was given as a single subcutaneous injection (60 mg/kg). Sham rats received an equal volume of isotonic saline.
Based on the preliminary experiment shown in the Supplementary Figure 1, the initiation of PAH-targeted therapy 3 weeks after MCT injection should be considered ‘late’. Therefore, the administration of PAH-targeted therapy in the current study was initiated one week after the MCT injection.
Study protocol
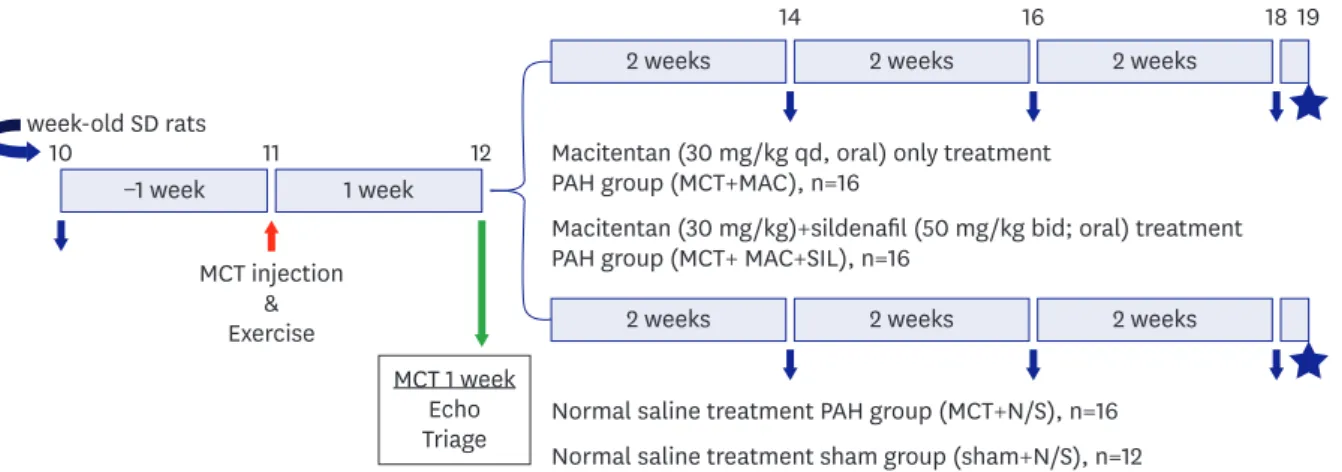
One week after MCT injection, rats were randomly assigned to receive one of three treatments as follows: 1) MAC administration (MAC group, n=16), 2) both MAC and SIL administration (MAC+SIL group, n=16), or 3) normal saline administration (MCT group, n=16). Twelve sham rats were included for comparison, in which normal saline was injected at the same dosage as the MCT. Cardiac function, exercise capacity, and body weight were monitored every 2 weeks.
At the end of the study protocol, an invasive pressure-volume analysis via a Millar catheter system was conducted for hemodynamic assessment. Subsequently, hearts and lungs were rapidly dissected and weighed for histological analysis. The detailed experimental protocol is depicted in Figure 1.
Drug administration
MAC 30 mg/kg/day (Actelion, Allschwil, Switzerland) was given orally by gavage once a day, based on previous studies regarding the maximal effective dose of MAC.
14)Although this dosage is high for humans, rats metabolize MAC at a higher rate; thus a free endothelin-1 plasma concentration of 1.0 to 1.5 pg/mL is achieved, which is within the optimal therapeutic range for a dual ET
A/ET
Breceptor antagonist.
15)An oral dose of 100 mg/kg/day SIL citrate (Hanall Biopharma, Seoul, Korea) was given by gavage twice a day based on previous studies regarding the pleiotropic, vascular effects in pulmonary hypertension (PH) and heart failure models.
8)9)16)Physiological studies
Echocardiography
Transthoracic echocardiography was performed at 1 week before and 1, 3, 5, and 7 weeks after MCT injection. Non-intubated rats were placed in a dorsal recumbent position and were
841 https://e-kcj.org https://doi.org/10.4070/kcj.2017.0394
2 weeks 2 weeks
1 week
−1 week
2 weeks 14
12 11
10
16 18 19
week-old SD rats
MCT injection
&
Exercise
Macitentan (30 mg/kg qd, oral) only treatment PAH group (MCT+MAC), n=16
Macitentan (30 mg/kg)+sildenafil (50 mg/kg bid; oral) treatment PAH group (MCT+ MAC+SIL), n=16
Normal saline treatment PAH group (MCT+N/S), n=16 Normal saline treatment sham group (sham+N/S), n=12
2 weeks
2 weeks 2 weeks
MCT 1 week Triage Echo
Figure 1. A schematic illustration of the preliminary experimental protocol is shown. Blue arrows indicate the time points at which body weight,
echocardiography, and exercise capacity were assessed. The asterisk indicates the time point of the invasive pressure-volume hemodynamics assessment.
MCT = monocrotaline; MAC = macitentan; N/S = normal saline; PAH = pulmonary arterial hypertension; SIL = sildenafil.
lightly sedated via inhalation of the lowest possible dose of isoflurane (initially 4%, then approximately 2–3%) mixed with oxygen. Images were acquired with a 9 MHz transducer connected to a Toshiba echocardiography machine (Nemio; Toshiba Co., Tokyo, Japan).
8)17)RV free wall thickness and end-diastolic cavity dimensions were assessed using M-mode echocardiography at the papillary muscle level. RV fractional area change (RV-FAC) and tricuspid annular plane systolic excursion (TAPSE) were evaluated in the apical 4-chamber view, where tricuspid and mitral valves could be most clearly visualized. The absence of pulmonary stenosis was confirmed using continuous wave Doppler signal in the parasternal short axis view at the aortic valve level. The acceleration time of the pulmonary outflow Doppler signal (pulmonary artery acceleration time [PAAT]) was measured from the time of the onset of systolic flow to the time of peak pulmonary outflow velocity. The systolic RV-right atrial (RA) pressure gradient, a representative index of pulmonary artery systolic pressure (PASP), was calculated using the peak tricuspid regurgitation velocity (TR Vmax) using the simplified Bernoulli equation (ΔP=4×TRVmax
2). True PASP could not be directly measured, as the inferior vena cava cannot be visualized in rats due to a relatively large liver volume.
All parameters were evaluated as an average of 5 consecutive beats. All echocardiographic studies were performed by an experienced echocardiographer with more than 5 years of animal experiment. The echocardiographer was blinded to the treatment group assignment.
Two independent observers analyzed the echocardiographic images in a blinded fashion.
Exercise test and blood pressure monitoring
Maximal exercise capacity was evaluated using a Rota Rod Treadmill (Ugo Basile, Comerio, Italy).
Rats ran to avoid falling off a knurled drum as the drum rotated. Animals were trained twice before testing to allow familiarization with the treadmill. Treadmill speed was gradually increased from 3 to 15 revolutions per minute every 1 minute. Exercise duration was recorded. An observer blinded to the study group recorded episodes of the immobility response due to exhaustion.
Systolic and diastolic blood pressures were measured in conscious rats via the tail-cuff method (Biopac System Inc., Goleta, CA, USA) at 1 week before and 1, 3, 5, and 7 weeks after MCT injection. At least a 1-day interval was allowed between blood pressure measurement and
echocardiographic examination or exercise testing, minimizing the stress imposed on the animals.
Invasive hemodynamic assessment
At 7 weeks (56 days) post-MCT injection, invasive hemodynamic assessments were performed using a Millar pressure catheter (SPR-869; Millar Instruments, Houston, TX, USA) inserted into the RV. The rats were sedated via inhalation of a mixture of isoflurane (4%) and oxygen.
Subsequently, endotracheal intubation was performed, and the animals were mechanically ventilated using a pressure-controlled respirator and a mixture of air and oxygen. The right jugular vein was cannulated for hypertonic saline (10%) infusion to determine parallel conductance. After a mid-sternal thoracotomy, the Millar conductance catheter was introduced into the RV and LV cavities via the apical approach (SRP-869 and SPR-847, respectively; Millar Instruments). A 3-0 surgical silk was passed around the inferior vena cava for transient occlusion during the protocol. After allowing for stabilization from the surgical preparation, data were continuously recorded on a personal computer using a pressure- volume unit (model MPVS-300; AD Instruments, Colorado Springs, CO, USA).
Heart rate, cardiac output (CO), RV end-diastolic/end-systolic volume and pressure, and LV
ejection fraction (EF) were assessed via pressure-volume loops. The RV pressure upstroke
Early Administration of Macitentan in PAH Rat Model
(dP/dt
max) was calculated. The slope of end-systolic elastance (E
ES) was determined by linear regression. To determine Vo, additional loops were acquired during the injection of 100 µL of 10% hypertonic saline via the cannula placed in the left jugular vein. True volume was determined from the measurement of the aortic flow using an ultrasonic flow probe (Transonic systems, Maastricht, The Netherlands) around the descending thoracic aorta.
8)Analyses of the pressure-volume loops were performed using a commercially available program, PVAN 3.5 (Millar Instruments).
8)Histopathological analysis
After the invasive hemodynamic measurements were completed, the rats were euthanized.
The hearts and lungs were harvested and weighed.
Biochemical analysis of serum Immunohistochemical analysis
The mid ventricle was removed for histopathology and was preserved in 4%
paraformaldehyde and embedded in paraffin. The tissue was sectioned into 4 µm sections, and stained with Masson's trichrome to evaluate the degree of fibrosis. No correction was made for tissue shrinkage by the fixation procedure, as this factor is equal in all samples (Methods section of Supplementary Data).
Statistical analysis
Data are presented as mean±standard error of the means. The Kolmogorov-Smirnov test was performed to evaluate normality of all parameters. For normally distributed parameters, group differences were compared using unpaired t-tests or one-way analyses of variance, followed by post hoc analyses with Bonferroni correction. For non-normally distributed parameters, group differences were evaluated using the non-parametric Kruskal-Wallis test, followed by post hoc analyses with Mann-Whitney U test. A repeated measures analysis of variances was performed to evaluate changes over time in RV-RA pressure gradients, RV wall thickness, body weight and exercise capacity. A survival analyses were performed using the Kaplan-Meier method, and the Log-rank test was used for pairwise comparison. For the survival analysis, the first day of oral MAC administration was defined as day 0 and the rats were monitored for the entire experimental periods (7 weeks/56 days). All statistical analyses were performed using SPSS version 22.0 (SPSS Inc., Chicago, IL, USA), and a p<0.05 was considered statistically significant.
RESULTS
Survival and changes in body weight
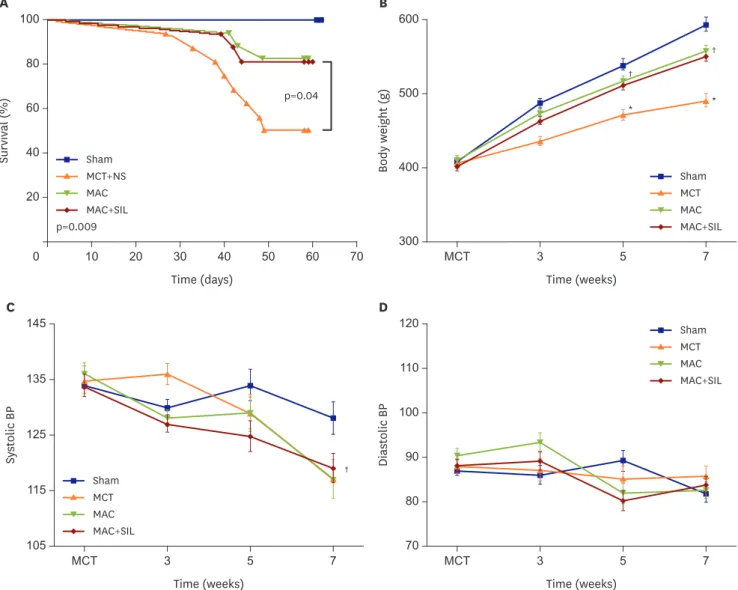
A total of 62 rats were initially studied; however, one rat died during anesthesia for echocardiography and one rat with a poor echocardiographic window was excluded. Eight rats (50%) in the MCT group died during the study period, while no rats died in the sham group (p=0.009). Survival rates were comparable in the MAC and MAC+SIL groups (3 rats died in each group). In the Kaplan-Meier survival analysis, survival in the MCT group was significantly worse than that in the PAH-targeted medication groups (MAC and the MAC+SIL groups) (p=0.04) (Figure 2A).
Rats in the MCT group displayed a pronounced growth retardation, resulting in a
significantly lower body weight at 7 weeks after MCT injection compared to that in the sham group (593.6±9.3 g for the sham group vs. 491.0±9.0 g for the MCT group, p<0.05). The
843
https://e-kcj.org https://doi.org/10.4070/kcj.2017.0394
slow weight gain in the MCT group became pronounced approximately 3 weeks after MCT injection (Figure 2B). Compared with the sham group, weight gain tended to be slower in the MAC and MAC+SIL groups, with no statistical significance (557.5±7.8 g for the MAC group and 550.7±7.8 g for the MAC+SIL group, both p>0.05) (Figure 2B).
Hemodynamic study
Heart rate and systemic blood pressure
There were no differences in the heart rate or systemic blood pressure between the sham and MCT groups throughout the study (Figure 2C and D).
Exercise capacity
There were no differences in exercise capacity prior to the first week after MCT injection.
Beginning one week after MCT injection, exercise capacity became impaired in the MCT group, Early Administration of Macitentan in PAH Rat Model
A
0 10
20 80
60
40 100
Survival (%)
Time (days)
70 60 50 40 30 20
p=0.04
p=0.009 Sham MCT+NS MAC MAC+SIL
B
300 MCT
500
400 600
Body weight ( g)
Time (weeks)
* *
†
†
7 5
3
Sham MCT MAC MAC+SIL
†
C
105 MCT
125 135
115 145
Sy st olic BP
Time (weeks)
7 5
3 Sham
MCT MAC MAC+SIL
D
70 MCT
100
90 110
80 120
Diast olic BP
Time (weeks)
7 5
3
Sham MCT MAC MAC+SIL
Figure 2. (A) Kaplan-Meier survival curves show a clear difference in survival between the MCT group and the MAC-based treatment groups (MAC and MAC+SIL groups) (p=0.04). (B) Serial changes in body weight over 7 weeks of MCT injection are shown. (C) Changes in systolic and diastolic blood pressure are compared among groups.
MAC = macitentan; MCT = monocrotaline; SIL = sildenafil.
* p<0.05 vs. the sham group;
†p<0.05 vs. the MCT group;
‡p=0.07 vs. the sham group.
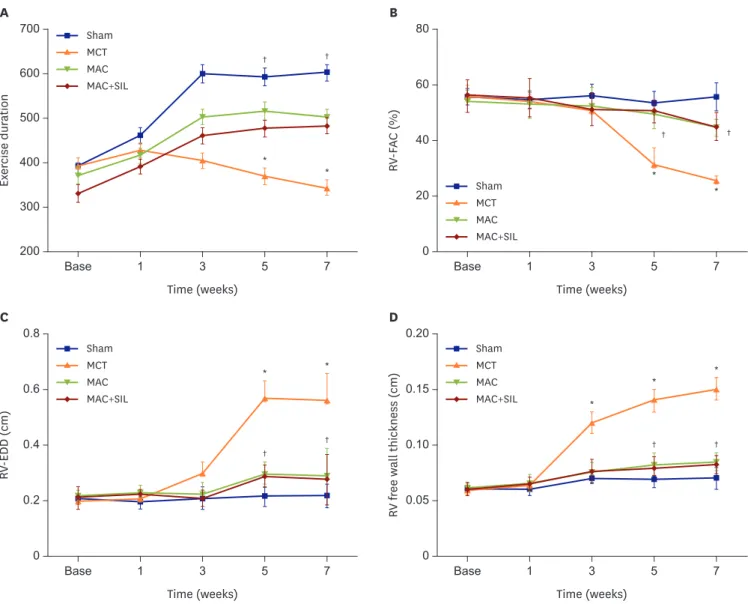
which was not observed in the sham group (at 7 weeks post-MCT injection, 601±19 seconds for the sham group vs. 342±17 seconds for the MCT group, p<0.05). In contrast, exercise capacity was relatively maintained in the MAC group and was significantly higher compared to that in the MCT group 7 weeks post-MCT injection (501±18 seconds for the MAC group vs. 342±17 seconds for the MCT group, p<0.05). The same trend was evident in the MAC+SIL group, and exercise capacity was comparable in the MAC+SIL groups at 7 weeks post-MCT injection (501±18 seconds for the MAC group vs. 483±18 seconds for the MAC+SIL group, Figure 3A).
845 https://e-kcj.org https://doi.org/10.4070/kcj.2017.0394
† †
A
200
Base 400
600
500
300 700
Ex er cise d ur ation
Time (weeks)
7 5
3 1
Sham MCT MAC MAC+SIL
* *
† †
*
*
B
0
Base 40
60
20 80
RV -F AC (%)
Time (weeks)
7 5
3 1
Sham MCT MAC MAC+SIL
†
†
C
0
Base 0.4
0.6
0.2 0.8
RV -EDD (cm)
Time (weeks)
7 5
3 1
Sham MCT MAC MAC+SIL
* *
† †
* *
*
D
0
Base 0.10
0.15
0.05 0.20
RV fr ee w all thickness (cm)
Time (weeks)
7 5
3 1
Sham MCT MAC MAC+SIL
† †
G
0 Base
40 80
60
20 100
RV -RA PG (mmHg)
Time (weeks)
7 5
3 1
TR is not visible in the Sham group Measurable TR was initially observed at 3 weeks
MCT MAC MAC+SIL
† †
*
*
H
0.4 Base
0.6 0.8
0.7
0.5 1.0
LV -EDD (cm)
Time (weeks)
7 5
3 1
0.9
Sham MCT MAC MAC+SIL
† †
E
10
Base 30
40
20 50
PAA T (msec)
Time (weeks)
7 5
3 1
Sham MCT MAC MAC+SIL
*
* *
† †
* *
F
0
Base 2
3
1 4
TAPSE (mm)
Time (weeks)
7 5
3 1
Sham MCT MAC MAC+SIL
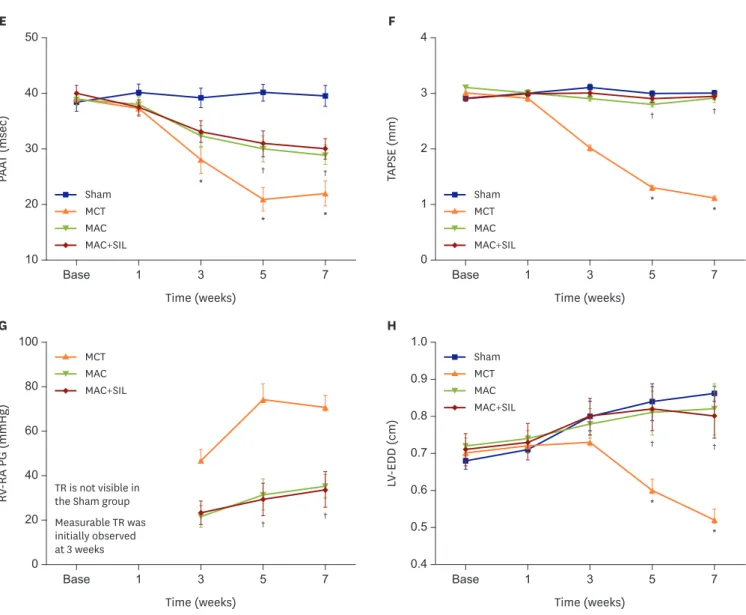
Figure 3. (A) Comparisons in exercise capacity. Exercise capacity began to deteriorate one week after MCT injection in the MCT group, but not in the sham group.
In contrast, exercise duration was relatively preserved in the MAC group (p<0.05). Exercise capacity in the MAC+SIL group was comparable to that in the MAC group (p>0.05). (B) Serial assessments of RV-FAC. Serial echocardiography showed that rats with MCT-induced PAH rats had reduced RV-FAC beginning at 5 weeks. Treatment with MAC alone or combination with MAC and SIL attenuated the progression of RV systolic dysfunction. (C) Serial assessments of the RV-EDD on echocardiography. (D) Serial assessments of the RV wall thickness. (E) PAAT was measured from the time of the onset of systolic flow to the time of the peak pulmonary outflow velocity. Note the significant differences in the PAAT among the 4 groups beginning at 3rd weeks. (F) Serial assessments of the TAPSE. (G) Serial assessment of RV-RA PG. TR jet could be reliably quantified via continuous-wave Doppler around 3 weeks after MCT injection in the MAC and MAC+SIL groups.
TR tracing was difficult to follow in the sham group, and thus, the RV-RA PG could not be reliably obtained in the sham group. (H) Serial assessment of LV-EDD.
LV-EDD was smaller in the MCT group, where D-shaped LV at the parasternal short axis image was clearly visualized, indicating development of severe pulmonary hypertension. In contrast, both the MAC and the MAC+SIL groups showed no significant decrement in LV dimension with preservation of the LV geometry.
LV = left ventricular; LV-EDD = left ventricular end-diastolic dimensions; MCT = monocrotaline; MAC = macitentan; PAH = pulmonary arterial hypertension; PAAT = pulmonary artery acceleration time; RA = right atrial; RV-FAC = right ventricular fractional area change; RV = right ventricular; RV-EDD = right ventricular end-diastolic dimension; RV-RA PG = right ventricular-right atrial pressure gradient; SIL = sildenafil; TAPSE = tricuspid annular plane systolic excursion; TR = tricuspid regurgitation.
* p<0.05 vs. the sham group;
†p<0.05 vs. the MCT group. (continued to the next page)
RV remodeling after MCT injection as assessed noninvasively
There were no group differences in baseline RV diameter, RV free wall thickness, or RV systolic function (as assessed by RV-FAC, PAAT, and TAPSE) (Figure 3B-3F). In almost all rats, a tricuspid regurgitation (TR) jet was not observed on baseline echocardiography. TR invariably developed in all rats with an MCT injection; however, the time point at which TR developed varied. Seven weeks after MCT injection, the MCT group exhibited a higher RV-RA pressure gradient (70.2±5.7 mmHg) vs. that in the MAC and MAC+SIL groups (all p<0.05). MAC Early Administration of Macitentan in PAH Rat Model
† †
A
200 Base
400 600
500
300 700
Ex er cise d ur ation
Time (weeks)
7 5
3 1
Sham MCT MAC MAC+SIL
* *
† †
*
*
B
0 Base
40 60
20 80
RV -F AC (%)
Time (weeks)
7 5
3 1
Sham MCT MAC MAC+SIL
†
†
C
0 Base
0.4 0.6
0.2 0.8
RV -EDD (cm)
Time (weeks)
7 5
3 1
Sham MCT MAC MAC+SIL
* *
† †
* *
*
D
0 Base
0.10 0.15
0.05 0.20
RV fr ee w all thickness (cm)
Time (weeks)
7 5
3 1
Sham MCT MAC MAC+SIL
† †
G
0
Base 40
80
60
20 100
RV -RA PG (mmHg)
Time (weeks)
7 5
3 1
TR is not visible in the Sham group Measurable TR was initially observed at 3 weeks
MCT MAC MAC+SIL
† †
*
*
H
0.4
Base 0.6
0.8
0.7
0.5 1.0
LV -EDD (cm)
Time (weeks)
7 5
3 1
0.9
Sham MCT MAC MAC+SIL
† †
E
10 Base
30 40
20 50
PAA T (msec)
Time (weeks)
7 5
3 1
Sham MCT MAC MAC+SIL
*
* *
† †