DOI : 10.5394/KINPR.2010.34.7.517
Questionnaire Survey on the Risk Perception in the Istanbul Strait
Y. Volkan Aydogdu*․Cemil Yurtoren**․Serdar Kum***․†Jin-Soo Park
* Department of Marine Traffic Information, Graduate School of Korea Maritime University, Busan 606-791, Republic. of Korea
**, *** Department of Marine Transportation and Management Engineering, Istanbul Technical University, Istanbul1 34469, Republic. of Turkey
†Division of Navigation Science, Korea Maritime University, Busan 606-791, Republic. of Korea
Abstract : There are enormous challenges in the Istanbul Strait- one of the most important, congested and narrow waterways in the world – from the view point of risk determination and risk mitigation for the local traffic. Previously several traffic parameters such as; traffic volume for local vessels, traffic flow and potential encounters of local traffic, in addition to the possibility of collision, were investigated in order to determine the degree of dangers in the southern entrance of the Istanbul Strait. Furthermore, risky zones were also determined in this waterway. On the basis of the results of those, a group of expert was surveyed. These experts were pilots, Vessel Traffic Services Operators (VTS-O), Local Traffic Vessel Captains and Master Mariners who had several experience of navigation through the Istanbul Strait. In order to assess experts perceptions of danger and to propose further studies based on this survey. The questionnaire was analyzed by using SPSS (Statistical Package for the Social Sciences) program version 13.0. Finally, some differences and/or shares on risk perceptions of expert in the Istanbul Strait are considered.
Key words : risk perception, the Istanbul Strait, local marine traffic, expert survey
†[email protected], 051)410-4240
* V.Aydogdu [email protected], 051)440-1238
** [email protected], +90-216) 395-1064
** [email protected], +90-216) 395-1064
1. Introduction
There are enormous challenges in the Istanbul Strait- one of the most important, congested and narrow waterways in the world – from the view point of risk determination and risk mitigation for the local traffic. Passenger and car ferries, passenger boats and sea buses run in the southern entrance of the Istanbul Strait where local traffic mostly effects navigation safety. Daily more than 2,100, scheduled or unscheduled local traffic ships run from one side to the other of the Istanbul Strait which adds up to more than 700 thousand passages a year (Aydogdu, 2006).
In the last 10 years, nearly 350 marine accidents have occurred in Turkey, especially in the Istanbul Strait.
Incidents are classified according to the nature of their occurrences as follows: 57% of accidents are collisions, 22%
of accidents are grounding, 16% of accidents are stranding, and the rest are due to fire and other (Yurtoren, 2004).
Although the Istanbul Strait is a difficult water way to navigate due to its treacherous currents, twists and turns, it is one of the heaviest sea traffic regions in the World. The Istanbul Strait is the second strait in having the densest traffic and according to passing ratios, the volume of traffic in the Strait is 3 times greater than in the Suez Canal, 4 times greater than in the Panama Canal and 2 times greater
than in the Kiel Canal (Ece, 2006). On the basis of these facts, the Istanbul Strait is considered to be a very difficult region for navigational aspects and shiphandling difficulties.
In the previous study "Analysis of marine Traffic Features for Safety Assessment at Southern Entrance of the Istanbul Strait-I" (Aydogdu, 2008) several marine traffic parameters such as; traffic volume for local vessels, traffic flow and potential encounters of local traffic, in addition to the possibility of collision, were investigated in order to determine the degree of dangers in the southern entrance of the Istanbul Strait and probability of collision showed almost two times higher than those of Busan, Ulsan and Incheon.
Furthermore, risky zones were determined for this area.
An attempt is made in this paper to assess risk perceptions of experts by a questionnaire survey, and then to propose further studies based on results of this survey.
These experts were pilots, VTS Operators, Local Traffic Vessel Captains and Master Mariners who had several times experience of navigating through the Istanbul Strait. The aim of this study is to determine the most dangerous traffic parameters such as; vessel type, ship length, sector among pre-defined risky local traffic areas, the influence level of external factors, and the effectiveness level of potential counter measures gathered from the survey. It also aims to investigate the perception differences among the experts.
2. Literature Review
In the study of Arslan and Turan (2009), the SWOT analyse method is suggested to determine factors that cause the shipping accident in the Istanbul Strait. After describing the factors by using the SWOT analyse method, they applied Analytic Hierarchy process (AHP) method to find weights of each factor. As a result of the study, several strategic precautions are proposed.
Akten (2004) investigates marine casualties’ in-depth relation to casualty types, numbers of ships, the localities where most incidents occur, and external factors such as currents and darkness that contribute to marine casualties in the Strait. The study revealed the major factors in order to suggest possible solutions.
Atasoy (2008) determines the local traffic intensity and some risks-related parameters in the Istanbul Strait. The risks were defined based on environmental stress factors via Environmental Stress (ES) model.
Nur (2005) studies geographical, meteorological, hydrological, oceanographic, economical and strategic characteristics of the Istanbul Strait. She also investigates the shipping traffic, marine casualties and circumstances of innocent passage based on present safety precautions. In addition, she generates a casualty chart for the Istanbul Strait by using the statistical analyse method. In the conclusion, two different results were revealed: (i) the relation ship between the number of marine casualties and the passage of ships without pilot, and (ii) influence of meteorological factors on ship accidents such as current, wind, fog and the tonnage of ships in the Istanbul Strait.
Kum (2008) investigates the risk profile of maritime accidents in the Istanbul Strait, and then develops a methodology to minimize human error. He exposes the potential threats and defines the risk profile based on the geographical and physical specifications of the Istanbul Strait.
Although all of the papers above agree that there is significant navigational risk and ship handling difficulties in the Istanbul Strait; none of them investigates local traffic and the most dangerous traffic parameters based on expert survey.
3. Design of empirical study
A total of 160 questionnaires were distributed of which 146 were returned (89.5% return rate) in April, 2009 by visiting work places of experts. However 5 of these have
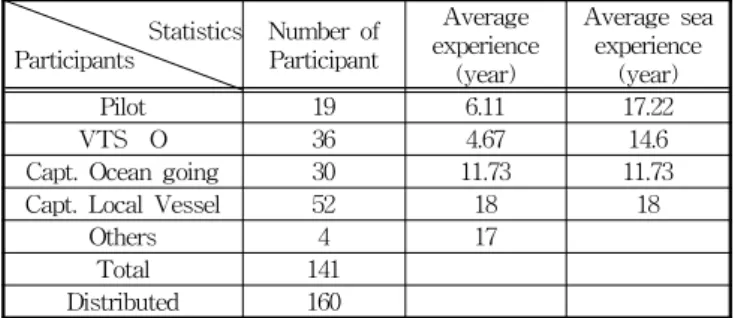
been disregarded due to missing data. 19 pilots (average 6.1 years' experience as strait pilot and 17.2 years' sea experience), 30 Ocean going captains who had several times experience of navigating through the Istanbul Strait (averagely 11.7 years' sea experiences), 52 local traffic vessel captains (various competency-license and average 18 years' sea experience), a Vice Harbour Master, a pilot boat skipper, 2 tug boat skippers and 36 VTS-O’s (average 4.7 years' experience as VTS-O and 14.6 years experience at sea) participated in this survey as given in Table 1.
Table 1 Number of participants with their experience Statistics
Participants
Number of Participant
Average experience
(year)
Average sea experience
(year)
Pilot 19 6.11 17.22
VTS‐O 36 4.67 14.6
Capt. Ocean going 30 11.73 11.73
Capt. Local Vessel 52 18 18
Others 4 17
Total 141
Distributed 160
4. Method
The items of questionnaire have been chosen/ decided based on the result of previous studies. The questionnaire consists of two parts; Part A which aims to understand Risk Perception of the experts by using 6 questions, Part B which aims to take approach of experts regarding existent and potential counter measures. The survey was analyzed by using SPSS (Statistical Package for the Social Sciences) program version 13.0.
The reliability of the questionnaire responses is tested by Cronbach’s Alpha method. Cronbach's α (alpha) is a statistic method which is commonly used to measure the internal consistency or reliability of a psychometric test score for a sample of examiners (Cronbach, 1951). This article uses the term "item", while recognizing that items are variable.
Manipulated items are commonly referred to as variables.
The homogeneity of response variances is tested by Levene’s statistics. Levene's test is an inferential statistic used to assess the equality of variances in different samples.
Some common statistical procedures assume that variances of the populations from which different samples are drawn are equal. Levene's test assesses this assumption. It tests the null hypothesis that the population variances are equal.
If the resulting p-value of Levene's test is less than some critical value (typically 0.05), the obtained differences in sample variances are unlikely to have occurred based on
random sampling. Thus, the null hypothesis of equal variances is rejected and it is concluded that there is a difference between the variances in the population (Levene, 1960). Procedures which typically assume homogeneity of variance include analysis of variance and t-tests. Levene's test may also test a meaningful question in its own right if a researcher is interested in knowing whether population group variances are different. In order to test the significance of differences between alternatives the conventional analysis of variance (ANOVA) technique is performed. For the details of ANOVA theory, please refer to various statistical hand books ( e.g. Freedman, David A., 2007).
5. Results of Risk Evaluation
The reliability of the survey is tested by Cronbach's Alpha method which is found significant as given in Table 2.
Table 2 Reliability Statistics Cronbach's
Alpha Cronbach's Alpha Based on
Standardized Items Number of Items
0.771 0.782 34
The survey consists of two parts, as mentioned in Introduction. Part A has 6 questions with sub-items and Part B has only one question with sub-items. Items in Part A are evaluated and graded in Five Likert Scale; from "1- minimum/ lowest risk" to "5- maximum/ highest risk".
Influence level of external forces are evaluated by the last item of part A and graded from "1- not effective" to "5- extremely effective." Similarly, the effectiveness level of risk mitigating counter measures are evaluated in Part B and graded from "1- not effective" to "5- extremely effective."
Number of participants (N), mean values and standard deviations are obtained via Descriptive Statistics and mean values are indicated by graphics.
5.1 With respect to ship type and crew
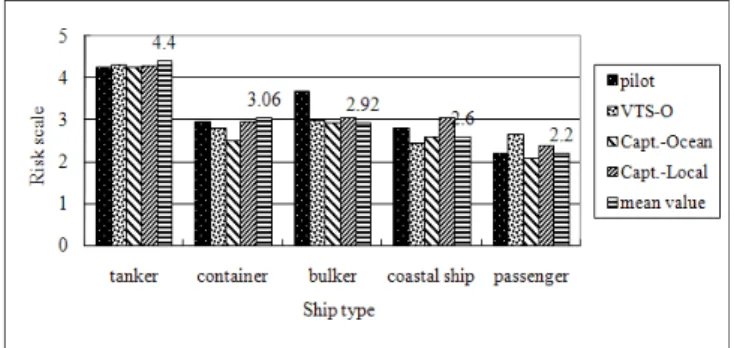
Participants evaluated navigational risk level of tanker, container, bulk carries, passenger and coastal ships which navigate in the southern entrance of the Istanbul Strait with respect to ship type in terms of maneuvering characteristics, cargo condition, etc. And participants evaluated risk level of afore listed ship types with respect to crew condition, by means of considering training level, workload, working condition, etc.
The results revealed that tanker ships are the most dangerous ships types with a mean of 4.4 points on a Five Likert Scale (60.3% of participants agreed on the highest risk level and 22.7% of them gave high risk level) and with respect to crew background by a mean of 3.68 points (31.2%
of participants agreed on the highest risk level and 31.2% of them gave high risk level). Passenger ships were determined as less dangerous among ship types with a mean of 2.2 points on a Five Likert Scale (34.8% of participants agreed on the lowest risk level and 30.5% of them gave low risk level) and with respect to crew background by a mean of 2.04 points (39% of participants agreed on the lowest risk level and 29.8% of them gave low risk level). Table 3 present results of Levene's test.
Table 3 Results of Levene's test Statistics
Type
Levene’s Statistic
differential
1 differential2 Significance
Tanker 0.684 4 136 0.604
Container 9.110 4 136 0.000
Bulker 3.891 4 134 0.005
Passenger 1.353 4 136 0.254
Coastal Ship 1.780 4 136 0.136
Tanker Crew 0.376 4 134 0.127
Bulker Crew 0.100 4 134 0.982
Passenger Crew 2.547 4 133 0.42
Coastal Ship
Crew 1.668 4 134 0.161
Experts have given different risk perception weights for the risk level with respect to ship type and crew on board.
However variances of weights are determined non-significant (p> .05), except container and bulk carrier (p< .05) with respect to ship type and passenger (p< .05) with respect to crew condition.
Fig. 1 Risk evaluations among experts with respect to ship type
It is assumed that experts have common approaches regarding risk perception, in spite of different risk perception weights. The results also revealed that experts consider
training level, workload, working condition, and etc. of crew onboard. For instance, all experts gave higher risk level for crew (depends on training, working condition, etc) than ship type to coastal ships as shown in Fig.1 and Fig.2. It is also assumed that experts in the Istanbul Strait have high situational awareness regarding ship type and crew characteristics, and consequently, this promotes navigational safety in the Istanbul Strait.
Fig. 2 Risk evaluations among experts with respect to crew condition
5.2 With respect to ship length
Participants evaluated the effect of ships length on safe navigation in the southern entrance of the Istanbul Strait.
Results are shown in Fig.3.
Fig. 3 Risk evaluation among experts with respect to ship length
It has been determined that ships 250 meter or more in length have the most dangerous/ extremely dangerous length with a mean of 4.66 points on a Five Likert Scale (78.7% of participants agreed on the highest risk level) and also length between 200 meters and 249 meters is a dangerous ship length/ extremely dangerous by a mean of 4.41 points on a Five Likert Scale (56.7% of participants agreed on the highest risk level and 29.1% of them gave high risk level). The results revealed that experts have the same risk perception (p> .05) regarding the risk level posed
by ship length, which parallel with increase of ship length.
5.3 Pre-defined local traffic zone
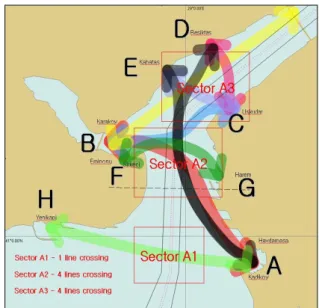
In the previous study (Aydogdu, 2008), traffic flow was investigated in the southern entrance of the Istanbul Strait- the area of 7.5 miles lying between the line connecting Moda Burnu to Bakirkoy and Bogazici Bridge, 8 main origin-destinations (OD) were defined as main routes for the local marine traffic. Probability of collision and near misses were calculated/ simulated for each OD. Then, the research area was divided into 3 sectors namely Sector A1, Sector A2 and Sector A3. Ultimately, Sector A2 was determined as the most risky area due to high traffic volume, which is followed by Sector A1, although it has the lowest traffic volume and potential encounters in Sector A1, due to its location at the entrance and exit point of the Strait as given by Fig.4.
Fig. 4 Pre-defined main traffic flow lines and sectors
Participants evaluated risk for these sectors (A1, A2 and A3). Sector A2 is determined as the most dangerous sector with a mean of 4.29 points on a Five Likert Scale (55.3%
highest risk level), and it is followed by Sector A3 with a mean of 3.27 points on a Five Likert Scale (19% highest risk level, 27% high risk level and 29.1% moderate risk level) and Sector A1 with a mean of 2.88 points (19% high risk level, 29.1% moderate risk level and 22.7% low risk level) as given in Fig.5. It is assumed that experts have common risk perceptions of pre-defined local traffic areas.
Risk perception weight of local traffic skippers is less than others, and experts' awareness hidden risks in sector A1 could be improved.
Fig. 5 Risk evaluation among experts for pre-defined sectors
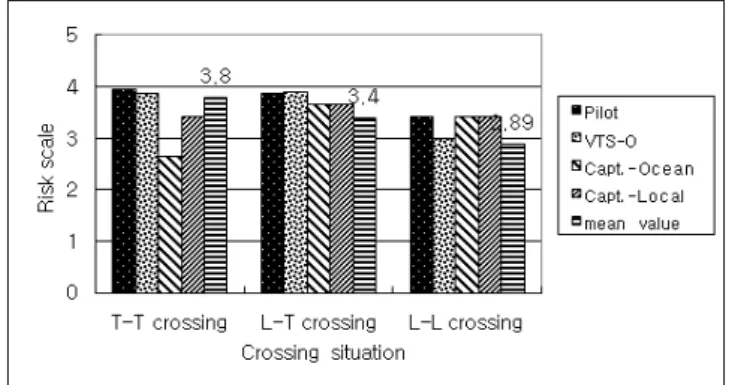
5.4 Crossing and encounter situations
Participants evaluated risk level of crossing/ encounter situations between "local traffic vessels and local traffic vessels", "local traffic vessels and transit passing vessels"
and "transit passing vessels and transit passing vessels".
Transit-transit vessel crossing/ encounter situations are determined as the most risky/ highly dangerous situation in the research area with mean of 3.80 points on a Five Likert Scale (34.8% of participants agreed on the highest risk level and 26.2% of them gave high risk level), then transit - local traffic with mean of 3.40 points (19.9% of participant agreed on the highest risk level and 34.8% of them gave high risk level) and local - local traffic vessel with a mean of 2.89 points (10.6% of participant agreed on the highest risk level, 24.8% of them gave high risk level and 27.0% moderate risk level) as shown in Fig. 6.
Fig. 6 Risk evaluation among experts for encounter/
crossing situations
According to collision statistics of the Istanbul Harbor from 1991 to 2005, a total of 203 collisions occurred and 107 of them were between transit-transit vessels, 54 of them were between local-transit vessels, 42 of them were between local-local traffic vessels, which supports the result of the survey. It is assumed that experts have common
opinions in regard to crossing/ encounter situations according to descriptive statistic and mean values as given in Table 4 and it is in compliance with collision statistics, except in the case of master mariners, who consider transit-transit vessel crossing/ encounter situations to be a moderate risk level. Hence, it is assumed that risk perception of experts is similar, but situational awareness of master mariners regarding transit-transit vessel crossing/
encounter situations could be improved.
Table 4 Results of Levene's tesRisk evaluation among expert for encounter/crossing situations
Statistics
Type
N Mean Std.
Deviation Std.
Error
95% Confidence Interval for Mean
Min Max Lower
Bound Upper Bound Local Local Pilot 19 3.42 0.902 0.207 2.99 3.86 2 5
VTS-O 35 3.00 1.163 0.197 2.60 3.40 1 5
Capt. O. 12 3.42 0.996 0.288 2.78 4.05 2 5
Capt. L 18 3.44 1.199 0.283 2.85 4.04 1 5
Others 55 2.35 1.391 0.188 1.97 2.72 1 5
Total 139 2.89 1.295 0.110 2.67 3.11 1 5
Transit Local Pilot 19 3.89 0.994 0.228 3.42 4.37 2 5
VTS-O 36 3.92 0.937 0.156 3.60 4.23 1 5
Capt. O. 12 3.67 0.778 0.225 3.17 4.16 2 5
Capt. L 18 3.67 1.085 0.256 3.13 4.21 1 5
Others 55 2.75 1.456 0.196 2.35 3.14 1 5
Total 140 3.40 1.285 0.109 3.19 3.61 1 5
Transit Transit Pilot 19 3.95 0.848 0.195 3.54 4.36 2 5
VTS-O 36 3.89 0.887 0.148 3.59 4.19 2 5
Capt. O. 12 2.67 0.778 0.225 2.17 3.16 2 4
Capt. L 18 3.44 1.247 0.294 2.82 4.06 2 5
Others 55 4.05 1.177 0.159 3.74 4.37 1 5
Total 140 3.80 1.107 0.094 3.61 3.99 1 5
5.5 External Factors
Participants evaluated the effect level of current, wind restricted visibility, local traffic vessels, fishing vessels and yachts on navigation in the southern entrance of the Istanbul Strait. Restricted visibility is determined as an extremely influential factor with a mean of 4.33 points on a Five Likert Scale (65.2% of participants agreed on the extremely influential) on safe navigation and it is followed by fishing vessels and yachts with a mean of 3.75 points (34.8% of participants agreed on the extremely influential and 25.5% of them gave highly influential), current with a mean of 3.42 points (24.8% of participants agreed on the extremely influential and 29.8% of them gave highly influential) and local traffic vessels with a mean of 3.23 points (15.6% of participant agreed on the extremely influential and 37.6% of them gave highly influential).
According to the result of survey, as shown in Fig. 7, pilots attributed more influence weights to external forces.
However, it is concluded that experts have the same opinion
on the influence level of external forces (p> .05) according to one way ANOVA.
Fig. 7 Influence level of external factor among experts
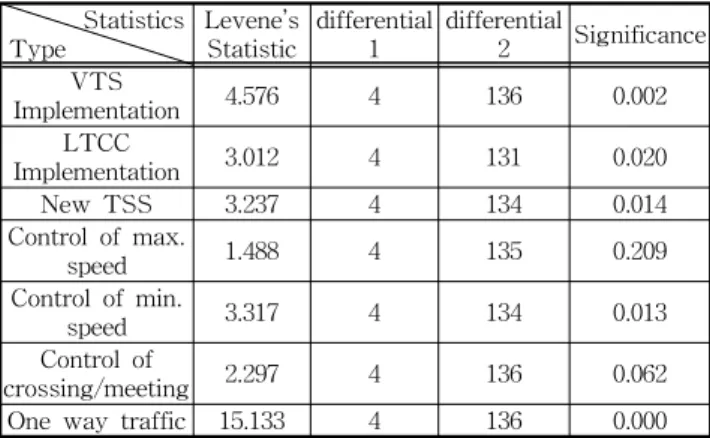
5.6 Existent and Potential Counter Measures Participants evaluated the effectiveness of existent and potential counter measures to reduce risks in the southern entrance of the Istanbul Strait. Continuity of one way traffic, which has been implementation since 2003 due to an under water tunnel project, is determined as the most effective counter measure with a mean of 4.57 points on a Five Likert Scale (78% of participant agreed on the extremely effective factor). It is followed by controlling of vessel crossing and meeting with a mean of 4.36 points (60.3% of participants agreed on the extremely effective factor and 24.1% of them gave highly effective), VTS implementation with a mean of 4.23 points (49.6% of participants agreed on the extremely effective factor and 33.3% of them gave highly effective), control of minimum speed with a mean of 3.65 points (32.6%
of participants agreed on the extremely effective factor and 25.5% of them gave highly effective), control of maximum speed with a mean 3.46 points (28.4% of participants agreed on the extremely effective factor and 21.3% of them gave highly effective), a new TSS implementation by considering present local and transit marine traffic conditions with a mean of 3.27 points (20.6% of participants agreed on the extremely effective factor and 31.9% of them gave highly effective), Local Traffic Control Centre (LTCC) implementation with a mean of 3.09 points (21.3% of participant agreed on the extremely effective and 21.3% of them gave highly effective) as shown in Fig. 8 & Table 5.
Experts have given different effectiveness weights for the counter measure to reduce risks in the southern entrance of Istanbul Strait, but variances of weights are determined non- significant (p > .05) except control of maximum speed and control of vessel crossing and meeting (p < .05). Hence, it is assumed that experts have common opinion regarding risk perception, despite the different risk perception weights.
Fig. 8 Effectiveness evaluation of counter measures among experts
Table 5 Results of Levene's test Statistics
Type
Levene’s Statistic
differential 1
differential
2 Significance VTS
Implementation 4.576 4 136 0.002
LTCC
Implementation 3.012 4 131 0.020
New TSS 3.237 4 134 0.014
Control of max.
speed 1.488 4 135 0.209
Control of min.
speed 3.317 4 134 0.013
Control of
crossing/meeting 2.297 4 136 0.062
One way traffic 15.133 4 136 0.000
6. Summary and Conclusion
A group of experts in the Istanbul Strait were surveyed.
Results of survey were analyzed by SPSS version 13.0 and the reliability of the survey was found significant by an acceptable Cronbach's Alpha (0.77) value.
Findings, as results of this questionnaire survey, are summarized below;
(1) Tankers ships are determined as the most dangerous ship type for navigation in the southern entrance of the Istanbul Strait,
(2) Ships 200 meters or more in lengths are determined as the most dangerous ship lengths,
(3) Sector A2 is the most dangerous pre-defined local traffic area and it is assumed that experts are not well aware of hidden risks at Sector A1,
(4) Transit-transit vessel encounter/crossing situations are more dangerous encounter/crossing situations than others in the research area.
(5) Restricted visibility is the most influential external factor on safe navigation in the research area,
(6) One way traffic implementation is the most significant counter measure at the southern entrance of the Istanbul Strait in order to reduce risks.
(7) In general, major experts have common risk perception and opinions in the research area
In further studies, the aim will be to determine risky crossing/ encounter points of transit vessel and local traffic vessel in the research area via fast time simulation studies.
The results of this questionnaire survey and previous studies can be utilized for those simulation studies. After determining risky points, a new traffic regime in the Istanbul Strait can be investigated, and an assessment of counter measures to reduce risk in the research area such as a new TSS, can be carried out.
References
[1] Akten, N. (2004), “Analysis of shipping casualties in the Bosporus”, The Journal of Navigation, The Royal Institute of Navigation, Vol. 57, pp. 345–356 London.
[2] Arslan, O. & Turan, O. (2009), “Analytical Investigation of marine casualties at the Istanbul Strait with SWOT AHP method”, Maritime Policy & Management, Vol. 36, No. 2, 131‐145.
[3] Atasoy C. (2008), "Investigation of local marine traffic at Istanbul Strait" MSc Thesis, Istanbul Technical University, Institute of Science and Technology.
[4] Aydogdu V.(2006), "Risk Analysis of The Istanbul Strait at Dense Traffic Area", MSc Thesis, Istanbul Technical University, Institute of Science and Technology, Turkey.
[5] Aydogdu V., Park J. S., Keceli Y., and Park Y. S.(2008),
"Analysis of marine Traffic Features for Safety Assessment at Southern Entrance of the Istanbul Strait-I", Journal of Navigation and Port Research, Vol.32, No.7, pp. 521~527. ISSN 1598-5725
[6] Cronbach L. J.(1951), “Coefficient alpha and the internal structure of tests”, Psychometrika, Vol 16(3), pp. 297~
334.
[7] Ece,J.N.(2006), “The Accident Analysis of the Strait of Istanbul from the Points of Safety Navigation and Environment and Evaluation of Innocent Passage”, Gazi University PhD Thesis
[8] Freedman David A. et alia.(2007), Statistics, 4th edition, W.W. Norton & Company.
[9] Kum S. (2008), "Mental Workload of Vessel Traffic Services Operator", Ph.D., Kobe University, Graduate School of Science and Technology, Maritime Science
and Technology.
[10] Levene Howard (1960), "Robust tests for equality of variances". in Ingram Olkin, Harold Hotelling et alia, Stanford University Press, pp.278-292
[11] Yurtoren,C. (2004), “Study on Maritime Traffic Management in the Istanbul Strait”, PhD Thesis, Kobe University, Maritime & Transportation System Science.
Received 23 June 2010 Revised 15 September 2010 Accepted 15 September 2010