ABSTRACT
The past researches on roadway segment safety estimation focused on intersections, which are the primary traffic accident regions. The past researches on roadway segments, However, analyzed the effects of certain factors on the traffic accident occurrence rate by organizing the individual geometric structures of the roads, and there is still a dearth of researches on the development of a traffic accident estimation model for rural roadway segments. Therefore, this research focused on rural two-lane and multilane roadway segments and developed traffic accident estimation models through the application of statistical techniques. This is required to explain such high frequency of zero counts in the traffic accident data. In this research, it was found that the Hurdle model is more suitable than the Poisson or negative binomial-regression model for explaining the excess zeros case. In addition, main variables were chosen to estimate their effects on traffic accident occurrence at rural roadway segments, and the safety at such rural roadway segments was estimated. In this research, it was assumed that there are different factors that affect the safety at two-way lane and multilane roadway segments, and a traffic accident estimation model was developed by dividing the two-way lane and multilane roadway segments.
KEYWORDS
safety, hurdle model, roadway segment, rrural area, ttraffic accident
Development of the Expected Safety Performance Models for Rural Highway Segments
지방부 국도의 사고예측모형 개발에 관한 연구
오 주 택 Jutaek Oh 정회원·Assistant Professor, Dept, of Urban Engineering, Korea National University of Transportation (E-mail : [email protected])
김 도 훈 Dohoon Kim 정회원·Researcher, Dept, of Highway, The Korea Transportation Institute (E-mail : [email protected]) 이 동 민 Dongmin Lee 정회원·Researcher Fellow, Dept, of Highway, The Korea Transportation Institute (E-mail : [email protected])
요지
그동안 다양한 도로설계 안전성 평가 연구는 교통사고다발지역인 교차로에 집중되어 왔다. 또한 도로구간에서는 특정한 기 하구조 요인이 교통사고율에 어떠한 영향을 미치는지에 대한 연구는 일부 수행되었으나, 도로구간에서의 안전성 평가를 위한 다양한 원인분석을 위한 연구는 여전히 미진한 실정이다. 따라서, 본 연구는 지방부 도로구간에서의 안전성 평가를 위해 도로 구간을 지방부 2차로 도로와 다차로 도로구간으로 구분하여 통계적 기법을 적용하였다. 일반적으로 도로구간에서의 교통사고 는“0”의 빈도가 높게 나타나므로 통계적 분석 시에 이를 고려해야만 한다. 따라서 본 연구에서는 사고의 비선형적 요소를 설 명하는 허들모형이 전통적인 포아송 및 음이항모형보다 도로구간에서의 발생하는 교통사고의 성격을 설명하는데 더욱 적절한 것으로 판단하여 분석을 시작하였다. 본 연구에서는 지방부 도로구간에서의 사고빈도 예측모형 개발 및 도로구간 안전성 평가 를 위해서 지방부 2차로 도로구간과 다차로 도로구간으로 구분하였으며, 모델분석결과 교통사고를 유발시키는 변수가 각각의 유형에 따라 서로 다른 것으로 분석되었다.
핵심용어
안전성, 허들모형, 도로구간, 지방부, 교통사고 한국도로학회 논문집
제14권 제2호 2012년 4월 pp. 131 ~ 143
1. INTRODUCTION
The various existing safety estimation researches related to road design focus mainly on intersections with frequent traffic accidents, and there is a dearth of researches on safety estimation at roadway segments. Especially, there are many roadways whose designs are affected by the surrounding terrain and by the shape of the roadway in rural area. Therefore, the swell like vertical curve, horizontal curve, and radius appear greater in rural roadway segments than in urban roadway segments, and it can be said that rural roadway segments are more prone to traffic accidents. Therefore, the factors affecting the occurrence of traffic accidents in rural roadway segments must be identified so as to reduce the traffic accidents.
The initial researches on intersection safety estimation are as follows. In the study that was conducted by Joshua(1990), the fitness levels of the roadways were compared by developing a multilinear and Poisson regression model using heavy vehicles, the intersection’s geometric structure, and the traffic conditions. The Poisson regression model results showed that such model had a greater explanation power than the multilinear regression model. In the research conducted by Sheffer(1999), it was assumed that the intersection traffic accident rate is affected by the lead and lag left-turn phase methods, among the different signaling phase methods. The results of the analysis of the target intersection lead left-turn phase showed a 50% lower traffic accident rate, or higher than that of the lag left-turn phase. In addition, Bauer(1996) analyzed the correlation between the traffic volume and the geometric structure of the plane intersection, and developed a statistical traffic accident model. The results of their research also showed that the traffic volume has a greater effect on the frequency of traffic accidents than the geometric structure of the intersection does. Moreover, Bonneson(1993) analyzed the relation between the traffic volume at intersections and the frequency of traffic accidents using negative exponential distribution, refined the relation between major and minor roadway traffic volume and the frequency of traffic accidents, and developed a traffic accident estimation model. David and Norman(1976) analyzed the frequency of traffic accidents according to the urban- and rural-area traffic volumes, using comparative analysis. The results showed that at
unsignalized intersections in urban areas, if the number of traffic accidents is 20,000 veh/day or less, the 3-leg intersection and 4-leg intersection traffic accident frequency will be similar, but if the number of traffic accidents at an unsignalized intersection is 20,000 veh/day or more, the frequency of traffic accidents at four leg intersections will be more than twice the frequency of traffic accidents at three-leg intersections.
As shown above, most of the past studies on safety assessment at intersections used a traffic accident estimation model. Most of the past researches on safety assessment at roadway segments, however, analyzed the effects of individual variables rather than developed and used a traffic accident estimation model. The researches on roadway segment safety estimation are as follows.
Zegeer et al. (1994) carried out many researches on traveled width change at roadway segments, and they found out that when the traveled width increases by one foot, the traffic accidents are reduced by 12% and that when the traveled width increases by four feet, the traffic accidents are reduced by 0%. Especially, when the traveled width at curves increases, the traffic accidents decrease by 5-21% according to the increasing width.
Brinkman and Percbonok(1979) found that the frequency of traffic accidents at a downhill road was higher than that at an uphill road, and that there is a high rate of fatal traffic accidents among drivers who are entering or advancing on a sunk roadway. Moreover, Harwood et al.(2000) found that as the slope of the roadway segment increases, the number of traffic accidents also tends to increase. The results of their analysis revealed that the traffic accidents increased by 3-14% when the slope was between 2 and 8%. Therefore, in the study conducted by Zegeer et al.(1994), where the factors affecting the frequency of traffic accidents were analyzed, the following conclusion was arrived at: In the plane shaped high speed driving, the mitigation of the curve will reduce traffic accidents by 2- 9% according to the curvature and central angle. The results of the shoulder-related research conducted by Zegeer et al.(1987, 1991) on design element roadway segments showed that there is a 4-33% traffic accident decrease effect at curves by paving the shoulder width, and that there is a 3-29% traffic accident decrease effect on the unpaved shoulder width at curves. Moreover,
Jackett(1996)presented the relation between roadway lighting installation and the frequency of traffic accidents, and the results of the data analysis that was conducted showed that the night traffic accidents decreased by 33%
when roadway lighting was installed, and that the single car and car to car accidents decreased by 13 and 38%, respectively. For the land use around the roadside, McCoy et al.(1989) found a relation between land use and the frequency of traffic accidents around the sections of two lane and more than two lane roads. The results showed that land-use (commercial areas) have higher traffic accident rates. Likewise, in the present research on roadway segments, only the effects of elements like the individual geometric structure of the road on the frequency of traffic accidents were analyzed, to organize roadways, but this was insufficient for the development of a traffic accident estimation model. Therefore, to reduce the traffic accidents at roadway segments, the traffic, roadway, and traffic operation conditions should be analyzed when designing roads. In addition, this research focused on rural two-lane and multilane roadway segments and developed a traffic accident estimation model through the application of a statistical technique. Through these, a suitable traffic accident prevention method was developed for rural roadway segments.
2. DATA COLLECTION
Rural roadway segments outside the capital region, or outside metropolitan areas, and on plains and downhill areas, were chosen for this study. Field research was executed as follows: First, based on data obtained from past researches, the variables affecting the frequency of traffic accidents were arranged, and the research areas and roadway axes were chosen. Second, the final variable candidates were chosen by carrying out some sections of the past field researches, and by supplementing the field research plan. Third, through field researches, the geometric structure of roadways and traffic condition variables were collected. Three years (2006-2008) vehicle to vehicle traffic accident data by Road Traffic Authority were used for the frequency of traffic accidents. Table 1.
shows the research sections for the traffic accident analysis at rural roadway segments. This research combined all of
the data collected from Region A and Region B, and divided the data into two-lane and multilane categories.
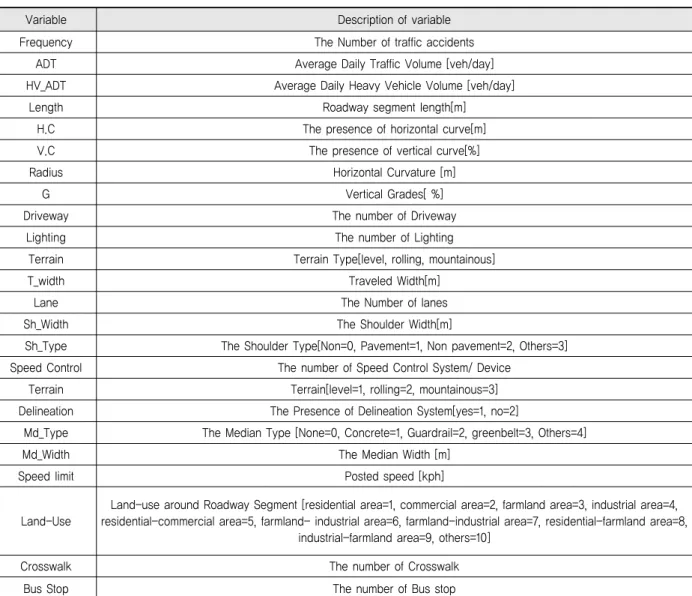
The scope of the explanation variables in the results showed that data regarding the geometric structure of roadways, traffic conditions, and other variables can be collected. The geometric structure consisted of the road variables (curve radius, vertical curve, traveled width, roadway segment length, driveway lanes, shoulder shape and width) and the roadway design variables (number of lighting facilities, median shape and width). The traffic condition variables were limited speed, traffic volume, heavy vehicle volume, restricted driving facilities, and terrain, and the other variables were the relevant land-uses and the number of crosswalks, bus stops, and visibility improvement facilities. Such variables are presented in Table 2. The variables presented below, such as the traveled width, have very close relations with the number of road lanes. For example, as presented in a past research, the volume of traffic accidents increases along with the number of road lanes.
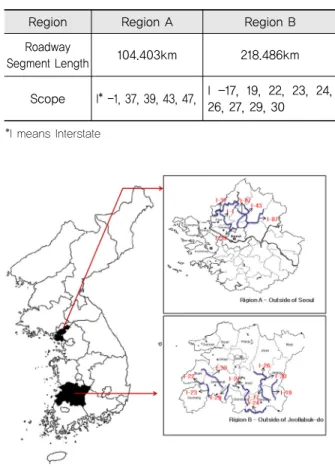
Table 1. Roadway Segment Research Scope
Region Region A Region B
Roadway
Segment Length 104.403km 218.486km
Scope I* -1, 37, 39, 43, 47, I -17, 19, 22, 23, 24, 26, 27, 29, 30
*I means Interstate
Fig 1. Sampling locations of the reigons in South Korea
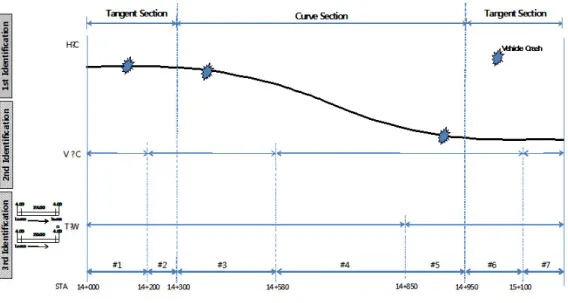
The importance of individual roadway design elements for dividing the homogeneity section was highlighted by Zegeer et al. (1994), Brinkman and Percbonok (1979) in their research results. In this research, to analyze the relationship between the frequency of traffic accidents and the various explanation variables that had been gathered, the changes in the elements (e.g., geometric structure) were segmented for each section at a continuous roadway segment. Moreover, the sections where traffic accidents have occurred and those where no traffic accident has occurred were simultaneously considered and should be applied in the construction of a traffic accident estimation model. Three important variables were selected for roadways when dividing the sections. At first, the horizontal radius for the changed
section was curved after the primary section division, and then secondary section division was done for the section whose vertical curve was to be changed. Finally, tertiary section division was done for the section whose roadway width was to be changed. The homogeneity section division methods that were employed have been schematized in Fig. 2.
To be able to apply the individual explanation variables, it must be checked if these have been included in the traffic accident estimation model. Even if the traffic accident estimation model has very good explanation power, if the individual explanation variables cannot be applied to the design and analysis, then the developed traffic accident estimation model would be useless. The traffic accident estimation model is used
Variable Description of variable
Frequency The Number of traffic accidents
ADT Average Daily Traffic Volume [veh/day]
HV_ADT Average Daily Heavy Vehicle Volume [veh/day]
Length Roadway segment length[m]
H.C The presence of horizontal curve[m]
V.C The presence of vertical curve[%]
Radius Horizontal Curvature [m]
G Vertical Grades[ %]
Driveway The number of Driveway
Lighting The number of Lighting
Terrain Terrain Type[level, rolling, mountainous]
T_width Traveled Width[m]
Lane The Number of lanes
Sh_Width The Shoulder Width[m]
Sh_Type The Shoulder Type[Non=0, Pavement=1, Non pavement=2, Others=3]
Speed Control The number of Speed Control System/ Device
Terrain Terrain[level=1, rolling=2, mountainous=3]
Delineation The Presence of Delineation System[yes=1, no=2]
Md_Type The Median Type [None=0, Concrete=1, Guardrail=2, greenbelt=3, Others=4]
Md_Width The Median Width [m]
Speed limit Posted speed [kph]
Land-Use
Land-use around Roadway Segment [residential area=1, commercial area=2, farmland area=3, industrial area=4, residential-commercial area=5, farmland- industrial area=6, farmland-industrial area=7, residential-farmland area=8,
industrial-farmland area=9, others=10]
Crosswalk The number of Crosswalk
Bus Stop The number of Bus stop
Table 2. Key Geometric and Traffic Condition Variables for the Survey Results
Conversion : 1km/h=0.621mi/h : 1m=3.28ft
Variables Multilane Roadway Two-Lane Roadway
Min. Max. Mean. dispersion Min. Max. Mean. dispersion
Frequency/year 0 13 0.329 1.049 0 7 0.139 0.647
The presence of H.C 0 1 0.451 0.498 0 1 0.581 0.493
R(m) 0 6,800 254.349 531.184 0 6,300 146.658 264.910
1000/R(m) 0 20 1.340 2.090 0 27.03 3.344 3.738
The presence of V.C 0 1 0.862 0.345 0 1 0.975 0.158
G|%| 0 10 1.752 1.619 0 9 2.400 1.697
The presence of G(0%) 0 1 0.137 0.344 0 1 0.026 0.158
The presence of a upraise V.C 0 1 0.075 0.264 0 1 0.097 0.295
Length(m) 25 850 171.639 121.359 30 3,000 181.805 143.400
Traveled width(m) 11.2 45.0 15.094 2.12 6 16 6.943 1.305
Driveway 0 5 0.344 0.648 0 10 0.667 1.037
The presence of Shoulder 0 1 0.898 0.303 0 1 0.954 0.209
Shoulder Width(m) 0 5 1.307 0.668 0 3.6 1.028 0.390
The number of Lightings 0 16 1.387 2.224 0 3.6 1.028 0.390
The presence of median 0 1 0.833 0.373 0 3.6 1.028 0.390
The presence of Guardrail 0 1 0.745 0.436 0 1 0.012 0.109
Median width(m) 0 2.8 1.065 0.612 0 20 0.077 0.928
Posted speed (kph) 30 80 78.076 5.604 0 3.6 1.028 0.390
Ln(ADT) 8.51 10.69 9.765 0.546 6.87 10 7.947 0.643
Ln(Heavy vehicle ADT) 6.25 8.38 7.675 0.521 3.85 7.46 5.714 0.802
The presence of Speed Control Device 0 1 0.033 0.179 0 1 0.015 0.122
Terrain Type[Level=1, others=0] 0 1 0.456 0.498 0 1 0.502 0.500
Terrain Type[mountainous=1, others=0] 0 1 0.089 0.285 0 1 0.318 0.466
Land-use[residential=1, other=0] 0 1 0.026 0.159 0 1 0.100 0.300
The Number of Crosswalk 0 2 0.142 0.377 0 6 0.199 0.476
The Number of Bus Stop 0 2 0.103 0.333 0 3 0.184 0.460
The Presence of Delineation System 0 1 0.253 0.435 0 1 0.052 0.221
※ Multilane Roadway - Total Roadway Segment 998
- The Number of Crash Accident Roadway Segments 161 - The Number of Non-Crash Accident Roadway Segments 837
※ Two-Lane Roadway - Total Roadway Segment 1,918
- The Number of Crash Accident Roadway Segments 125 - The Number of Non-Crash Accident Roadway 1,793 Fig 2. Roadway sections for data collection
Table 3. Summary Statistics of the Key Variables
mainly to prove the relation between the main explanation variables and the frequency of traffic accidents, and to assess the safety of the analysis section through traffic accident estimation. Based on such results, it can be used to choose the priority design element for designing rural roadway segments. For the analysis of the effects of the various design elements on the frequency of traffic accidents, the analysis scope is focused on two-way lane and multilane roadway segments. Also, table 3 explains study sites statistics.
3. METHODOLOGY
In a traffic accident estimation model that uses traffic accident data, to address the problem regarding the estimation of a negative number of traffic accidents for the general linear regression model, Jovanis and Chang (1986) Joshua and Garber (1990) introduced a Poisson regression model for analysis using discrete probability variables. If the traffic accident dispersion, however, is bigger than the average, over dispersion will occur. To solve the problem of the Poisson regression model under such basic conditions, Miaou and Lum(1993) insisted that the binomial regression model start from the assumption that the dispersion is bigger than the average.
These two models are used to estimate the frequency of traffic accidents. Using the Poisson regression model and the negative binomial regression model, Shankar et al.(1997) came up with traffic accident estimation model response variables by dividing the total number of traffic accidents by the number of traffic accidents for each type, to come up with his own traffic accident estimation model. Poch and Mannering(1996) showed the suitability of the negative binomial regression model for the intersection access traffic accident estimation mode. Milton and Mannering(1998) found that the negative binomial-regression model shows greater suitability than the Poisson regression model for roadway geometric structures, traffic related factors, and traffic accident estimation model development. To develop a traffic accident estimation model, the suitable statistical distribution of the analysis data should be considered.
Numerous data exist pertaining to the number of traffic accidents. As such, the data’s zero rate is actually much higher than the rate from the original Poisson regression model, or the data from the regression model are called
“zero-inflated data.”Shankar et al.(1997) insisted that the traditional Poisson regression model and the negative binomial regression model are limited in that they cannot adequately explain the point where the number of traffic accidents is “0.”Important data may be lost in the analysis when the fact that the data obtained through the use of the existing model and the traditional reasoning method includes too many zeros is not considered. To address this problem, the Hurdle model was applied in this research.
The following is an explanation of such model.
A hurdle model is “a modified count model in which the two processes generating the zeros and the positives are not constrained to be the same. The idea underlying the hurdle formulations is that a binomial probability model governs the binary outcome of whether a count variate has a zero or a positive realization. If the realization is positive, the “hurdle is crossed”, and the conditional distribution of the positives is governed by a truncated at zero count data model.”Following Mullahy, but with a change in notation, let represent the probability that the hurdle is crossed, ant let , +be the conditional distribution of the positives, where satisfies is the summation of on the support of the conditional density (i.e., the truncation normalization), and . The general form of the hurdle model likelihood function is the
Where , , and .
Taking the natural logarithm of both sides and rearranging terms, we see that the log likelihood can be written as
(1)
(2)
Since the likelihood function is separable with respect to the parameter vectors and , the log likelihood can always be written as the sum of the log likelihoods from two separate models: a binomial probability model and a truncated at zero count model.
The probability mass function is ;
The zero-truncated Poisson process has probability mass function
and the log likelihood for the observation, assuming the observations are independently and identically distributed, is
If we model using the complementary log-log link and using the log link, with a little algebra we have
Thus, the log likelihood can be written
In the case of hurdle model specifications, we can see that the log likelihood describes the sum of a log likelihood for the binary outcome model, , and a log likelihood for a truncated at zero Poisson model, . As indicated above, and vectors of parameters are separable. This reparability implies that the Hessian will be block diagonal so that covariances between and are zero. Therefore, we will not lose information if we fit a hurdle model by estimating the parameters of the binomial probability model separately from the parameters of the truncated Poisson model.
4. MODEL ESTIMATION
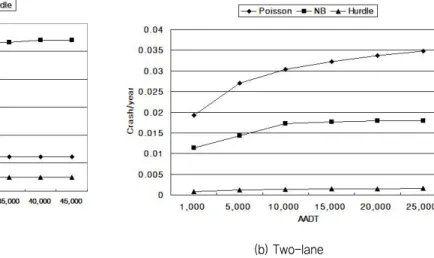
4.1 Model ResultA traffic accident estimation model was developed using LIMDEP 8.0. This traffic accident estimation model was to be used to prove the relation between the main explanation variables and the frequency of traffic accidents, as well as to assess the safety of the analysis section through traffic accident estimation. To determine the effect of the various design elements on the frequency of traffic accidents, to avoid repeated effects between the explanation and subordinate variables, and to choose the variables for securing each variables independence, the design elements were analyzed under the condition where the reliable level of correlation among the variables was 90%. In this study, Poisson, negative binomial regression, and Hurdle models were developed and analyzed. The research results showed that the used roadway segment had too many zeros in its traffic accident frequency figure.
Therefore, it was found that the Hurdle model is more suitable than the Poisson or negative binomial regression model for explaining the data that were used in the research, as shown in Fig 4.
In this research, two alternative models for each type of roadway segment that was developed from the Hurdle model were developed. These models can used to determine significant variables affecting accidents. Such models’
results are presented in Table 4 and 5. For the use of the developed traffic accident estimation model for rural multilane roadway segments, the following variables were chosen: EXPO, radius, HC, VC, guardrail, crosswalk,
(3)
(5)
(6)
(7)
(4)
terrain, land use, and bus stop. EXPO, grade, driveway, lighting, Terrain, bus stop, median, land use, and crosswalk are shown in the two-way lane roadway segment. Here, EXPO (exposure) is an offset variable, as follows:
This research used (Likelihood ratio statistic) to determine the final models in order to conduct analyses significant factors affecting accidents.
(Base case: no radius, VC is “0”, no guardrail, no mountainous, no residual, no crosswalk and buss-top)
Fig 4. Predicted crashes vs. the roadway segment accident prediction frequency model type
(Base case: VC is “0”, no driveway, no lighting, no residual, no guardrail, no resiual, no crosswalk)
(a) Multilane (b) Two-lane
Variables Model 1 Model 2 Model 3
Parameters of count model equation
Constant -7.881(-40.559)* -7.935(-40.758) -7.847(-41.623)
EXPO 1(Fixed parameter)
The presence of H.C - 0.649(5.453) 1.017(8.058)
Radius (1000/R) 0.222(8.926) - -
Upraise V.C 0.898(7.027) 1.003(7.827) -
The presence of Guardrail 0.447(2.214) 0.533(2.669) 0.696(3.697)
Terrain(mountainous) - - 0.305(3.407)
# Crosswalk 70.474(4.406) 71.235(4.478) 97.224(6.635)
Parameters of binary hurdle equation
Constant -8.794(-85.226) -8.655(-65.314) -8.652(-64.159)
EXPO 1(Fixed parameter)
Radius (1000/R) - 0.069(1.865) 0.081(2.097)
Terrain(mountainous) 0.601(2.272) - -
Terrain(Level) - -0.461(-2.291) -0.333(-1.717)
Land-use(Residential) 1.642(3.535) 1.832(3.953) -
# Bus Stop 55.277(2.104) 50.529(1.945) 59.969(2.272)
Vuong’s statistic 5.019 5.040 5.039
305.516 302.263 249.153
0.191 0.187 0.156
Table 4. Multilane Roadway Segment Hurdle Model Results
(Note : # means numbers, and * means Parameter(T-statistic)
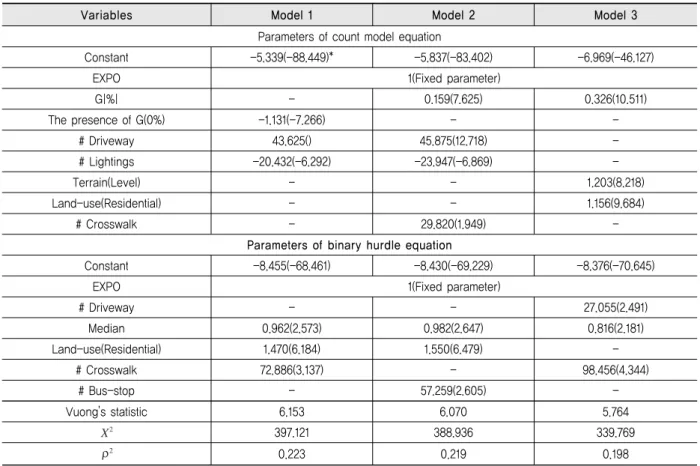
Variables Model 1 Model 2 Model 3 Parameters of count model equation
Constant -5.339(-88.449)* -5.837(-83.402) -6.969(-46.127)
EXPO 1(Fixed parameter)
G|%| - 0.159(7.625) 0.326(10.511)
The presence of G(0%) -1.131(-7.266) - -
# Driveway 43.625() 45.875(12.718) -
# Lightings -20.432(-6.292) -23.947(-6.869) -
Terrain(Level) - - 1.203(8.218)
Land-use(Residential) - - 1.156(9.684)
# Crosswalk - 29.820(1.949) -
Parameters of binary hurdle equation
Constant -8.455(-68.461) -8.430(-69.229) -8.376(-70.645)
EXPO 1(Fixed parameter)
# Driveway - - 27.055(2.491)
Median 0.962(2.573) 0.982(2.647) 0.816(2.181)
Land-use(Residential) 1.470(6.184) 1.550(6.479) -
# Crosswalk 72.886(3.137) - 98.456(4.344)
# Bus-stop - 57.259(2.605) -
Vuong’s statistic 6.153 6.070 5.764
397.121 388.936 339.769
0.223 0.219 0.198
Table 5. Two-Lane Roadway Segment Hurdle Model Results
(Note : # means numbers, and * means Parameter(T-statistic)
4.2 Model Analysis
Consistent with the concept of exposure to risk, an aggregate relationship between accident frequency and functions of roadway traffic flows (entering and leaving traffic flows) were explored. Expectedly, the total roadway traffic volume was found to increase annual crashes significantly, similar to the findings by others (Austin et al, 2002; Hauer et al, 1988; Lyon et al, 2003). Not only do higher roadway traffic volumes increase aggregate exposure to risk, but increased roadway traffic volumes restrict the mobility of vehicle drivers, raising driver frustration levels, leading to greater risk.
Concerning impacts of land use on roadway safety, the results of the research conducted by Bonneson(1997) Hauer et al.(2007) Lau and May(1988) showed that residential areas is one of the primary variables that induces traffic accidents at roadway segments. In such research results, in the case of residential areas, the land- use areas near the target roadway segments had a larger traffic volume compared to areas like agricultural or
industrial areas. Thus, residential areas have relatively higher traffic volume, and more contractions occur due to the frequent entry and exit of vehicles. The results of the study also showed that in residential areas, traffic accidents are bound to be more serious, and there are bound to be more traffic accidents.
Numerous studies have examined the relationship between horizontal curves and safety. The analysis presented here revealed that horizontal curves have negative safety effects for crashes. That is, the bigger the curve radius (t=8.926) is, the lesser its effect on the frequency of traffic accidents, and in the case of straight sections with no curve radius, the traffic accidents that occurred were relatively smaller. The coefficient value of the curve radius was statistically assessed, with a 1%
significance level. Researchers have also examined the effect of vertical curves on safety but did not establish a clear relationship between vertical curves and accident frequency. In this study, it was found that traffic accident occurrence probability is higher in the case of uphill road
sections at vertical curves (t=7.027). This finding agrees with the results of the research conducted by Harwood et al. (1986). The results of their researches showed that countermeasures are needed to prevent traffic accidents at vertical-curve interchange sections. The speed decrease of a big vehicle in an uphill section will affect another speeding vehicle and may cause traffic chaos. Moreover, lane changing via speed alteration frequently occurs at the vertical-curve section of an uphill road, which may lead to a major traffic accident. Therefore, uphill roads for slow vehicles should be installed, and danger signs should be placed at the vertical-curve sections of interchanges to ensure the drivers’safety. This study also examined the safety effects of presence of mountainous areas, because roadways in rural areas have more chances to pass through mountainous areas than roadways in urban areas. As expected, more crashes tend to occur in mountainous areas. That is, in mountainous areas, the change in the vertical curve is expressed as the driver's sight distance deficiency, repeated acceleration and deceleration section, and the difficulty of securing a sufficient curve radius in a mountainous terrain. These seem to increase the traffic accident occurrence danger rate. Also, the numbers of crosswalks (t=4.406) and bus stops (t=2.104) per section length were found to increase the traffic accident occurrence danger rate, and longer crosswalks were found to lead to the repeated acceleration/deceleration of cars and to induce traffic accidents, particularly car crashes. As for bus stops at rural roadway segments, unlike in the case of urban bus stops, there is no suitable bus stop at rural roadway segments. As such, there is a high possibility of traffic accident occurrence, such as rear end crashing. The installation of a guardrail prevents the occurrence of head- on collision with large vehicles and decreases the seriousness of the traffic accidents that may occur. It was found, however, that the possibility of traffic accident occurrence was increased by the deficiency of sight distance in curves.
The analysis suggests that painted medians (t=2.573) are associated with lower frequencies of accidents. However, negative safety effects were observed for raised medians for roadway segments. Many previous researches revealed that raised median have a trade-off safety effect: placing a curb in the median will largely reduce cross-median
accidents but may increase sideswipe crashes and crashes that result from vehicles being deflected back into the traffic stream. In this study, it was found that traffic accidents increased in roads where a median had been installed. This finding was also shown in the results of the research that was conducted by Donnell et al.(2006).
To interpret the safety effect of driveway (t=13.897), it is important to understand what types of accidents occur at driveways. Numerous research studies of David and Norman (1976); Bauer and Harwood (2000) have been conducted into the nature of traffic accident that occurs near driveways. Although the results of the previous studies vary considerably, a common conclusion is that entering and exiting turning vehicles are involved in most driveway related crashes. Thus, it is the presence of additional conflict points at roadway segments that is associated with crashes.
The results of this study also showed that the higher the driveway density is, the lower the rate of vehicle to vehicle traffic accidents at roadway segments. These findings support the notion that effective access management can improve safety at roadway segments.
The absence of a lighting (t=-6.292) facility at a roadway segment was also chosen as a factor that considerably increases the rate of traffic accidents, in agreement with previous research findings. When driving at night, the absence of lighting facilities may be a traffic accident inducing factor as it may prevent the driver from securing sight distance. This is shown not only by the results of a research on the relation between lighting facilities and traffic accidents but also by the research report of Jackett (1996).
Therefore, lighting facilities must be considered for roadway segment design to reduce the danger of traffic accidents by improving the driving environment.
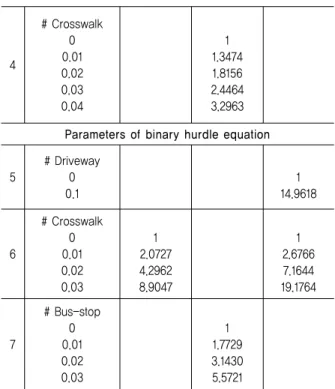
Based on the research results of the developed traffic accident estimation model for geometric structures, the elasticity was analyzed for each explanation variable according to the change in values of the variables. As shown in Table 6, in the case of multilane roadway segments, the higher the radius (1000/R) is, the higher the increase in the values of the variable, and the lower the radius is, the bigger the values of the variable, which means that sudden curves are formed. Moreover, it can be seen that the higher the densities of the crosswalk and bus
stop are, the larger the increase in the size of the predicted accident frequency. The elasticity analysis for the two-way lane roadway segment is also shown in Table 7.
5. CONCLUSION
The past researches on roadway segment safety estimation focused on intersections, which are the primary traffic accident regions. The past researches on roadway segments, however, analyzed the effects of certain factors on the traffic accident occurrence rate by organizing the individual geometric structures of the roads, but there is a dearth of researches on the development of a traffic accident estimation model. Therefore, this research aimed to develop a traffic accident estimation model by applying a statistical technique on rural two-lane and multilane roadway segments. It is hoped that the development of a traffic accident estimation model in this research will pave the way for the establishment of a suitable method of preventing traffic accidents at rural roadway segments.
This research was based on the assumption that the characteristics of traffic accidents follow Poisson distribution and can be compared by developing suitable statistical models. The results of this research are as follows:
1. The research results showed that although traffic accidents follow Poisson distribution, the used roadway segment had too many zeros in its traffic accident frequency figure. Therefore, it is required to explain
Variable Alternative Model 1
Alternative Model 2
Alternative Model 3
1
Radius (1000/R) 0 5 10 15 20
1 3.0344 9.2073 27.9383 84.7749
2
# Crosswalk 0 0.01 0.02 0.03
1 2.0233 4.0938 8.2831
1 2.0388 4.1566 8.4744
1 2.6439 6.9900 18.4806 Parameters of binary hurdle equation
3
Radius (1000/R) 0 5 10 15 20
-
1 1.4120 1.9937 2.8151 3.9749
1 1.4993 2.2479 3.3703 5.0531
4
# Bus Stop 0 0.01 0.02 0.03
1 1.1738 3.0209 5.2504
1 1.6575 2.7472 4.5534
1 1.8216 3.3181 6.0440 Table 6. Prediction Factors for Multilane Roadway Segments
Table 7. Prediction Factors for Two-Lane Roadway Segments
Variable Alternative Model 1
Alternative Model 2
Alternative Model 3
1
G|%|
0 1 2 3 4 5 6 7
1 0.2690 0.0723 0.0195 0.0052 0.0014 0.0004 0.0001
2
# Driveway 0 0.1
1 78.4530
1 98.2485
3
# Lightings 0 0.02 0.04 0.06 0.08
1 0.6646 0.4416 0.2935 0.1950
1 0.6194 0.3837 0.2377 0.1472
4
# Crosswalk 0 0.01 0.02 0.03 0.04
1 1.3474 1.8156 2.4464 3.2963 Parameters of binary hurdle equation
5
# Driveway 0 0.1
1 14.9618
6
# Crosswalk 0 0.01 0.02 0.03
1 2.0727 4.2962 8.9047
1 2.6766 7.1644 19.1764
7
# Bus-stop 0 0.01 0.02 0.03
1 1.7729 3.1430 5.5721
such high frequency of zero counts in the traffic accident data.
2. Main variables were chosen to estimate their effects on traffic accident occurrence at rural roadway segments, and the safety at such rural roadway segments was assessed or estimated. In this research, it was assumed that there are different factors that affect the safety at two-way lane and multilane roadway segments, and a traffic accident estimation model was developed by dividing the two-way lane and multilane roadway segments. The results showed that the [+] variables that increase traffic accidents at rural multilane roadway segments are EXPO, radius, VC, guardrail, crosswalk, terrain, land use, and bus stop; those that increase [+]
traffic accidents at two-way lane roadway segments are EXPO, driveway, median, land use, and crosswalk; and those that reduce (-) traffic accidents at two-way lane roadway segments are grade (0%) and lighting facilities.
3. The analysis of the model results revealed that there are different explanation variables that significantly affect the safety at roadway segments. Therefore, countermeasures should be established to enhance the safety of two-way lane and multilane roadway segments.
This research was focused on rural roadway segments, and traffic accident models were developed for such roadway segments. A traffic accident model for urban roadway segments is also needed, though. It because urban roadways have more complex traffic circumstances than rural roadway segments and there are still few researches for urban roadway segments.
REFERENCE
Bauer, K.M. and Harwood, D.W.(1996). Statistical Models of At- grade Intersection Accidents, Final Technical Report, FHWA- RD-96-125, November
Bonneson, J.A., and McCoy, P.T.(1997). Capacity and Operational Effects of Midblock Left-Turn Lanes, NCHRP Report 395, TRB
Brickman, C. and Perchonok, K.(1979). Hazardous Effects of Highway Features and Roadside Objects Highlights, Public
Road. Federal highway Administration
David, N.A., and Norman, J. R.(1976). Motor Vehicle Accidents in Relation to Geometric and Traffic Features of Highway Intersections. Vol 2-Research Report, Report No. FHWA-RD- 76-129, Federal Highway Administration
Harwood, D.W., Council, F.M., Hauer, E., Hughes, W.E., and Vogt, A.(2000). Prediction of the Expected Safety Performance of Rural Two-Lane Highways. FHWA-RD-99-207, December.
Hauer, E.(1988). The Safety of Older Persons at Intersections, Transportation in an Aging Society: Improving Mobility and Safety for Older Persons, Vol 2, Special Report 218, TRB, pp.
194-252
Jackett, M. J.(1996). Accident savings from road lighting in NewZealand. Proceedings of roads ’96 conference, Christchurch Austin, R. and Carson, J.(2002). “An alternative accident prediction
model for highway-rail interfaces”, Accident Analysis &
Prevention, Vol 34, pp. 31-42.
Bonneson, J. A. and McCoy, P.T.(1993) “Estimation of safety at two-way stop-controlled intersections on rural highways”, TRR 1401, pp 26-37
Donnell, Eric T., John, M., and Mason, Jr.(2006). “Predicting the frequency of median barrier crashes on Pennsylvania interstate highways”, accident Analysis & Prevention, Volume 38, Issue 3 Hauer, E., Council, F.M. and Mohammedshah, Y.(2007). “Safety
Models for Urban Four-Lane Undivided Road Segments”, Transportation Research Record 1897, TRB, pp96-105 Joshua, S.C.and Garber, N.J.(1990). “Estimating Truck Accident,
Rate and Involvements Using Linear and Poisson Regression Models”, Transportation Planning and Technology, Vol15, pp41-58
Jovanis, P. P. and Chang H. L.(1986). “Modelling the relationship of Accidents to Miles Travelled”, Transportation Research Record 1068, pp. 42-51
Lau, M. Y. and May, A. D.(1988). “Accident Prediction Model Development: Signalized Intersections”, Institute of Transportation Studies, UCB-ITS-RR-88-7, University of California-Berkeley, December.
Lyon, C., Oh, J., Persaud, B.N., Washington, S.P., and Bared, J.(2003). “Empirical Investigation of the IHSDM Accident Prediction Algorithm for Rural Intersections”. Transportation Research Record 1840. pp. 78-86
McCoy, P.T., and Malone, M.S.(1989). “Safety Effects of Left-Turn Lanes on Urban Four-Lane Roadways”, Transportation Research Record 1239, pp 24-36
Miaou, S. P. and Lum, H.(1993). “Modeling vehicle accidents and highway geometric design relationship”, Accident Analysis and Prevention, 25(6), pp. 689-709
Milton, J. C. and Mannering, F. L.(1998). “Then relationship among highway geometrics, traffic-related elements and motor-vehicle accident frequencies”Transportation Research Record, 25, pp.
395-413
Mullahy, J.(1986). “Specification and testing of some modified count data models”. Journal of Econometrics 3, pp.341-365 Poch, M. and Mannering, F.(1996). “Negative binomial analysis of
intersection-accident frequencies”, Journal of Transportation Engineering, 122(2), pp. 105-113
Shankar, V., Milton, J. C. and Mannering, F. L.(1997). “Modeling accident frequencies as zero-altered probability process : An empirical inquiry”, Accident Analysis and Prevention, 29(6), pp.829-837
Sheffer, C. and Janson, B.N.(1999). “Accident and capacity comparisons of leading and lagging left-turn signal phasings”, Transportation Research Board, National Research Council, January
Zegeer, C.V., Stewart, R., Council, F. and Neuman, T.R.(1994).
“Accident relationships of roadway width on low-volume roads”, Transportation Research Board. No.1445
( 접수일 : 2012. 2. 8 / 심사일 : 2012. 2. 21 / 심사완료일 : 2012. 3. 20 )