• 검색 결과가 없습니다.

The Relationship Between Coronary Artery Calcification and Bone Mineral Density in Patients According to Their Metabolic Syndrome Status

N/A
N/A
Protected

Academic year: 2022

Share "The Relationship Between Coronary Artery Calcification and Bone Mineral Density in Patients According to Their Metabolic Syndrome Status"

Copied!
7
0
0

로드 중.... (전체 텍스트 보기)

전체 글

(1)

76

Open Access

The Relationship Between Coronary Artery Calcification and Bone Mineral Density in Patients

According to Their Metabolic Syndrome Status

Hyung Tak Lee, MD

1

, Jinho Shin, MD

1

, Young-Hyo Lim, MD

1

, Bae Keun Kim, MD

1

, Young Taek Kim, MD

1

, Jae Ung Lee, MD

1

, Sangmo Hong, MD

2

, Soon Young Song, MD

3

and Sam Hyun Cho, MD

4

1

Division of Cardiology,

2

Endocrinology and Metabolism, Departments of Internal Medicine,

3

Radiology and

4

Obsterics and Gynecology, Hanyang University College of Medicine, Seoul, Korea

ABSTRACT

Background and Objectives: The extent of coronary artery calcification (CAC) is closely related to total atherosclerotic plaque burden. However, the pathogenesis of CAC is still unclear. Conditions such as diabetes mellitus, renal failure, smoking, and chronic inflammation have been suggested to link vascular calcification and bone loss. In the present study, we hypothe- sized that bone loss can contribute to the pathogenesis of CAC in patients with the chronic inflammatory condition that ac- companies metabolic syndrome (MetS). The objective of this study was to investigate the relationship between CAC and bone mineral density (BMD) in patients with MetS and in patients without MetS, by using coronary multidetector-row computed tomography (MDCT). Subjects and Methods: Data from 395 consecutive patients was analyzed retrospectively. From the MDCT database, only those patients who underwent both coronary MDCT and dual-energy X-ray absorptiometry within an interval of one month, were selected. The presence of MetS was determined by the updated criteria as defined by the Third Adult Treatment Panel Report of the National Cholesterol Education Program. Results: In patients with MetS, a significant correlation was found between CAC and age {odds ratio (OR)=1.139, 95% confidence interval (CI) 1.080 to 1.201, p<0.001}, CAC and male sex (OR=3.762, 95% CI 1.339 to 10.569, p=0.012), and CAC and T-score of L-spine (OR=0.740, 95% CI 0.550 to 0.996, p=0.047) using a forward multiple logistic regression analysis model including clinical variables of gender, age, lipid profile, body mass index, diabetes mellitus, hypertension, smoking, and BMD. But in patients without MetS, BMD by itself was not found to contribute to CAC. Conclusion: BMD was inversely correlated with CAC only in patients with MetS. This find- ing suggests that low BMD accompanied by MetS, may have significant clinical implications. (Korean Circ J 2011;41:76-82) KEY WORDS: Bone density; Metabolic syndrome X; Coronary artery disease.

Received: June 8, 2010 Revision Received: July 1, 2010 Accepted: July 21, 2010

Correspondence: Jinho Shin, MD, Division of Cardiology, Department of Internal Medicine, Hanyang University College of Medicine, 17 Haeng- dang-dong, Seongdong-gu, Seoul 133-792, Korea

Tel: 82-2-2290-8308, Fax: 82-2-2298-9183 E-mail: jhs2003@hanyang.ac.kr

• The authors have no financial conflicts of interest.

cc
This is an Open Access article distributed under the terms of the Cre- ative Commons Attribution Non-Commercial License (http://creativecom- mons.org/licenses/by-nc/3.0) which permits unrestricted non-commer- cial use, distribution, and reproduction in any medium, provided the origi- nal work is properly cited.

Introduction

Coronary artery calcification (CAC) has been shown to play an important role of a risk marker in the development of ath-

erosclerosis.

1)

CAC is closely related to total atherosclerotic plaque burden.

1)

However, the pathogenesis of CAC is still un- clear. Some studies have suggested that the degree of CAC cor- relates with local vascular inflammation.

2)3)

Metabolic syndrome (MetS) is associated with low-grade systemic inflammation.

4)

MetS is characterized by clustering of cardiovascular risk factors including central adiposity, in- sulin resistance, hypertension, dyslipidemia, and a proinflam- matory state.

5)

Some studies have shown that both insulin re- sistance and atherosclerosis share a common inflammatory process.

6)

Controversially, some studies have reported the association

between low bone mineral density (BMD) and coronary ar-

tery disease.

7)8)

Several mechanisms have been suggested to

link vascular calicification and bone loss, including ageing, di-

(2)

abetes mellitus, renal failure, smoking, chronic inflammation, and oxidative stress.

9)

In the present study, we hypothesized that bone loss can contribute to the pathogenesis of CAC in pa- tients with the chronic inflammatory condition that accom- panies MetS. Hence in this study, we aimed to investigate the relationship between CAC and BMD in patients with MetS and in patients without MetS, by using coronary multidetec- tor-row computed tomography (MDCT).

Subjects and Methods

Study population

The dataset was acquired from the MDCT database at the Hanyang University Hospital, Seoul, Korea, from March 29th 2007 to June 25th 2009. From this database 3,521 patients who underwent both coronary MDCT and dual-energy X-ray ab- sorptiometry (DEXA) within an interval of one month were en- rolled. Finally, data from 395 consecutive patients was analyz- ed retrospectively.

All of these patients had undergone physical examination at the health promotion center. A fasting lipid profile {total cho- lesterol, high density lipoprotein-cholesterol (HDL-C), low density lipoprotein-C (LDL-C), and triglycerides} plus blood glucose tests were performed on each of the study participant.

Blood pressure (BP) was measured by a mercury sphygmoma- nometer by the physician and the average of at least two mea- surements taken five minutes apart, were recorded. Weight and height of each study participant, for calculation of the body mass index (BMI) (kg/m

2

) were also recorded at the same vis- it. Clinical information was collected by reviewing each pa- tient’s medical records.

Prevalent diabetes was defined as a self-report of a history of being told by a physician that he/she had diabetes or was hav- ing a fasting blood glucose level of greater than or equal to 126 mg/dL. Hypertension was defined as average BP of at least 140/90 mmHg on two consecutive measurements taken five minutes apart or undergoing antihypertensive drug treat- ment due to a history of hypertension. The presence of MetS was determined by the updated criteria as defined by the Th- ird Adult Treatment Panel (ATP III) Report of the National Cholesterol Education Program.

10)

We modified the criteria and we used BMI ≥25 kg/m

2

instead of waist circumference cutpoints.

11)

Subjects with three or more of the following cri- teria: 1) BMI ≥25 kg/m

2

; 2) Serum triglycerides levels of ≥150 mg/dL or undergoing drug treatment for elevated serum tri- glycerides levels ; 3) HDL-C levels of ≤40 mg/dL in men and

≤50 mg/dL in women or undergoing drug treatment for low HDL-C; 4) fasting blood glucose level of ≥100 mg/dL or un- dergoing drug treatment for elevated fasting blood glucose level ; or 5) BP of at least 130/85 mmHg or undergoing anti- hypertensive drug treatment due to a history of hypertension.

The study protocol was approved by the Institutional Re-

view Board of the Hanyang University Hospital.

Coronary calcification measurements

CT scans were performed on a 64-MDCT scanner (Bril- liance 64, Philips Medical Systems, Best, The Netherlands).

About sixty, 0.9-mm thick slices of the coronary arteries were obtained during a single breath-hold for the time period of 15-20 seconds, using prospective electrocardiography-gated axial scanning. All the CT images were analyzed for the pres- ence and the extent of CAC according to the Agatston method, by using the coronary calcium quantification software (Aqu- arius workstation, TeraRecon, Inc., San Mateo, CA, USA).

12)

Bone mineral density measurements

BMD was measured at the lumbar spine (L-spine) and fe- mur using DEXA (Discovery-W, Hologic Inc., Bedford, MA, USA). The results were interpreted in terms of BMD (g/cm

2

) and the T-score. T-score was calculated by taking the difference between a patient’s measured BMD and the mean BMD of he- althy young adults matched for gender and ethnicity, and di- viding by the standard deviation (SD) of the young adult po- pulation.

Statistical analysis

All data are presented as the means and standard deviations, and statistical analysis was performed using Statistical Pack- age for the Social Sciences (SPSS, version 13.0; SPSS Inc., Chi- cago, IL, USA). A p<0.05 was considered statistically significant.

Student’s t-test was used for comparison of measured values between the two groups divided according to the presence of MetS. In order to compare the significance between the two groups, chi-square test was used. Univariate logistic re- gression analyses were used to identify the relationship be- tween CAC and clinical variables. In the univariate logistic re- gression analysis; lipid profile, fasting blood glucose, age, BP, BMD, and BMI were analyzed as continuous variables.

In the total patients, three multiple logistic regression anal- ysis models were used to estimate the independent correla- tion between CAC and clinical variables. Gender, age, smok- ing, BMD, LDL-C, MetS, and interaction of MetS with BMD were included as in all the models. Collinearity was present between MetS and hypertension, MetS and diabetes melli- tus, MetS and BMI, MetS and triglycerides, and MetS and HDL-C. Hence these risk factors associated with MetS, were excluded from the models for the total patients. For the total patients, in the first model T-score of L-spine was included. In the second model, T-score of femur was included. In the third model, T-scores of both L-spine and femur were included.

In patients with MetS and in patients without MetS, three

multiple logistic regression analysis models were also used to

estimate the independent correlation between CAC and cli-

nical variables. Due to the exclusion of MetS from the analy-

(3)

sis models, gender, age, lipid profile, BMI, diabetes mellitus, hypertension, smoking, and BMD were included in all the models. Collinearity was seen between LDL-C level and st- atin medication. Collinearity was also seen between hyper- tension status and antihypertensive medication. Hence, we excluded medication status from all the multiple logistic re- gression models. The inclusion criterion for the forward mul- tiple logistic regression analysis was p<0.05 while the exclu- sion criterion was p>0.10. In all the multiple logistic regress- ion analysis, lipid profile, age, BMD, and BMI were analyzed as continuous variables. Odd ratio (OR) is presented with 95%

confidence interval (CI) in parenthesis.

Results

General characteristics of the subjects

The clinical characteristics of the study population are dis- played in Table 1. The mean (±SD) age of the subjects was 51±

10 years and the proportion of males was 55.9%. Proportion of diabetes was 11.6%, proportion of hypertension was 32.7%, and proportion of MetS was 33.2%.

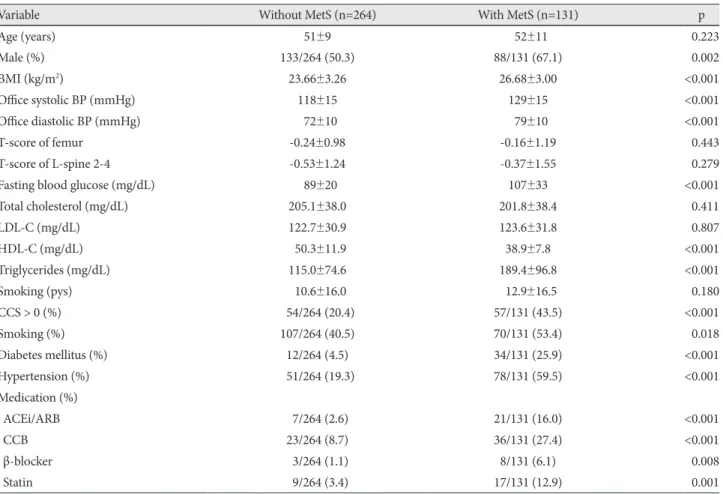
In the two groups divided by the presence of MetS, there were 264 subjects without MetS and there were 131 subjects with MetS. The significant differences between the group wi- thout MetS versus the group with MetS respectively were as follows: proportion of males: 50.3% vs. 67.1%, p=0.002, BMI:

23.66±3.26 vs. 26.68±3.00 kg/m

2

, p<0.001, office systolic BP:

118±15 vs. 129±15 mmHg, p<0.001, office diastolic BP: 72±

10 vs. 79±10 mmHg, p<0.001, Fasting blood glucose: 89±20 vs. 107±33 mg/dL, p<0.001, HDL-C: 50.3±11.9 vs. 38.9±7.8 mg/dL, p<0.001, triglycerides: 115.0±74.6 vs. 189.4±96.8 mg/

dL, p<0.001, proportion of CCS >0: 20.4% vs. 43.5%, p<0.001, proportion of smokers: 40.5% vs. 50.4%, p=0.018, propor- tion of diabetes mellitus: 4.5% vs. 25.9%, p<0.001, and pro- portion of hypertension: 19.3% vs. 59.5%, p<0.001 (Table 2).

Crude relationship between coronary artery calcification and clinical variables

Univariate correlation between CAC and clinical variables are listed in Table 3. A significantly positive correlation was fo- und between: CAC and age (OR=1.112, 95% CI 1.082 to 1.142, p<0.001), CAC and male sex (OR=3.338, 95% CI 2.041 to 5.461, p<0.001), CAC and BMI (OR=1.066, 95% CI 1.002 to 1.134, p=0.044), CAC and office systolic BP (OR=1.023, 95%

CI 1.010 to 1.037, p=0.001), CAC and office diastolic BP (OR=1.032, 95% CI 1.011 to 1.053, p=0.002), CAC and fast- ing blood glucose (OR=1.017, 95% CI 1.007 to 1.027, p<0.001), CAC and triglycerides (OR=1.003, 95% CI 1.001 to 1.005, p=0.016), CAC and diabetes mellitus (OR=4.483, 95% CI 2.373 to 8.469, p<0.001), CAC and hypertension (OR=3.875, 95% CI 2.440 to 6.155, p<0.001), CAC and MetS (OR=2.995, 95% CI 1.897 to 4.730, p<0.001), and CAC and smoking (OR=

1.596, 95% CI 1.027 to 2.481, p=0.038).

CAC was inversely correlated with T-score of femur (OR=

0.774, 95% CI 0.628 to 0.955, p=0.017), with T-score of L- spine (OR=0.826, 95% CI 0.699 to 0.976, p=0.025), and with HDL-C (OR=0.958, 95% CI 0.938 to 0.979, p<0.001).

Independent relationship between coronary artery calcification and clinical variables in the total patients

In the three multiple logistic regression analysis models, a significant correlation was found between: CAC and age (OR

=1.148, 95% CI 1.111 to 1.187, p<0.001), CAC and male sex (OR=7.188, 95% CI 3.790 to 13.631, p<0.001), and CAC and MetS (OR=2.850, 95% CI 1.642 to 4.948, p<0.001) (Table 4).

T-score of femur and/or L-spine was not an independent pre- dictor of CAC. No significant correlation was found between CAC and the interaction between MetS and BMD.

Independent relationship between coronary artery calcification and clinical variables in patients without metabolic syndrome

In the three multiple logistic regression analysis models, a Table 1. Clinical characteristics of the patients

Age (year) 51±10

Male (%) 221/395 (55.9)

BMI (kg/m

2

) 24.66±3.48

Office systolic BP (mmHg) 121±16

Office diastolic BP (mmHg) 074±11

T-score of femur -0.21±1.05

T-score of L-spine 2-4 -0.48±1.35

Fasting blood glucose (mg/dL) 095±27

Total cholesterol (mg/dL) 204.0±38.1

LDL-C (mg/dL) 123.0±31.2

HDL-C (mg/dL) 046.5±12.0

Triglycerides (mg/dL) 139.7±89.6

Smoking (pys) 011.4±16.2

CCS >0 (%) 111/395 (28.1)

Smoking (%) 177/395 (44.8)

Diabetes mellitus (%) 046/395 (11.6)

Hypertension (%) 129/395 (32.7)

Metabolic syndrome (%) 131/395 (33.2)

Medication (%)

ACEi/ARB 28/395 (7.1)

CCB 059/395 (14.9)

β-blocker 11/395 (2.8)

Statin 26/395 (6.6)

Data is reported as mean (±SD) or percentage. BMI: body mass in-

dex, BP: blood pressure, L-spine: lumbar spine, LDL-C: low density

lipoprotein-cholesterol, HDL-C: high density lipoprotein-choles-

terol, CCS: coronary calcium score, ACEi: angiotensin converting en-

zyme inhibitor, ARB: angiotensin receptor blocker, CCB: calcium

channel blocker

(4)

significant correlation was found between: CAC and age (OR=

1.141, 95% CI 1.089 to 1.195, p<0.001), CAC and male sex (OR

=10.101, 95% CI 4.165 to 24.496, p<0.001), CAC and diabe- tes mellitus (OR=7.822, 95% CI 1.451 to 42.174, p=0.017) and CAC and hypertension (OR=4.779, 95% CI 2.036 to 11.219, p<0.001) (Table 5). T-score of femur and/or L-spine was not an independent predictor of CAC.

Independent relationship between coronary artery calcification and clinical variables in patients with metabolic syndrome

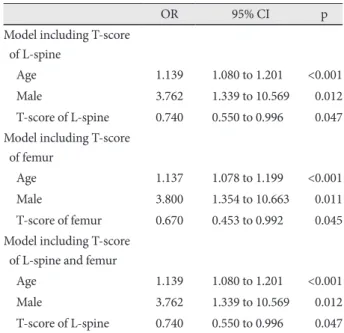
In the multiple logistic regression analysis model including T-score of L-spine, a significant correlation was found between:

CAC and age (OR=1.139, 95% CI 1.080 to 1.201, p<0.001), CAC and male sex (OR=3.762, 95% CI 1.339 to 10.569, p=

0.012), and CAC and T-score of L-spine (OR=0.740, 95% CI 0.550 to 0.996, p=0.047) (Table 6).

In the multiple logistic regression analysis model includ- ing T-score of femur, a significant correlation was found be- tween: CAC and age (OR=1.137, 95% CI 1.078 to 1.199, p<

0.001), CAC and male sex (OR=3.800, 95% CI 1.354 to 10.663, p=0.011), and CAC and T-score of femur (OR=0.670, Table 2. Comparison of the clinical characteristics between the two patient groups, divided by the presence of metabolic syndrome

Variable Without MetS (n=264) With MetS (n=131) p

Age (years) 51±9 052±11 0.223

Male (%) 133/264 (50.3) 88/131 (67.1) 0.002

BMI (kg/m

2

) 23.66±3.26 26.68±3.00 <0.001

Office systolic BP (mmHg) 118±15 129±15 <0.001

Office diastolic BP (mmHg) 072±10 079±10 <0.001

T-score of femur -0.24±0.98 -0.16±1.19 0.443

T-score of L-spine 2-4 -0.53±1.24 -0.37±1.55 0.279

Fasting blood glucose (mg/dL) 089±20 107±33 <0.001

Total cholesterol (mg/dL) 205.1±38.0 201.8±38.4 0.411

LDL-C (mg/dL) 122.7±30.9 123.6±31.8 0.807

HDL-C (mg/dL) 050.3±11.9 38.9±7.8 <0.001

Triglycerides (mg/dL) 115.0±74.6 189.4±96.8 <0.001

Smoking (pys) 010.6±16.0 012.9±16.5 0.180

CCS > 0 (%) 054/264 (20.4) 57/131 (43.5) <0.001

Smoking (%) 107/264 (40.5) 70/131 (53.4) 0.018

Diabetes mellitus (%) 12/264 (4.5) 34/131 (25.9) <0.001

Hypertension (%) 051/264 (19.3) 78/131 (59.5) <0.001

Medication (%)

ACEi/ARB 07/264 (2.6) 21/131 (16.0) <0.001

CCB 23/264 (8.7) 36/131 (27.4) <0.001

β-blocker 03/264 (1.1) 8/131 (6.1) 0.008

Statin 09/264 (3.4) 17/131 (12.9) 0.001

Data is reported as mean (±SD) or percentage. MetS: metabolic syndrome, BMI: body mass index, BP: blood pressure, L-spine: lumbar spine, LDL-C: low density lipoprotein-cholesterol, HDL-C: high density lipoprotein-cholesterol, CCS: coronary calcium score, ACEi: angiotensin converting enzyme inhibitor, ARB: angiotensin receptor blocker, CCB: calcium channel blocker

Table 3. Univariate correlation between coronary artery calcifica- tion and clinical variables using a univariate logistic regression analysis

OR 95% CI p

Age (year) 1.112 1.082 to 1.142 <0.001

Male 3.338 2.041 to 5.461 <0.001

BMI (kg/m

2

) 1.066 1.002 to 1.134 0.044

Office systolic BP (mmHg) 1.023 1.010 to 1.037 0.001 Office diastolic BP (mmHg) 1.032 1.011 to 1.053 0.002 T-score of femur 0.774 0.628 to 0.955 0.017 T-score of L-spine 2-4 0.826 0.699 to 0.976 0.025 Fasting blood glucose (mg/dL) 1.017 1.007 to 1.027 <0.001

LDL-C (mg/dL) 1.001 0.994 to 1.008 0.746

HDL-C (mg/dL) 0.958 0.938 to 0.979 <0.001 Triglycerides (mg/dL) 1.003 1.001 to 1.005 0.016 Diabetes mellitus 4.483 2.373 to 8.469 <0.001 Hypertension 3.875 2.440 to 6.155 <0.001 Metabolic syndrome 2.995 1.897 to 4.730 <0.001

Smoking 1.596 1.027 to 2.481 0.038

OR: odds ratio, CI: confidence interval, BMI: body mass index, BP:

blood pressure, L-spine: lumbar spine, LDL-C: low density lipopro-

tein-cholesterol, HDL-C: high density lipoprotein-cholesterol

(5)

95% CI 0.453 to 0.992, p=0.045) (Table 6).

In the multiple logistic regression analysis model includ- ing T-scores of both femur and L-spine, a significant correla- tion was found between: CAC and age (OR=1.139, 95% CI 1.080 to 1.201, p<0.001), CAC and male sex (OR=3.762, 95%

CI 1.339 to 10.569, p=0.012), and CAC and T-score of L-spine (OR=0.740, 95% CI 0.550 to 0.996, p=0.047) (Table 6).

Discussion

The main finding of this study is that BMD is an indepen- dent determinant of CAC, only in patients with MetS. BMD is not an independent predictor of CAC in total patients nor in patients without MetS. Based on this finding, we could speculate that low BMD may contribute to the pathogenesis of CAC only in those patients with the low-grade chronic in- flammatory condition that accompanies MetS.

A few studies have documented the increased risk of cor- onary atherosclerosis associated with CAC, in the subjects with low BMD.

7)8)13)

However, it is still unclear whether low BMD can be an independent predictor of CAC, even after a careful adjustment of the other risk factors for coronary ar- tery disease. In the present study, no statistically significant correlation was found between CAC and BMD in the total patients, nor in the patients without MetS. These findings are partially consistent with some studies which suggest that bone loss and CAC are two independent processes.

14)15)

From a cli- nical viewpoint, the results of the present study suggest that so far, low BMD is less likely to be regarded as one of the major risk factors for coronary artery disease, inspite of the numer- ous experimental results suggesting an association between low BMD and vascular calcification. But the results in patients with MetS, might call attention to low BMD as a marker for CAC. However considering MetS with regards to coronary atherosclerosis; a low-grade inflammatory process with vis- ceral obesity is strongly associated with coronary atheroscle- rosis.

16)17)

In this study, there was a significant correlation be- tween CAC and MetS. This result is consistent with the result from the previous study which demonstrated the relationship Table 4. Independent predictors of coronary artery calcification in the

total patients using a forward multiple logistic regression analysis

OR 95% CI p

Model including T-score of L-spine

Age 1.148 1.111 to 1.1870 <0.001

Male 7.188 3.790 to 13.631 <0.001

Metabolic syndrome 2.850 1.642 to 4.9480 <0.001 Model including T-score

of femur

Age 1.148 1.111 to 1.1870 <0.001

Male 7.188 3.790 to 13.631 <0.001

Metabolic syndrome 2.850 1.642 to 4.9480 <0.001 Model including L-spine

and femur

Age 1.148 1.111 to 1.1870 <0.001

Male 7.188 3.790 to 13.631 <0.001

Metabolic syndrome 2.850 1.642 to 4.9480 <0.001 OR: odds ratio, CI: confidence interval, L-spine: lumbar spine Table 5. Independent predictors of coronary artery calcification in patients without metabolic syndrome using a forward multiple lo- gistic regression analysis

OR 95% CI p

Model including T-score of L-spine

Age 01.141 1.089 to 1.1950 <0.001

Male 10.101 4.165 to 24.496 <0.001

Diabetes mellitus 07.822 1.451 to 42.174 0.017 Hypertension 04.779 2.036 to 11.219 <0.001 Model including T-score

of femur

Age 01.141 1.089 to 1.1950 <0.001

Male 10.101 4.165 to 24.496 <0.001

Diabetes mellitus 07.822 1.451 to 42.174 0.017 Hypertension 04.779 2.036 to 11.219 <0.001 Model including L-spine

and femur

Age 01.141 1.089 to 1.1950 <0.001

Male 10.101 4.165 to 24.496 <0.001

Diabetes mellitus 07.822 1.451 to 42.174 0.017 Hypertension 04.779 2.036 to 11.219 <0.001 OR: odds ratio, CI: confidence interval, L-spine: lumbar spine

Table 6. IIndependent predictors of coronary artery calcification in pa- tients with metabolic syndrome using a forward multiple logistic re- gression analysis

OR 95% CI p

Model including T-score of L-spine

Age 1.139 1.080 to 1.2010 <0.001

Male 3.762 1.339 to 10.569 0.012

T-score of L-spine 0.740 0.550 to 0.9960 0.047 Model including T-score

of femur

Age 1.137 1.078 to 1.1990 <0.001

Male 3.800 1.354 to 10.663 0.011

T-score of femur 0.670 0.453 to 0.9920 0.045 Model including T-score

of L-spine and femur

Age 1.139 1.080 to 1.2010 <0.001

Male 3.762 1.339 to 10.569 0.012

T-score of L-spine 0.740 0.550 to 0.9960 0.047

OR: odds ratio, CI: confidence interval, L-spine: lumbar spine

(6)

between CAC and Mets.

18-20)

It has also been shown that insu- lin resistance and atherosclerosis share a common inflamma- tory mechanism.

6)

Specifically in this study, an independent relationship was found between CAC and BMD, only in patients with MetS.

Chronic low-grade inflammatory processes or mediators are also known to be involved in the mechanism by which low BMD contributes in the pathogenesis of atherosclerosis. IL-6 and oxidized LDL are reported to be involved in vascular cal- cification by osteogenic de-differentiation of vascular smooth muscle cells.

21)

Potentially, low BMD could provide a milieu fa- voring vascular calcification through impaired phosphorous and calcium metabolism. Theoretically, there may be three possible explanations for interpreting this finding. Firstly, both the inflammatory process and impaired calcium/phos- phorous metabolism are essential for CAC. This is less likely because MetS alone is independently associated with CAC.

Secondly, even with an impaired calcium/phosphorus metab- olism, MetS plays a permissive role in the pathogenesis of CAC.

Thirdly, there might be a synergistic interaction between MetS and BMD. Since there was no synergistic interaction between BMD and MetS in this study, we can speculate that impaired calcium/phosphorous metabolism aggravates the pathogen- esis of CAC only with accompanying MetS, associated with the chronic low-grade inflammation, whereas impaired calci- um/phosphorous metabolism alone does not trigger the pa- thogenesis of CAC.

However, there are some limitations to our study. The major limitation is the possibility of a type II error due to the small sam- ple size. Also because of the cross-sectional design of this study, we cannot conclude whether low BMD is pathogenetically linked to coronary calcification or it just represents one of the markers for subclinical coronary atherosclerosis in patients with MetS. Secondly in this study, the criteria of waist circum- ference was not used. Although use of ATP III criteria to de- fine MetS in Korean populations

11)

is not appropriate, since we have used measures of BMI instead of waist circumference there is a possibility that we may have misclassified some sub- jects who would have been classified differently based on meas- ures of waist circumference. Thirdly, since data on menopause was not available, we could not include menopause status as a variable in the multiple logistic regression analysis models.

Some reports have shown that estrogen deficiency could pos- sibly affect both vascular calcification and osteoporosis in wo- men.

22)

Due to the possibility that the confounding factor was not fully adjusted, these findings cannot be applied to peri- menopausal women. Fourthly, serum inflammatory marker such as hs-CRP, known to trigger the pathogenesis of CAC, was not available in this study. Hence , we could not demonstrate the direct relationship of vascular inflammation and CAC.

In conclusion, BMD is an independent determinant of CAC in patients with MetS. This finding suggests that it may there-

fore be meaningful to check for the presence of MetS, when evaluating patients with low BMD for the risk of developing coronary artery disease.

REFERENCES

1) Rumberger JA, Simons DB, Fitzpatrick LA, Sheedy PF, Schwartz RS.

Coronary artery calcium area by electron-beam computed tomography and coronary atherosclerotic plaque area: a histopathologic correlative study. Circulation 1995;92:2157-62.

2) Mazzini MJ, Schulze PC. Proatherogenic pathways leading to vascu- lar calcification. Eur J Radiol 2006;57:384-9.

3) Moe SM, Chen NX. Inflammation and vascular calcification. Blood Purif 2005;23:64-71.

4) Festa A, D’Agostino R Jr, Howard G, Mykkanen L, Tracy RP, Haffner SM. Chronic subclinical inflammation as part of the insulin resistance syndrome: the Insulin Resistance Atherosclerosis Study (IRAS). Cir- culation 2000;102:42-7.

5) Sakkinen PA, Wahl P, Cushman M, Lewis MR, Tracy RP. Clustering of procoagulation, inflammation, and fibrinolysis variables with meta- bolic factors in insulin resistance syndrome. Am J Epidemiol 2000;

152:897-907.

6) Fernandez-Real JM, Ricart W. Insulin resistance and inflammation in an evolutionary perspective: the contribution of cytokine genotype/

phenotype to thriftiness. Diabetologia 1999;42:1367-74.

7) Farhat GN, Strotmeyer ES, Newman AB, et al. Volumetric and areal bone mineral density measures are associated with cardiovascular disease in older men and women: the health, aging, and body compo- sition study. Calcif Tissue Int 2006;79:102-11.

8) Barengolts EI, Berman M, Kukreja SC, Kouznetsova T, Lin C, Chom- ka EV. Osteoporosis and coronary atherosclerosis in asymptomatic postmenopausal women. Calcif Tissue Int 1998;62:209-13.

9) Hofbauer LC, Brueck CC, Shanahan CM, Schoppet M, Dobnig H.

Vascular calcification and osteoporosis: from clinical observation to- wards molecular understanding. Osteoporos Int 2007;18:251-9.

10) Grundy SM, Cleeman JI, Daniels SR, et al. Diagnosis and manage- ment of the metabolic syndrome: an American Heart Association/Na- tional Heart, Lung, and Blood Institute scientific statement. Curr Opin Cardiol 2006;21:1-6.

11) Lee WY, Park JS, Noh SY, Rhee EJ, Kim SW, Zimmet PZ. Prevalence of the metabolic syndrome among 40,698 Korean metropolitan sub- jects. Diabetes Res Clin Pract 2004;65:143-9.

12) Agatston AS, Janowitz WR, Hildner FJ, Zusmer NR, Viamonte M Jr, De- trano R. Quantification of coronary artery calcium using ultrafast com- puted tomography. J Am Coll Cardiol 1990;15:827-32.

13) Choi SH, An JH, Lim S, et al. Lower bone mineral density is associat- ed with higher coronary calcification and coronary plaque burdens by multidetector row coronary computed tomography in pre- and post- menopausal women. Clin Endocrinol (Oxf) 2009;71:644-51.

14) Sinnott B, Syed I, Sevrukov A, Barengolts E. Coronary calcification and osteoporosis in men and postmenopausal women are independent processes associated with aging. Calcif Tissue Int 2006;78:195-202.

15) Farhat G, Cauley J, Matthews K, et al. Volumetric BMD and vascular calcification in middle-aged women: the Study of Women’s Health Ac- ross the Nation. J Bone Miner Res 2006;21:1839-46.

16) Cha B, Kim H. Metabolic syndrome and cardiovascular disease. Ko- rean Circ J 2003;33:645-52.

17) Noh HJ, Kwon NH, Joo SB. Severity of coronary atherosclerosis: in- fluence of metabolic syndrome risk factor clustering and hs-CRP. Ko- rean Circ J 2006;36:802-8.

18) Kim D, Choi SY, Choi EK, et al. Distribution of coronary artery calci- fication in an asymptomatic Korean population: association with risk factors of cardiovascular disease and metabolic syndrome. Korean Circ J 2008;38:29-35.

19) Reilly MP, Wolfe ML, Rhodes T, Girman C, Mehta N, Rader DJ. Meas-

ures of insulin resistance add incremental value to the clinical diagno-

(7)

sis of metabolic syndrome in association with coronary atherosclerosis.

Circulation 2004;110:803-9.

20) Wong ND, Sciammarella MG, Polk D, et al. The metabolic syndrome, diabetes, and subclinical atherosclerosis assessed by coronary calcium.

J Am Coll Cardiol 2003;41:1547-53.

21) Abedin M, Tintut Y, Demer LL. Vascular calcification: mechanisms

and clinical ramifications. Arterioscler Thromb Vasc Biol 2004;24:

1161-70.

22) Christian RC, Harrington S, Edwards WD, Oberg AL, Fitzpatrick LA.

Estrogen status correlates with the calcium content of coronary ath- erosclerotic plaques in women. J Clin Endocrinol Metab 2002;87:

1062-7.

수치

Table 3. Univariate correlation between coronary artery calcifica- calcifica-tion and clinical variables using a univariate logistic regression  analysis OR 95% CI p Age (year) 1.112 1.082 to 1.142 &lt;0.001 Male 3.338 2.041 to 5.461 &lt;0.001 BMI (kg/m 2
Table 6. IIndependent predictors of coronary artery calcification in pa- pa-tients with metabolic syndrome using a forward multiple logistic  re-gression analysis

참조

관련 문서

Purpose: The aim of this study is to identify the relationship between knowledge and awareness of radiation department students and their intent in

The locations of aneurysms were middle cerebral artery in 15 patients, cerebral artery in 15 patients, cerebral artery in 15 patients, cerebral artery in

Results: In this research, in the group with fibromyalgia patients group, systemic lupus erythematosus patients group and without systemic autoimmune

This study focuses on the overall survival(OS) and the re-recurrence free survival (RFS) rates for patients according to the Milan criteria status at the time of recurrence as

Serum uric acid levels and risk for vascular disease in patients with metabolic syndrome... Prevalence if the metabolic syndrome in a Turkish

Higher open conversion rate and prolonged postoperative hospital stay in LATE group were not caused by the delayed operation in this study it seems to be caused by that

Note: N means patients number according to each 4 severity grades in 112 scrub typhus patients without antibiotics treatment

Bone mineral content (BMC) and bone mineral density (BMD) of the lumbar spine, total hip, and proximal femur were measured before and after exercise... Results : 1) Body