pISSN 1976-1457 eISSN 2005-6168
Sorghum extract exerts an anti-diabetic effect by improving insulin sensitivity via PPAR-γ in mice fed a high-fat diet
Ji Heon Park1, Sun Hee Lee1, Ill-Min Chung2 and Yongsoon Park1§
1Department of Food and Nutrition, Hanyang University, 222, Wangsimni-ro, Seongdong-gu, Seoul 133-791, Korea
2Department of Applied Life Science, Konkuk University, Seoul 143-701, Korea
Abstract
This study investigated the hypothesis that a sorghum extract exerts anti-diabetic effects through a mechanism that improves insulin sensitivity via peroxisome proliferator-activated receptor gamma (PPAR-γ) from adipose tissue. Seven C57BL/6 mice were fed an AIN-93M diet with fat consisting of 10% of total energy intake (LF) for 14 weeks, and 21 mice were fed a high-fat AIN diet with 60% of calories derived from fat (HF). From week 8, the HF diet-fed mice were orally administered either saline (HF group), 0.5% (0.5% SE group), or 1% sorghum extract (1% SE group) for 6 weeks (n = 7/group). Perirenal fat content was significantly lower in the 0.5% SE and 1% SE groups than that in the HF mice. Levels of total and low-density lipoprotein cholesterol, triglycerides, glucose, and the area under the curve for glucose were significantly lower in mice administered 0.5% SE and 1% SE than those in HF mice. Serum insulin level was significantly lower in mice administered 1% SE than that in HF mice or those given 0.5% SE. PPAR-γ expression was significantly higher, whereas the expression of tumor necrosis factor-α was significantly lower in mice given 1% SE compared to those in the HF mice. Adiponectin expression was also significantly higher in mice given 0.5% SE and 1% SE than that in the HF mice. These results suggest that the hypoglycemic effect of SE may be related with the regulation of PPAR-γ-mediated metabolism in this mouse model.
Key Words: Glucose metabolism, mice, PPAR-gamma, TNF-alpha, sorghum extract
Introduction7)
Diabetes mellitus is a metabolic disease characterized by chronic hyperglycemia and is caused by increased hepatic glucose production or abnormal glucose use by skeletal muscle [1,2]. Adipocytokines, a variety of polypeptides secreted from adipocytes such as tumor necrosis factor-α (TNF-α) and adipo- nectin, play an important role in normal metabolic homeostasis and in the development of type 2 diabetes and dyslipidemia [3-5]. Activation of peroxisome proliferator-activated receptor-γ (PPAR-γ) by thiazolidinedione agonists used to manage type 2 diabetes induces adiponectin gene expression and helps improve endogenous insulin sensitivity [6-8]. In contrast, TNF-α is markedly elevated in obese subjects or patients with diabetic mellitus [9] and directly contributes to reduce adiponectin in adipocytes [6].
There has been a demand to identify new compounds for treating type 2 diabetes, and plants have been suggested as a rich and yet unexplored potentially useful source. Sorghum bicolor L. Monech is the fifth most important cereal crop worldwide, both in terms of planted area and metric tons
harvested [10]. Sorghum flour is rich in phytochemical compo- nents, including tannins, phenolic acids, anthocyanins, phytosterols, and policosanols, with a potential to benefit human health [11].
These phytochemicals have gained increased interest due to their antioxidant activities [12], cholesterol-lowering properties [13- 15], and anticarcinogenic [16] and antidiabetic effects [17].
Chung et al. [17,18] demonstrated that a sorghum extract (SE) reduces serum fasting cholesterol and glucose levels, but no previous reports have investigated the effects of sorghum or a SE on changes in adipocytokine levels or on the glucose- lowering pathway. Thus, this study investigated the hypothesis that a SE has antidiabetic effects through a mechanism that improves insulin sensitivity via PPAR-γ in adipose tissue of mice. The purpose of this study was to examine the effects of orally administered 0.5% and 1% SE for 6 weeks on glucose metabolism in mice fed a high-fat (HF) diet.
This work was supported by a grant from the Korea Research Foundation funded by the Korea Rural Development Administration (PJ0081 79062012).
§Corresponding Author: Yongsoon Park, Tel. 82-2-2220-1205, Fax. 82-2-2220-1856, Email. [email protected] Received: May 17, 2012, Revised: July 9, 2012, Accepted: July 13, 2012
ⓒ2012 The Korean Nutrition Society and the Korean Society of Community Nutrition
This is an Open Access article distributed under the terms of the Creative Commons Attribution Non-Commercial License (http://creativecommons.org/licenses/by-nc/3.0/) which permits unrestricted non-commercial use, distribution, and reproduction in any medium, provided the original work is properly cited.
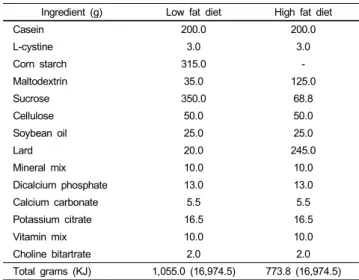
Ingredient (g) Low fat diet High fat diet
Casein 200.0 200.0
L-cystine 3.0 3.0
Corn starch 315.0 -
Maltodextrin 35.0 125.0
Sucrose 350.0 68.8
Cellulose 50.0 50.0
Soybean oil 25.0 25.0
Lard 20.0 245.0
Mineral mix 10.0 10.0
Dicalcium phosphate 13.0 13.0
Calcium carbonate 5.5 5.5
Potassium citrate 16.5 16.5
Vitamin mix 10.0 10.0
Choline bitartrate 2.0 2.0
Total grams (KJ) 1,055.0 (16,974.5) 773.8 (16,974.5)
1)AIN-93 modified diet with 4% fat (10% of calories from fat) content and AIN-93 modified high fat diet with 35% fat (60% of calories from fat) content.
Table 1. Experimental diet compositions1)
Materials and Methods
Animals and diets
This study protocol was approved by the Institutional Animal Care and Use Committee of Hanyang University and was used for all animal experiments (HY-IACUC-10-021). Six-week-old male C57BL/6 mice (Jung Ang Lab. Animal Inc., Seoul, Korea) were housed in individual ventilated cages in an air-conditioned room maintained at 22 ± 2℃ with a 12-h light-dark cycle. Mice were provided food pellets and fresh tap water ad libitum.
After a 1-week acclimatization, seven mice were fed an American Institute of Nutrition (AIN)-93M diet with 10% of total energy from fat for 14 weeks (low fat, LF), and 21 mice were fed a HF AIN diet with 60% of the total energy from fat. After 8 weeks of the HF diet, the mice were randomly divided into three groups (n = 7 each) that received either 0.1 mL of orally administered saline, 0.5% of dietary intake as SE, or 1% of dietary intake as SE for 6 weeks. The SE was dissolved in saline.
The experimental diet compositions are given in Table 1.
Hwanggeumchal sorghum was grown at the Department of Functional Crops, National Institute of Crop Science, Rural Development Administration, Milyang, Korea during the 2009 growing season. Voucher herbarium specimens were deposited with the reference number (KNICS-579) in the Herbarium of the Department of Functional Crops. Identification was made by one of the authors, Dr. Ill-Min Chung of Kon Kuk University [17]. The samples were finely ground with a pin-type mill (DK-201, Sejung Tech, Daegu, Korea) and were extracted in 80%
methanol in a shaker (WiseCube WIS-RL010, Daihan Scientific Co., Ltd., Seoul, Korea) at room temperature for 24 h. Subse- quently, the extracts were centrifuged at 5,000 rpm for 30 min, and the supernatants were filtered through Advantec 2 filter paper (Advantec Toyo Kaisha Ltd., Tokyo, Japan). The combined
filtrate was evaporated using a rotary evaporator (Eyela N-1000, Tokyo Rikakikai Co., Tokyo, Japan) at 40℃ and then freeze- dried in a vacuum (FDT-8612, Operon, Kimpo, Korea).
Food intake was measured daily, and body weight was measured weekly. At the end of the experiment, the mice were fasted overnight and euthanized the next day via exsanguination under anesthesia with an intraperitoneal injection of tiletamine (25 mg/kg), zolazepam (25 mg/kg), and xylazine (10 mg/kg).
Blood was collected in SST tubes via heart puncture and centrifuged at 3,000 rpm for 15 min (HA 1000-3, Hanil Sciences Industrial Co. Ltd., Incheon, Korea) to obtain serum. Organs were harvested, rinsed with physiological saline, and weighed. Blood and tissue samples were stored at -80℃ until further analysis.
Oral glucose tolerance test
After 6 weeks of SE or distilled water administration, the mice were fasted overnight and then orally administered glucose at 2 g/kg body weight. Blood was obtained from the tail vein at 0, 30, 60, 90, and 120 min after administering the glucose, and glucose concentration was determined using a glucocard (Arkray Global Business Inc., Kyoto, Japan). Values of the area under the glucose-time curve (AUC) were calculated.
Glucose and insulin levels
Serum glucose concentration was measured using a commercial kit (Asan Pharm., Hwaseong, Korea) at a wavelength of 500 nm using a spectrophotometer (DU 600, Beckman Coulter, Inc., Fullerton, CA, USA). Serum glucose concentration was calculated from the corrected absorbance, according to the manufacturer’s recommendations. Serum insulin levels were also measured using a commercial kit (Millipore Corp., Billerica, MA, USA) via an enzyme immunoassay at 450 nm with a microplate reader (ELx 800 UV, BIO-TEK Instruments Inc., Winooski, VT, USA).
Lipid profile and liver function
Serum levels of triglycerides, total cholesterol, and high density lipoprotein (HDL)-cholesterol were measured spectrophotometrically (Asan Pharm). Serum concentrations of triglycerides and total cholesterol were calculated from the corrected absorbance, according to the manufacturer’s recommendation. Precipitates were prepared for HDL cholesterol, and the clear supernatant (100 μl) was collected according to the manufacturer’s manual.
Low density lipoprotein (LDL)-cholesterol was calculated using the Friedwald formula [19]. Glutamic oxaloacetic transaminase (GOT) and glutamic pyruvic transaminase (GPT) activities were measured spectrophotometrically using a commercial kit (Asan Pharm).
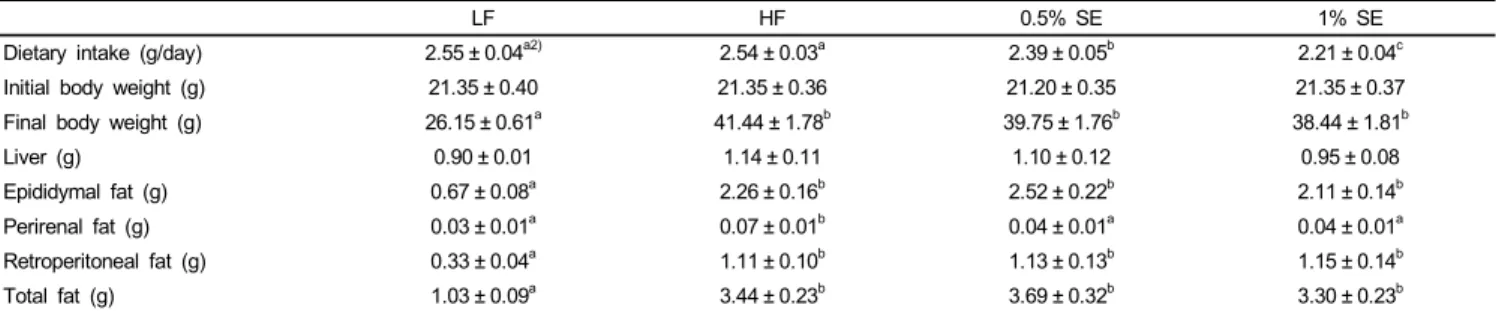
LF HF 0.5% SE 1% SE
Dietary intake (g/day) 2.55 ± 0.04a2) 2.54 ± 0.03a 2.39 ± 0.05b 2.21 ± 0.04c
Initial body weight (g) 21.35 ± 0.40 21.35 ± 0.36 21.20 ± 0.35 21.35 ± 0.37
Final body weight (g) 26.15 ± 0.61a 41.44 ± 1.78b 39.75 ± 1.76b 38.44 ± 1.81b
Liver (g) 0.90 ± 0.01 1.14 ± 0.11 1.10 ± 0.12 0.95 ± 0.08
Epididymal fat (g) 0.67 ± 0.08a 2.26 ± 0.16b 2.52 ± 0.22b 2.11 ± 0.14b
Perirenal fat (g) 0.03 ± 0.01a 0.07 ± 0.01b 0.04 ± 0.01a 0.04 ± 0.01a
Retroperitoneal fat (g) 0.33 ± 0.04a 1.11 ± 0.10b 1.13 ± 0.13b 1.15 ± 0.14b
Total fat (g) 1.03 ± 0.09a 3.44 ± 0.23b 3.69 ± 0.32b 3.30 ± 0.23b
1)Values are expressed as mean ± standard error; n = 7/group. Comparisons between groups were performed with analysis of variance (ANOVA) followed by Duncan’s multiple-range test; LF, low fat diet; HF, high fat diet; 0.5% SE, high fat diet with 0.5% of dietary intake as sorghum extract; 1% SE, high fat diet with 1% of dietary intake as sorghum extract.
2)Values in rows with different letters are significantly different at P< 0.05 by ANOVA and Duncan’s multiple-range test.
Table 2. Dietary intake, body weight, and various organ weights1)
Western blotting
Adipose tissue was homogenized in a buffer containing 10 mM 2-amino-2-hydroxymethyl-propane-1, 3 diol-HCl (pH 7.4), 0.1 M EDTA, 10 mM NaCl, 0.5% Triton X-100, and a protease inhibitor cocktail tablet at 4℃. The homogenates were then centrifuged (14,000 rpm, 10 min, 4℃), and protein concentra- tions were determined (BioRad, Hercules, CA, USA). Duplicates of equal amounts of protein (50 μg) were separated on 10%
polyacrylamide gels, transferred to polyvinylidine fluoride membranes, and blocked for 1 h at room temperature with 5%
skim milk in Tris-buffered saline with Tween 20 (TBST). The membranes were then incubated with an antimouse PPAR-γ (1:700, Santa Cruz Biotechnology, Santa Cruz, CA, USA), antirabbit TNF-α (1:1,000, Cell Signaling Technology, Inc., Beverly, MA, USA), or antirabbit adiponectin (1:1,000, Cell Signaling Technology) with 5% skim milk in TBST overnight at 4℃. After several washes with TBST, the membranes were incubated with antirabbit IgG horseradish peroxidase-conjugated secondary antibody (1:2,000, Cell Signaling Technology) for 1 h at room temperature. Immunoreactive bands were visualized by enhanced chemiluminescence and captured on X-ray film.
The images were converted to TIFF files and quantified using NIH imaging software (ImageJ version 1.37, National Institutes of Health, Bethesda, MD, USA). The relative and normalized protein expression was calculated as a density of β-actin (1:1,000 BD Transduction Laboratory, Franklin Lakes, NJ, USA).
Statistical analysis
Data were analyzed using the SPSS-PC+ statistical software package for Windows, version 17.0 (SPSS Inc., Chicago, IL, USA). All data are expressed as mean ± standard error of the mean. Differences among groups were analyzed using one-way analysis of variance, followed by Duncan’s multiple-range test.
Differences with P < 0.05 were considered significant.
Results
Effect on body composition and food intake
Dietary intake data, initial body weight, final body weight, and weights of the liver, epididymal, perirenal, retroperitoneal, and total fat are presented in Table 2. Dietary intake decreased significantly in a dose-dependent manner in mice fed 0.5% SE and 1% SE compared to that in the mice fed the LF and HF diets. Final body weight and epididymal, retroperitoneal, and total fat weights were significantly lower in mice fed LF than those in mice fed the HF diet and in those with and without SE.
Perirenal fat weight was significantly lower in mice fed the LF diet, 0.5% SE, and 1% SE than that in mice fed the HF diet, suggesting that SE may significantly reduce the accumulation of perirenal fat; however, initial body and liver weights did not significantly differ among the groups.
Effect on hyperglycemia and dyslipidemia
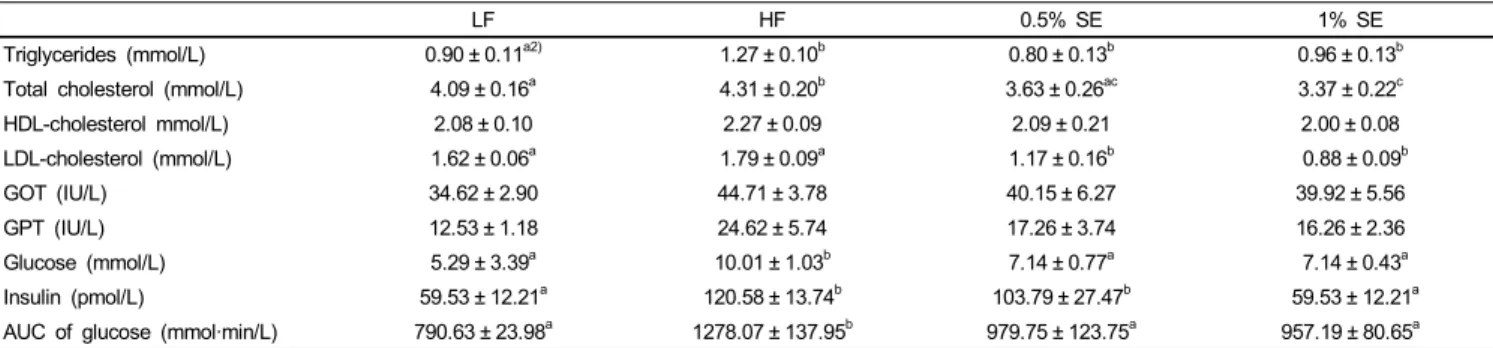
Table 3 shows serum lipid profiles, liver function, levels of glucose and insulin, and the AUC for the glucose tolerance test in each group. Total cholesterol levels were significantly lower in mice given 0.5% SE and 1% SE than those in HF diet fed mice and was lower in mice given 1% SE than those in mice fed the LF diet. LDL-cholesterol level was significantly (P <
0.001) lower in mice given 0.5% SE and 1% SE than that in the HF and low fat diet fed mice. Serum levels of glucose and triglycerides were significantly lower in mice given 0.5% SE and 1% SE than those in the HF mice but was not significantly lower than those in the LF diet fed mice. The mice fed the HF diet had a significant elevation in blood glucose level throughout the oral glucose tolerance test compared with those in the LF, 0.5%
SE, and 1% SE groups (Fig. 1). The AUC for glucose decreased by 23% and 25% in mice given 0.5% SE or 1% SE, respectively, compared to that of the HF mice (Fig. 1 and Table 3). Serum insulin levels were significantly lower in mice fed 1% SE or the LF diet than in mice in the HF and 0.5% SE groups. No significant differences in levels of serum HDL-cholesterol, GOT, and GPT were observed among the groups.
LF HF 0.5% SE 1% SE
Triglycerides (mmol/L) 0.90 ± 0.11a2) 1.27 ± 0.10b 0.80 ± 0.13b 0.96 ± 0.13b
Total cholesterol (mmol/L) 4.09 ± 0.16a 4.31 ± 0.20b 3.63 ± 0.26ac 3.37 ± 0.22c
HDL-cholesterol mmol/L) 2.08 ± 0.10 2.27 ± 0.09 2.09 ± 0.21 2.00 ± 0.08
LDL-cholesterol (mmol/L) 1.62 ± 0.06a 1.79 ± 0.09a 1.17 ± 0.16b 0.88 ± 0.09b
GOT (IU/L) 34.62 ± 2.90 44.71 ± 3.78 40.15 ± 6.27 39.92 ± 5.56
GPT (IU/L) 12.53 ± 1.18 24.62 ± 5.74 17.26 ± 3.74 16.26 ± 2.36
Glucose (mmol/L) 5.29 ± 3.39a 10.01 ± 1.03b 7.14 ± 0.77a 7.14 ± 0.43a
Insulin (pmol/L) 59.53 ± 12.21a 120.58 ± 13.74b 103.79 ± 27.47b 59.53 ± 12.21a
AUC of glucose (mmol·min/L) 790.63 ± 23.98a 1278.07 ± 137.95b 979.75 ± 123.75a 957.19 ± 80.65a
1)Values are expressed as mean ± standard error; n = 7/group. LF, low fat diet; HF, high fat diet; 0.5% SE, high fat diet with 0.5% of dietary intake as sorghum extract, 1% SE, high fat diet with 1% of dietary intake as sorghum extract; GOT, glutamic oxaloacetic transaminase; GPT, glutamic pyruvic transaminase; AUC, area under the curve.
2)Values in a row with different letters are significantly different at P< 0.05 using analysis of variance followed by Duncan’s multiple-range test.
Table 3. Lipid profiles, liver function, and levels of glucose and insulin in serum1)
Fig 1. Effect of sorghum extract on the oral glucose tolerance test. Values are expressed as mean ± standard error; n = 7/group. LF, low fat diet; HF, high fat diet;
0.5% SE, high fat diet with 0.5% of dietary intake as sorghum extract, 1% SE, high fat diet with 1% of dietary intake as sorghum extract. Values with different letters are significantly different at P< 0.05 by analysis of variance followed by Duncan’s multiple-range test.
Fig 2. Effect of sorghum extracts on peroxisome proliferator-activated receptor gamma (PPAR-γ), tumor necrosis factor-α (TNF-α), and adiponectin protein expression in adipose tissue. Values are expressed as means ± standard error; n = 7/group. LF, low fat diet; HF, high fat diet; 0.5% SE, high fat diet with 0.5% of dietary intake as sorghum extract; 1% SE, high fat diet with 1% of dietary intake as sorghum extract. Values with different letters are significantly different at P< 0.05 by analysis of variance followed by Duncan’s multiple-range test.
Effect on antidiabetic protein expression
PPAR-γ expression was significantly higher in mice given 1%
SE than in the HF and 0.5% SE groups but was similar to that
in the LF diet fed mice (Fig. 2). TNF-α expression was significantly lower in mice given 1% SE than in the HF and LF diet fed mice and was significantly lower in mice given 0.5%
SE than in the LF diet fed mice. Adiponectin expression was significantly higher in mice given 0.5% and 1% SE than that in the HF diet fed mice.
Discussion
As hypothesized, the SE appeared to have induced antidiabetic effects in mice fed a HF diet through a mechanism that increased adiponectin and decreased TNF-α via overexpression of PPAR-γ, leading to improved insulin sensitivity. Administration of both 0.5% and 1% SE significantly reduced serum glucose levels, but only the 1% SE treatment significantly lowered serum insulin level, suggesting that the 1% concentration increased antidiabetic effects, although our findings were not dose-dependent.
These findings are consistent with a recent study that showed that SE at doses of 250 and 500 mg/kg of body weight signi- ficantly decrease serum glucose levels in streptozotocin-induced diabetic rats [17]. Kim et al. [20] showed that SE is rich in polyphenols, which strongly inhibit in vitro α-glucosidase and α-amylase activities, and are targets for the development of
diabetic drugs. Studies have also reported that polyphenols from cocoa extract [21] and Salacia reticulate extract [22] reduce serum glucose levels in type 1 diabetic rats. However, Lakshmi et al. [23] observed that consumption of whole sorghum significantly lowers fasting level and the glucose AUC in type 2 diabetic subjects, suggesting that these results could be due to fiber. Dietary fiber lowers blood glucose level by delaying gastric emptying, intestinal transit time, and carbohydrate absorption [24]; however, we previously reported that consuming sorghum grain has no effect on serum glucose or insulin levels compared with those in hyperlipidemic rats fed white rice [25].
These inconsistent results may be due to the type of sorghum consumed, sorghum grain vs. extract, or the animal model used.
PPAR-γ is involved in glucose uptake and lipid storage in adipocytes [26,27]. Activation of PPAR-γ to improve the sensitivity of insulin receptors is the predominant mechanism for the antidiabetic efficacy of PPAR-γ agonists [28]. Thiazolidine- dione, a synthetic PPAR-γ ligand, significantly increases insulin sensitivity in patients with diabetes, interferes with TNF-α activity, and increases adiponectin levels [29]. Adipocytokines, primarily adiponectin and TNF-α released from adipocytes, appear to be associated with glucose metabolism [30]. Therefore, the hypoglycemic effect of sorghum in this study could be explained by increased PPAR-γ expression in adipose tissue, which consequently increased adiponectin expression and decreased TNF-α expression.
A significant decrease in total cholesterol, LDL-cholesterol, and triglyceride levels was observed in the SE-treated groups.
Carr et al. [14] also reported that a sorghum lipid extract from whole kernels exerts a cholesterol-lowering effect by reducing cholesterol absorption with a concomitant increase in fecal sterol excretion. Polyphenols from green tea reduce plasma LDL- cholesterol concentrations by inhibiting cholesterol synthesis [31-33]. Because the cholesterol-lowering effects can be explained by decreased cholesterol synthesis and/or increased cholesterol excretion, the effect of SE on plasma cholesterol concentration in this study may have been due to either increased cholesterol excretion in the feces or decreased cholesterol synthesis in the liver. Chung et al. [18] also reported that a SE reduces plasma triglyceride concentrations in rats with diet-induced obesity, but the hyperlipidemic mechanism is unknown.
A few limitations of this study should be mentioned. No active control group was used (e.g., mice taking antidiabetic medica- tion), dose dependency was not clearly detected due to the doses selected, and the hypocholesterolemic metabolism was not determined. We are currently conducting an animal study to examine the cholesterol-lowering action mechanism of sorghum.
In conclusion, our results demonstrate that a SE appeared to have an antidiabetic effect and may have exerted its therapeutic effects through PPAR-γ overexpression in mice fed a HF diet. This is the first study to characterize the antidiabetic mechanisms of sorghum. However, future studies should examine the hypogly- cemic effect of sorghum on protein expression during hepatic glucose production and glucose uptake by skeletal muscle.
References
1. Craig ME, Hattersley A, Donaghue KC. Definition, epidemiology and classification of diabetes in children and adolescents. Pediatr Diabetes 2009;10 Suppl 12:3-12.
2. Agius L. New hepatic targets for glycaemic control in diabetes.
Best Pract Res Clin Endocrinol Metab 2007;21:587-605.
3. Hotamisligil GS. The role of TNFalpha and TNF receptors in obesity and insulin resistance. J Intern Med 1999;245:621-5.
4. Yamauchi T, Kamon J, Waki H, Terauchi Y, Kubota N, Hara K, Mori Y, Ide T, Murakami K, Tsuboyama-Kasaoka N, Ezaki O, Akanuma Y, Gavrilova O, Vinson C, Reitman ML, Kagechika H, Shudo K, Yoda M, Nakano Y, Tobe K, Nagai R, Kimura S, Tomita M, Froguel P, Kadowaki T. The fat-derived hormone adiponectin reverses insulin resistance associated with both lipoatrophy and obesity. Nat Med 2001;7:941-6.
5. Maeda N, Takahashi M, Funahashi T, Kihara S, Nishizawa H, Kishida K, Nagaretani H, Matsuda M, Komuro R, Ouchi N, Kuriyama H, Hotta K, Nakamura T, Shimomura I, Matsuzawa Y. PPARgamma ligands increase expression and plasma concen- trations of adiponectin, an adipose-derived protein. Diabetes 2001;50:2094-9.
6. Lehmann JM, Moore LB, Smith-Oliver TA, Wilkison WO, Willson TM, Kliewer SA. An antidiabetic thiazolidinedione is a high affinity ligand for peroxisome proliferator-activated receptor gamma (PPAR gamma). J Biol Chem 1995;270:12953-6.
7. Bouskila M, Pajvani UB, Scherer PE. Adiponectin: a relevant player in PPARgamma-agonist-mediated improvements in hepatic insulin sensitivity? Int J Obes (Lond) 2005;29 Suppl 1:S17-23.
8. Spranger J, Kroke A, Möhlig M, Bergmann MM, Ristow M, Boeing H, Pfeiffer AF. Adiponectin and protection against type 2 diabetes mellitus. Lancet 2003;361:226-8.
9. Hotamisligil GS, Arner P, Caro JF, Atkinson RL, Spiegelman BM. Increased adipose tissue expression of tumor necrosis factor- alpha in human obesity and insulin resistance. J Clin Invest 1995;95:2409-15.
10. Food and Agriculture Organization of the United Nations [Internet]. FAOSTAT Database. Rome, Italy: FAO; [cited 2003 March 25]. Available from: http://faostat.fao.org/.
11. Kamath VG, Chandrashekar A, Rajini PS. Antiradical properties of sorghum (Sorghum bicolor L. Moench) flour extracts. J Cereal Sci 2004;40:283-8.
12. Sikwese FE, Duodu KG. Antioxidant effect of a crude phenolic extract from sorghum bran in sunflower oil in the presence of ferric ions. Food Chem 2007;104:324-31.
13. Park MY, Jang HH, Kim JB, Yoon HN, Lee JY, Lee YM, Kim JH, Park DS. Hog millet (Panicum miliaceum L.)-supplemented diet ameliorates hyperlipidemia and hepatic lipid accumulation in C57BL/6J-ob/ob mice. Nutr Res Pract 2011;5:511-9.
14. Carr TP, Weller CL, Schlegel VL, Cuppett SL, Guderian DM Jr, Johnson KR. Grain sorghum lipid extract reduces cholesterol absorption and plasma non-HDL cholesterol concentration in hamsters. J Nutr 2005;135:2236-40.
15. Hoi JT, Weller CL, Schlegel VL, Cuppett SL, Lee JY, Carr TP.
Sorghum distillers dried grain lipid extract increases cholesterol excretion and decreases plasma and liver cholesterol concentra- tion in hamsters. J Funct Foods 2009;1:381-6.
16. van Rensburg SJ. Epidemiologic and dietary evidence for a specific nutritional predisposition to esophageal cancer. J Natl Cancer Inst 1981;67:243-51.
17. Chung IM, Kim EH, Yeo MA, Kim SJ, Seo MC, Moon HI.
Antidiabetic effects of three Korean sorghum phenolic extracts in normal and streptozotocin-induced diabetic rats. Food Res Int 2011;44:127-32.
18. Chung IM, Yeo MA, Kim SJ, Kim MJ, Park DS, Moon HI.
Antilipidemic activity of organic solvent extract from Sorghum bicolor on rats with diet-induced obesity. Hum Exp Toxicol 2011;30:1865-8.
19. Friedewald WT, Levy RI, Fredrickson DS. Estimation of the concentration of low-density lipoprotein cholesterol in plasma, without use of the preparative ultracentrifuge. Clin Chem 1972;
18:499-502.
20. Kim JS, Hyun TK, Kim MJ. The inhibitory effects of ethanol extracts from sorghum, foxtail millet and proso millet on α -glucosidase and α-amylase activities. Food Chem 2011;124:
1647-51.
21. Ruzaidi A, Amin I, Nawalyah AG, Hamid M, Faizul HA. The effect of Malaysian cocoa extract on glucose levels and lipid profiles in diabetic rats. J Ethnopharmacol 2005;98:55-60.
22. Akase T, Shimada T, Harasawa Y, Akase T, Ikeya Y, Nagai E, Iizuka S, Nakagami G, Iizaka S, Sanada H, Aburada M.
Preventive effects of Salacia reticulata on obesity and metabolic disorders in TSOD mice. Evid Based Complement Alternat Med 2011;2011:484590.
23. Lakshmi KB, Vimala V. Hypoglycemic effect of selected sorghum recipes. Nutr Res 1996;16:1651-8.
24. Ray TK, Mansell KM, Knight LC, Malmud LS, Owen OE, Boden G. Long-term effects of dietary fiber on glucose tolerance and gastric emptying in noninsulin-dependent diabetic patients.
Am J Clin Nutr 1983;37:376-81.
25. Lee SH, Chung IM, Cha YS, Park Y. Millet consumption decreased serum concentration of triglyceride and C-reactive
protein but not oxidative status in hyperlipidemic rats. Nutr Res 2010;30:290-6.
26. Chawla A, Schwarz EJ, Dimaculangan DD, Lazar MA. Peroxi- some proliferator-activated receptor (PPAR) gamma: adipose- predominant expression and induction early in adipocyte differen- tiation. Endocrinology 1994;135:798-800.
27. Tontonoz P, Hu E, Spiegelman BM. Stimulation of adipogenesis in fibroblasts by PPAR gamma 2, a lipid-activated transcription factor. Cell 1994;79:1147-56.
28. Willson TM, Brown PJ, Sternbach DD, Henke BR. The PPARs:
from orphan receptors to drug discovery. J Med Chem 2000;
43:527-50.
29. Arner P. The adipocyte in insulin resistance: key molecules and the impact of the thiazolidinediones. Trends Endocrinol Metab 2003;14:137-45.
30. Thamer C, Machann J, Tschritter O, Haap M, Wietek B, Dahl D, Bachmann O, Fritsche A, Jacob S, Stumvoll M, Schick F, Häring HU. Relationship between serum adiponectin concentration and intramyocellular lipid stores in humans. Horm Metab Res 2002;34:646-9.
31. Bursill CA, Abbey M, Roach PD. A green tea extract lowers plasma cholesterol by inhibiting cholesterol synthesis and upregu- lating the LDL receptor in the cholesterol-fed rabbit. Atheros- clerosis 2007;193:86-93.
32. Singh DK, Banerjee S, Porter TD. Green and black tea extracts inhibit HMG-CoA reductase and activate AMP kinase to decrease cholesterol synthesis in hepatoma cells. J Nutr Biochem 2009;20:
816-22.
33. Maron DJ, Lu GP, Cai NS, Wu ZG, Li YH, Chen H, Zhu JQ, Jin XJ, Wouters BC, Zhao J. Cholesterol-lowering effect of a theaflavin-enriched green tea extract: a randomized controlled trial. Arch Intern Med 2003;163:1448-53.