The Development of Phasic and Tonic Inhibition in the Rat Visual Cortex
7
0
0
전체 글
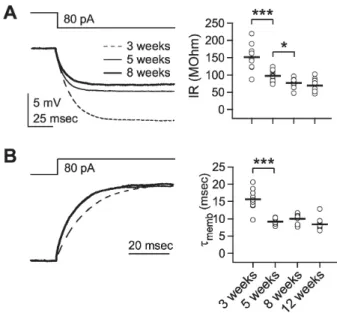
(2) 400. HJ Jang, et al. cortex. Tonic as well as phasic inhibition progressively increased during postnatal development. Since inhibition is critical in many functional aspects of the visual cortex, information on the development of inhibition will be helpful in understanding the functional development of the visual cortical circuitry and its modification through experience.. METHODS Slice preparation Visual cortical slices were prepared from Sprague-Dawley rats of either sex (postnatal 3 to 12 weeks, Orientbio Inc., Korea), maintained under standard conditions (23±1oC, 12/12 hours light/dark cycle). Animal care and surgical procedures were approved by the Ethics Committee of the Catholic University of Korea, consistent with the National Institutes of Health guidelines for the care and use of laboratory animals. Animals were anesthetized with chloral hydrate (400 mg/kg, i.p.) and the brains were quickly removed and placed in ice-cold dissection medium. Coronal sections of the occipital cortex (300 μm in thickness) were prepared on a vibrotome (Campden Instruments, Leics, UK) and were allowed to recover in a submerging chamber for 40 o min at 37 C. The slices were maintained at room temperature prior to recording. The dissection and storage medium consisted of 125 mM NaCl, 2.5 mM KCl, 1 mM CaCl2, 2 mM MgSO4, 1.25 mM NaH2PO4, 25 mM NaHCO3, and 10 mM D-glucose, bubbled with carbogen (95% O2/5% CO2). The slices were transferred to a recording chamber containing artificial cerebrospinal fluid (ACSF, 1.5∼2 ml/min) (125 mM NaCl, 2.5 mM KCl, 2 mM CaCl2, 1 mM MgSO4, 1.25 mM NaH2PO4, 25 mM NaHCO3, and 10 mM D-glucose), o bubbled with carbogen and maintained at 32∼33 C. Electrophysiological recording Recording electrodes (3∼4 MΩ) were pulled from borosilicate glass pipettes (1B150F-4, World Precision Instruments, Inc., Sarasota, FL, USA) using a micropipette puller (MODEL P-97, Sutter instrument Co., Novato, CA, USA). Whole-cell responses were recorded using a whole-cell patch-clamp recording technique with an EPC9 amplifier (HEKA Elektronik, Lambrecht, Germany) and Pulse 8.31 software (HEKA Elektronik) or with an EPC8 amplifier and pClamp 9.0 software (Axon Instruments, Foster City, CA, USA). In an experimental set to evaluate the development of the inhibitory-to-excitatory ratio, the intracellular solution was composed of (in mM): 130 K-gluconate, 10 KCl, 4 Mg-ATP, 10 Na2-phosphocreatine, 0.3 Na3-GTP and 10 HEPES (pH 7.25 with KOH). Pyramidal neurons in layer 2/3 of the primary visual cortex were visually identified using IR-DIC video-microscopy with an upright microscope (BX51-WI fitted with a 40×/0.80NA water immersion objective, Olympus, Tokyo, Japan), and their regular spiking patterns were confirmed. Typical access resistance was 15 ∼20 MΩ. Membrane potentials were not corrected for about 14 mV junction potential. Input resistance was measured by the injection of a negative current pulse (−80 pA), which evoked 3∼17 mV hyperpolarization, depending on the age of the animals. Membrane time constant was measured from the decay of the membrane response evoked by a small hyperpolarizing current pulse, fitted with a single exponential function: V(t)=Aexp(−t/τ)+C. Decay of synaptic. responses was also analyzed using the same function. Membrane potential and current were both measured by switching between current- and voltage-clamp modes. Synaptic responses were evoked by the application of extracellular stimulation in layer 4 beneath the recorded cell. Excitatory events were measured at a holding potential of −75 mV in normal ACSF, and inhibitory events were subsequently recorded at a holding potential of 0 mV in the presence of the NMDAR antagonist D-aminopentanoate (D-AP5, 50 μM) and the alpha-amino-3-hydroxy-5-methyl-4-isoxazolepropionic acid receptor (AMPAR) antagonist 6,7-dinitroquinoxaline-2,3-dione (DNQX, 20 μM). To evaluate tonic inhibition, a CsCl-based internal solution, containing (in mM) 145 CsCl, 4 Mg-ATP, 10 Na2-phosphocreatine, 0.3 Na3-GTP, 10 HEPES and 3 QX-314 (pH 7.25 by CsOH), was used. In this experiment, DNQX (20 μM), D-AP5 (50 μM), and the GABAB receptor antagonist CGP52432 (1 μM) were applied to suppress neurotransmitter receptors other than GABAA receptors. The amplitude of tonic inhibition was analyzed as the difference between the holding currents measured before and after the application of the GABAA receptor antagonist bicuculline (10 μM) while the membrane potential was clamped at −75 mV. The holding current was calculated from 100 msec epochs containing no obvious spontaneous synaptic events, taken every four seconds during an 80-second period [24]. Chemicals D-AP5, DNQX, bicuculline, and CGP52432 were purchased from Tocris (Bristol, UK). The other chemicals were purchased from Sigma (St. Louis, MO, USA). Statistical analysis Data were expressed as the mean±SE. Statistical comparisons were performed using paired or unpaired twotailed Student’s t-test unless otherwise specified. One-way ANOVA, followed by a Tukey’s post-hoc test, was also used for multi-group comparison (Systat v11, SYSTAT Software, Inc., Richmond, CA, USA). The level of significance was set at p<0.05.. RESULTS Developmental changes in passive membrane properties Since passive membrane properties affect the amplitude and time course of synaptic events [25], developmental changes in input resistance and membrane time constant were initially investigated in the pyramidal cells in layer 2/3 of the visual cortex of 3- (‘3 weeks,’ n=9), 5- (‘5 weeks,’ n=9), 8- (‘8 weeks,’ n=9), and 12-week-old rats (‘12 weeks,’ n=9). Input resistance was determined by measuring the deflection of membrane potential by hyperpolarizing current pulse (−80 pA), and membrane time constant was measured by fitting the decay of membrane potential from the deflection (Fig. 1). Input resistance decreased from 3 to 8 weeks of age (136.6±18.9 MΩ, 88.8±9.6 MΩ, 69.8±8.1 MΩ, and 64.0±7.6 MΩ for ‘3 weeks’, ‘5 weeks’, ‘8 weeks,’ and ‘12 weeks,’ respectively, p<0.001 between ‘3 weeks’ and ‘5 weeks,’ p<0.05 between ‘5 weeks’ and ‘8 weeks’). Membrane time constant also decreased from 3 to 5 weeks of age and reached a plateau thereafter (15.6±1.1 msec,.
(3) Inhibitory Development in the Visual Cortex. Fig. 1. Developmental changes in the passive membrane properties. Passive membrane properties were measured by injection of a small negative current (−80 pA). (A) Developmental changes in input resistance. Left panel: upper trace shows the command current and lower traces show the averaged responses of membrane potential in layer 2/3 pyramidal cells at 3- (‘3 weeks,’ dashed line), 5- (‘5 weeks,’ thin solid line), and 8-week-old rats (‘8 weeks,’ thick solid line). The right panel plots individual data (symbols) and averages (thick solid lines). IR: input resistance. (B) Developmental changes in membrane time constant. Left panel: upper trace shows the command current and lower traces show normalized responses of membrane potential in layer 2/3 pyramidal cells. The right panel plots individual data (symbols) and averages (thick solid lines). τmemb: membrane time constant. *p<0.05, and ***p<0.001 between groups linked by lines.. 9.2±0.3 msec, 9.9±0.5 msec, and 8.4±0.6 msec for ‘3 weeks’, ‘5 weeks’, ‘8 weeks,’ and ‘12 weeks,’ respectively, p<0.001 between ‘3 weeks’ and ‘5 weeks’). Thus, passive membrane properties in the visual cortex changed during postnatal development in such a way that synaptic activities would deflect membrane potential more quickly.. 401. Fig. 2. Development of phasic inhibition. Inhibitory postsynaptic potential (IPSP) and inhibitory postsynaptic current (IPSC) were recorded at 0 mV of membrane potential in the presence of DNQX (20 μM) and D-AP5 (50 μM) at stimulation intensities that evoked 20 mV depolarization at −75 mV membrane potential. (A) Averaged IPSPs (left traces) and IPSCs (right traces) showing differences between groups. IPSPs and IPSCs were recorded from slices of 3(‘3 weeks,’ thin dashed lines), 5- (‘5 weeks,’ thin solid lines), 8- (‘8 weeks,’ thick solid lines), and 12-week-old rats (‘12 weeks,’ thick dashed lines). (B) Individual data (symbols) and averages (thick lines) for excitatory postsynaptic potential (EPSP), excitatory postsynaptic current (EPSC), IPSP, and IPSC for each of the groups indicated in the lower panels. *p<0.05 between groups linked by lines.. Development of phasic inhibition In a previous study, we reported the development of synaptically evoked phasic inhibition during the critical period from 3 to 5 weeks of age in the rat visual cortex [11]. To further evaluate the development of inhibition, in the present study we extended the time period to 12 weeks of age. To evaluate the development of inhibition relative to excitation, inhibitory postsynaptic potential (IPSP) and inhibitory postsynaptic current (IPSC) were measured at the stimulus intensity that evoked a depolarizing excitatory postsynaptic potential (EPSP) of 20 mV at −75 mV membrane potential (Fig. 2B, upper left panel). Excitatory postsynaptic current (EPSC) evoked in all age groups at the same stimulus intensity with 20 mV EPSP did not differ among the groups (525.0±44.4 pA, 520.1±43.8 pA, 570.4± 36.2 pA, and 548.5±52.7 pA for ‘3 weeks’, ‘5 weeks’, ‘8 weeks,’ and ‘12 weeks’, respectively, p=0.84 by ANOVA) (Fig. 2B, upper right panel). Although there could be some inhibitory components in EPSPs and EPSCs, they were con-. sidered to be excitatory since inhibitory components would be minimal at −75 mV membrane potential, which was close to the chloride equilibrium potential in this experiment (ECl=−68 mV). The amplitude of stimulus current pulse applied to evoke 20 mV depolarization was also similar among the groups (131.4±9.3 μA, 146.2±8.7 μA, 142.3± 5.9 μA, and 149.7±10.4 μA for ‘3 weeks’, ‘5 weeks’, ‘8 weeks,’ and ‘12 weeks’, respectively, p=0.246 by ANOVA). Thus, excitatory strength did not differ among the age groups, despite the decrease in input resistance with age (Fig. 1). Other active properties, such as voltage-dependent ion channels, might also be involved in the developmental changes [26]. By contrast, both IPSPs and IPSCs increased from 3 to 8 weeks of age (IPSPs 13.3±1.5 mV, 18.4±1.7 mV, 23.1±1.5 mV, and 22.2±1.6 mV at ‘3 weeks’, ‘5 weeks’, ‘8 weeks,’ and ‘12 weeks,’ respectively, p<0.05 between ‘3 weeks’ and ‘5 weeks,’ p<0.05 between ‘5 weeks’ and ‘8 weeks;’ IPSCs 250.7±22.0 pA, 325.3±26.3 pA, 475.9±43.9.
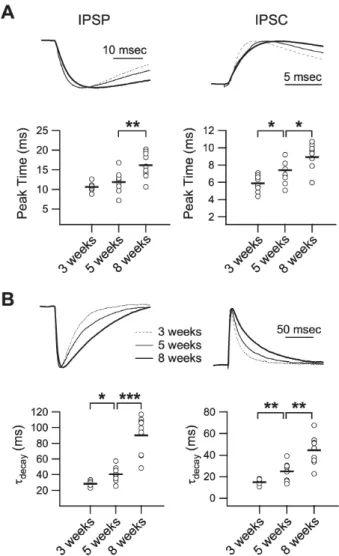
(4) 402. HJ Jang, et al. pA, and 527.7±56.4 pA at ‘3 weeks’, ‘5 weeks’, ‘8 weeks,’ and ‘12 weeks,’ respectively, p<0.05 between ‘3 weeks’ and ‘5 weeks,’ p<0.05 between ‘5 weeks’ and ‘8 weeks’). These results suggest that phasic inhibition increases developmentally and reaches the adult level at 8 weeks of age.. Expression of GABAA receptor subunits has been shown to change during development in the rat visual cortex [12]. Since the time course of GABAA receptor-mediated responses is dependent on the composition of subunits [27],. the kinetics of phasic inhibition would also change during postnatal development. To address this issue, changes in the peak time and the decay time constant of IPSP and IPSC were investigated in 3- to 12-week-old rats (Fig. 3). The peak time was measured as the time difference between electrical stimulation and the peak of the response, and the decay time constant was obtained by single exponential fitting. Peak time increased during development (IPSPs 10.7±0.4 msec, 11.9±1.0 msec, 16.2±1.1 msec, and 15.3±2.1 at ‘3 weeks’, ‘5 weeks’, ‘8 weeks,’ and ‘12 weeks,’ respectively, p<0.01 between ‘5 weeks’ and ‘8 weeks;’ IPSCs 5.9±0.3 msec, 7.2±0.5 msec, 9.1±0.5 msec, and 8.3±. Fig. 3. Developmental changes in the kinetics of phasic inhibition. (A) Peak time of IPSP (left panel) and IPSC (right panel). Upper traces show normalized IPSPs and IPSCs of 3- (‘3 weeks,’ dashed line), 5- (‘5 weeks,’ thin solid line), and 8-week-old rats (‘8 weeks,’ thick solid line) with an extended time scale. Lower panels plot individual data (symbols) and averages (thick lines) for the peak time of IPSPs and IPSCs. (B) Decay time constant of IPSP (left panel) and IPSC (right panel). Upper traces show normalized IPSPs and IPSCs of 3- (dashed line), 5- (thin solid line), and 8-week-old rats (thick solid line). Lower panels plot individual data (symbols) and averages (thick lines) for the decay time constant of IPSPs and IPSCs. τdecay: decay time constant. *p<0.05, **p<0.01, and ***p <0.001 between groups linked by lines.. Fig. 4. Developmental changes in the kinetics of excitation. (A) Peak time of EPSP (left panel) and EPSC (right panel). Upper traces show normalized EPSPs and EPSCs of 3- (‘3 weeks,’ dashed line), 5- (‘5 weeks,’ thin solid line), and 8-week-old rats (‘8 weeks,’ thick solid line) with extended time scale. Lower panels plot individual data (symbols) and averages (thick lines) for the peak time of EPSPs and EPSCs. (B) Decay time constant of EPSP (left panel) and EPSC (right panel). Upper traces show normalized EPSPs and EPSCs of 3- (dashed line), 5- (thin solid line), and 8-week-old rats (thick solid line). Lower panels plot individual data (symbols) and averages (thick lines) for the decay time constant of EPSPs and EPSCs. τdecay: decay time constant. **p<0.01, and ***p<0.001 between groups linked by lines.. Developmental changes in the kinetics of synaptic events.
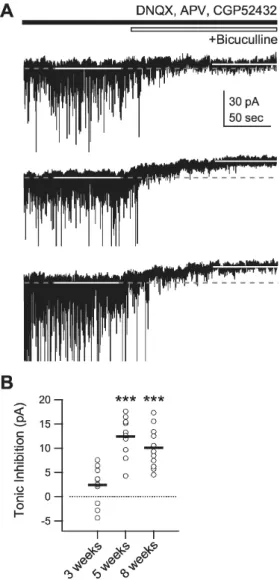
(5) 403. Inhibitory Development in the Visual Cortex. 0.9 at ‘3 weeks’, ‘5 weeks’, ‘8 weeks,’ and ‘12 weeks,’ respectively, p<0.05 between ‘3 weeks’ and ‘5 weeks,’ p<0.05 between ‘5 weeks’ and ‘8 weeks’) (Fig. 3A). The decay time constant in both IPSPs and IPSCs also increased from 3 to 8 weeks of age (IPSPs 28.5±1.2 msec, 40.6±3.5 msec, 90.2±8.1 msec, and 85.4±10.3 msec at ‘3 weeks’, ‘5 weeks’, ‘8 weeks,’ and ‘12 weeks,’ respectively, p<0.05 between ‘3 weeks’ and ‘5 weeks,’ p<0.001 between ‘5 weeks’ and ‘8 weeks;’ IPSCs 14.8±0.8 msec, 24.8±3.2 msec, 44.4±4.5 msec, and 42.7±5.9 msec at ‘3 weeks’, ‘5 weeks’, ‘8 weeks,’ and ‘12 weeks,’ respectively, p<0.01 between ‘3 weeks’ and ‘5. weeks,’ p<0.01 between ‘5 weeks’ and ‘8 weeks’) (Fig. 3B). Thus, activation and inactivation of phasic inhibition in pyramidal cells of layer 2/3, evoked by electrical stimulation of layer 4, slowed during postnatal development. Changes in inhibitory kinetics may also affect the kinetics of excitatory synaptic responses, so changes in the kinetics of EPSP and EPSC were also investigated (Fig. 4). In contrast to the inhibitory events, the decay time constant of EPSP decreased with development (53.5±4.2 msec, 33.3± 0.9 msec, 27.5±1.2 msec, and 25.2±0.8 msec at ‘3 weeks’, ‘5 weeks’, ‘8 weeks,’ and ‘12 weeks,’ respectively, p<0.001 between ‘3 weeks’ and ‘5 weeks,’ p<0.01 between ‘5 weeks’ and ‘8 weeks’) (Fig. 4B, left panels). Other kinetic properties of excitatory components showed no developmental changes (decay time constant of EPSCs 6.8±0.5 msec, 6.7± 0.7 msec, 6.7±0.4 msec, and 6.6±0.6 msec at ‘3 weeks’, ‘5 weeks’, ‘8 weeks,’ and ‘12 weeks,’ respectively, p=0.997 by ANOVA; peak time of EPSPs 8.1±0.6 msec, 8.8±0.7 msec, 7.2±0.2 msec, and 7.5±0.2 msec at ‘3 weeks’, ‘5 weeks’, ‘8 weeks,’ and ‘12 weeks,’ respectively, p=0.139 by ANOVA; and peak time of EPSCs 4.9±0.3 msec, 4.8±0.3 msec, 4.5±0.2 msec, and 5.1±0.2 msec at ‘3 weeks’, ‘5 weeks’, ‘8 weeks,’ and ‘12 weeks,’ respectively, p=0.187 by ANOVA). Because the kinetics of EPSCs did not change during postnatal development, the faster decay in EPSPs at 5 and 8 weeks of age, compared with that at 3 weeks of age, appears to be resulted from the increased amplitude and slowed decay of IPSC during this period (Fig. 3). Thus, excitatory synaptic transmission might mature before 3 weeks of age and be maintained stably during and after the critical period in the rat visual cortex. Development of tonic inhibition Although tonic inhibition is another important mode of GABAA receptor-mediated inhibition, to the best of our knowledge it has never been reported in the visual cortex. We therefore investigated the developmental changes in tonic inhibition. Tonic inhibition was detected as the difference between the holding current before and after application of the GABAA receptor antagonist, bicuculline (10 μM) (Fig. 5). In 3-week-old rats, the holding current did not differ significantly either before or after the application of bicuculline (2.4±1.2 pA before and after bicuculline, n=11, p=0.07) (Fig. 5A, top trace). By contrast, a significant degree of tonic inhibition could be detected in 5-week-old rats (12.4±1.2 pA, n=11, p<0.001 vs. ‘3 weeks’) (Fig. 5A, middle trace). In 8-week-old rats, tonic inhibition did not differ from that of 5-week-old rats (10.1±1.3 pA, n=11, p=0.19 vs. ‘5 weeks’) (Fig. 5A, bottom trace). These results suggest that, in the rat visual cortex, tonic inhibition is also regulated developmentally before phasic inhibition is.. Fig. 5. Developmental changes in tonic inhibition. Tonic inhibition was measured as the difference between the holding current before and after the application of the GABAA receptor antagonist bicuculline (10 μM) while membrane potential was clamped at −75 mV. (A) Current traces at the holding potential of −75 mV before and after the application of bicuculline for 3- (top trace), 5- (middle trace), and 8-week-old rats (bottom trace). White solid lines indicate periods at which holding currents were measured. Grey dashed lines indicate holding currents measured before the application of bicuculline. (B) Individual data (symbols) and averages (thick lines) of the changes in holding currents for 3- (‘3 weeks’), 5- (‘5 weeks’), and 8-week-old rats (‘8 weeks’). ***p<0.001 vs. ‘3 weeks’.. DISCUSSION The present study investigated the developmental changes in various aspects of GABAA receptor-mediated inhibition. Since the relative strength of inhibition compared with excitation is more important than the development itself [28], we investigated the development of phasic inhibition relative to the same amount of excitation in different age groups. We found a developmental increase in the inhibitory-to-excitatory ratio (I/E ratio), which confirmed our previous findings [11]. Inhibition increased during post-.
(6) 404. HJ Jang, et al. natal development from 3 to 8 weeks and reached a plateau at 8 weeks of age. Thus, the development of inhibition in the rat visual cortex appears to be completed at around 8 weeks of age. In contrast, in a report from Morales et al. [9], the I/E ratio did not increase from 5 to 8 weeks. Since the I/E ratio was calculated at the maximum amplitude of inhibition achieved by electrical stimulation, the discrepancy might originate from differences in the experimental methods. Ocular dominance plasticity in the visual cortex was induced until 5 weeks of age when it was measured by unit recording [29], but it could be induced until about 7 weeks of age when measured by sweep visually evoked potential [30]. Functional maturation of the visual cortex can be assessed by visual acuity and receptive field properties [29], and inhibition has proven to be important in these processes [31]. Since these features develop until postnatal day 45 [29], the present results regarding the development of inhibition reflects well the time course of the functional maturation of the rat visual cortex. GABAA receptors are pentamers of nineteen subunits, and manifest different kinetics depending on the composition of subunits [18,32]. Since the expression of subunits changes during development, the kinetics of GABAA receptor-mediated synaptic events also changes with development [12,33]. Spontaneous IPSC (sIPSC) was reported to show faster kinetics during postnatal development in the rat visual cortex [12]. In contrast, in the present study, phasic inhibition showed slower kinetics with development. Various types of inhibitory interneurons make inhibitory synapses with different kinetics [34-36]. Furthermore, slow sIPSC was also reported in the rat visual cortex, although it was very rare compared to fast sIPSC [37]. Because spontaneous activities differ among various types of inhibitory interneurons [38], if these slow IPSC-evoking interneurons generate spontaneous firing more rarely than fast IPSC-evoking interneurons, sIPSC recording might have failed to detect the developmental changes in the kinetics of evoked IPSC in the present study. Thus, the discrepancy with respect to the kinetics might result from the properties of inhibitory interneurons that mediate slow GABAergic responses. Anatomical maturation of inhibitory circuits, such as the number of interneurons, boutons and synaptic contacts, is known to be completed at around 5 weeks of age in rodents [39-43]. Increases in the I/E ratio and tonic inhibition between 3 and 5 weeks might, therefore, largely depend on the developmental increase in inhibitory synaptic transmission itself. By contrast, the increased I/E ratio during 5 to 8 weeks, along with the changes in kinetics, might be explained by changes in the composition of GABAA receptor subunits. Although the detailed differences among various subtypes of inhibitory interneurons having different kinetics, and the changes in the composition of receptor subunits, remain to be elucidated, our results suggest that the developmental decrease in the induction of NMDAR-dependent synaptic plasticity might result from the increased suppression of NMDAR by the developmental increase in both I/E ratio and slowed GABA responses, since slower inhibition more efficiently suppresses NMDAR [13]. The changes in the kinetics of inhibition could also result from the changes in the passive membrane properties. Since the membrane time constant became shorter with development, however, the changes in inhibitory kinetics cannot be a mere reflection of the passive properties. Moreover, the developmental change in the kinetics of excitation was opposite to that of inhibition. In contrast to the inhibitory. kinetics, only the decay time constant of EPSP changed. A portion of this change might reflect the changes in the subunit composition of NMDAR [44-46]. Tonic inhibition is also an important GABAA receptor-mediated inhibition that modulates neuronal gain [47] and offset [48], and thus controls neuronal output patterns and synaptic integration [49]. These modulations would be important in visual feature processing, but the properties of tonic inhibition in the visual cortex have not yet been reported. In the present study, tonic inhibition was not detected in 3-week-old rats, but increased significantly in 5-week-old rats. Although the functional implication of the developmental increase in tonic inhibition is still unclear, it might be involved in the functional development of the visual cortex and in the developmental decline of synaptic plasticity. Future study of the roles of tonic inhibition in the visual cortex would enrich our understanding of the function and postnatal development of the visual cortical circuits. In the present study, we discovered many developmental changes in GABAA receptor-mediated inhibition in the rat visual cortex. The influence of inhibition increases with development, both in strength and duration. The time course of these changes matches well the developmental decline of synaptic plasticity, as well as the development of signal processing capability in the visual cortex. Thus, our results concerning the developmental changes of phasic and tonic inhibition provide valuable information to assist in the understanding of the importance of inhibition in the functional development of the visual cortex.. ACKNOWLEDGEMENTS The authors wish to acknowledge the financial support of the Catholic Medical Center Research Foundation, in the program year 2008.. REFERENCES 1. Pouille F, Scanziani M. Enforcement of temporal fidelity in pyramidal cells by somatic feed-forward inhibition. Science. 2001;293:1159-1163. 2. Whittington MA, Traub RD. Interneuron diversity series: inhibitory interneurons and network oscillations in vitro. Trends Neurosci. 2003;26:676-682. 3. Cobb SR, Buhl EH, Halasy K, Paulsen O, Somogyi P. Synchronization of neuronal activity in hippocampus by individual GABAergic interneurons. Nature. 1995;378:75-78. 4. Hensch TK, Stryker MP. Columnar architecture sculpted by GABA circuits in developing cat visual cortex. Science. 2004; 303:1678-1681. 5. Gray CM. The temporal correlation hypothesis of visual feature integration: still alive and well. Neuron. 1999;24:31-47. 6. Jang HJ, Cho KH, Kim HS, Hahn SJ, Kim MS, Rhie DJ. Age-dependent decline in supragranular long-term synaptic plasticity by increased inhibition during the critical period in the rat primary visual cortex. J Neurophysiol. 2009;101:269-275. 7. Hensch TK, Fagiolini M, Mataga N, Stryker MP, Baekkeskov S, Kash SF. Local GABA circuit control of experience-dependent plasticity in developing visual cortex. Science. 1998;282:15041508. 8. Komatsu Y. Development of cortical inhibition in kitten striate cortex investigated by a slice preparation. Brain Res Dev Brain Res. 1983;8:136-139. 9. Morales B, Choi SY, Kirkwood A. Dark rearing alters the.
(7) Inhibitory Development in the Visual Cortex. 10. 11.. 12. 13.. 14. 15.. 16. 17. 18. 19. 20. 21. 22.. 23. 24. 25. 26. 27.. 28. 29.. 30.. development of GABAergic transmission in visual cortex. J Neurosci. 2002;22:8084-8090. Fagiolini M, Hensch TK. Inhibitory threshold for critical-period activation in primary visual cortex. Nature. 2000;404:183-186. Jang HJ, Cho KH, Park SW, Kim MJ, Yoon SH, Rhie DJ. Effects of serotonin on the induction of long-term depression in the rat visual cortex. Korean J Physiol Pharmacol. 2010;14: 337-343. Bosman LW, Rosahl TW, Brussaard AB. Neonatal development of the rat visual cortex: synaptic function of GABAA receptor alpha subunits. J Physiol. 2002;545:169-181. Kapur A, Lytton WW, Ketchum KL, Haberly LB. Regulation of the NMDA component of EPSPs by different components of postsynaptic GABAergic inhibition: computer simulation analysis in piriform cortex. J Neurophysiol. 1997;78:2546-2559. Perkel DJ, Petrozzino JJ, Nicoll RA, Connor JA. The role of Ca2+ entry via synaptically activated NMDA receptors in the induction of long-term potentiation. Neuron. 1993;11:817-823. Bear MF, Kleinschmidt A, Gu QA, Singer W. Disruption of experience-dependent synaptic modifications in striate cortex by infusion of an NMDA receptor antagonist. J Neurosci. 1990; 10:909-925. Mulkey RM, Malenka RC. Mechanisms underlying induction of homosynaptic long-term depression in area CA1 of the hippocampus. Neuron. 1992;9:967-975. Kirkwood A, Lee HK, Bear MF. Co-regulation of long-term potentiation and experience-dependent synaptic plasticity in visual cortex by age and experience. Nature. 1995;375:328-331. Farrant M, Nusser Z. Variations on an inhibitory theme: phasic and tonic activation of GABAA receptors. Nat Rev Neurosci. 2005;6:215-229. Semyanov A, Walker MC, Kullmann DM. GABA uptake regulates cortical excitability via cell type-specific tonic inhibition. Nat Neurosci. 2003;6:484-490. Glykys J, Mody I. The main source of ambient GABA responsible for tonic inhibition in the mouse hippocampus. J Physiol. 2007;582:1163-1178. Birnir B, Everitt AB, Lim MS, Gage PW. Spontaneously opening GABAA channels in CA1 pyramidal neurones of rat hippocampus. J Membr Biol. 2000;174:21-29. McCartney MR, Deeb TZ, Henderson TN, Hales TG. Tonically active GABAA receptors in hippocampal pyramidal neurons exhibit constitutive GABA-independent gating. Mol Pharmacol. 2007;71:539-548. Semyanov A, Walker MC, Kullmann DM, Silver RA. Tonically active GABAA receptors: modulating gain and maintaining the tone. Trends Neurosci. 2004;27:262-269. Yamada J, Furukawa T, Ueno S, Yamamoto S, Fukuda A. Molecular basis for the GABAA receptor-mediated tonic inhibition in rat somatosensory cortex. Cereb Cortex. 2007;17:1782-1787. Spruston N, Jaffe DB, Johnston D. Dendritic attenuation of synaptic potentials and currents: the role of passive membrane properties. Trends Neurosci. 1994;17:161-166. Grashow R, Brookings T, Marder E. Compensation for variable intrinsic neuronal excitability by circuit-synaptic interactions. J Neurosci. 2010;30:9145-9156. Vicini S, Ferguson C, Prybylowski K, Kralic J, Morrow AL, Homanics GE. GABAA receptor alpha1 subunit deletion prevents developmental changes of inhibitory synaptic currents in cerebellar neurons. J Neurosci. 2001;21:3009-3016. Moreau AW, Amar M, Le Roux N, Morel N, Fossier P. Serotoninergic fine-tuning of the excitation-inhibition balance in rat visual cortical networks. Cereb Cortex. 2010;20:456-467. Fagiolini M, Pizzorusso T, Berardi N, Domenici L, Maffei L. Functional postnatal development of the rat primary visual cortex and the role of visual experience: dark rearing and monocular deprivation. Vision Res. 1994;34:709-720. Guire ES, Lickey ME, Gordon B. Critical period for the. 31. 32. 33.. 34. 35.. 36. 37. 38. 39.. 40.. 41.. 42.. 43.. 44. 45. 46.. 47. 48.. 49.. 405. monocular deprivation effect in rats: assessment with sweep visually evoked potentials. J Neurophysiol. 1999;81:121-128. Alitto HJ, Dan Y. Function of inhibition in visual cortical processing. Curr Opin Neurobiol. 2010;20:340-346. Mohler H. GABAA receptor diversity and pharmacology. Cell Tissue Res. 2006;326:505-516. Tia S, Wang JF, Kotchabhakdi N, Vicini S. Developmental changes of inhibitory synaptic currents in cerebellar granule neurons: role of GABAA receptor alpha 6 subunit. J Neurosci. 1996;16:3630-3640. Xiang Z, Huguenard JR, Prince DA. Synaptic inhibition of pyramidal cells evoked by different interneuronal subtypes in layer v of rat visual cortex. J Neurophysiol. 2002;88:740-750. Karayannis T, Elfant D, Huerta-Ocampo I, Teki S, Scott RS, Rusakov DA, Jones MV, Capogna M. Slow GABA transient and receptor desensitization shape synaptic responses evoked by hippocampal neurogliaform cells. J Neurosci. 2010;30:9898-9909. Hefti BJ, Smith PH. Distribution and kinetic properties of GABAergic inputs to layer V pyramidal cells in rat auditory cortex. J Assoc Res Otolaryngol. 2003;4:106-121. Sceniak MP, Maciver MB. Slow GABAA mediated synaptic transmission in rat visual cortex. BMC Neurosci. 2008;9:8. Klostermann O, Wahle P. Patterns of spontaneous activity and morphology of interneuron types in organotypic cortex and thalamus-cortex cultures. Neuroscience. 1999;92:1243-1259. Chattopadhyaya B, Di Cristo G, Higashiyama H, Knott GW, Kuhlman SJ, Welker E, Huang ZJ. Experience and activitydependent maturation of perisomatic GABAergic innervation in primary visual cortex during a postnatal critical period. J Neurosci. 2004;24:9598-9611. Okaty BW, Miller MN, Sugino K, Hempel CM, Nelson SB. Transcriptional and electrophysiological maturation of neocortical fast-spiking GABAergic interneurons. J Neurosci. 2009;29: 7040-7052. Huang ZJ, Kirkwood A, Pizzorusso T, Porciatti V, Morales B, Bear MF, Maffei L, Tonegawa S. BDNF regulates the maturation of inhibition and the critical period of plasticity in mouse visual cortex. Cell. 1999;98:739-755. Jiang B, Huang S, de Pasquale R, Millman D, Song L, Lee HK, Tsumoto T, Kirkwood A. The maturation of GABAergic transmission in visual cortex requires endocannabinoidmediated LTD of inhibitory inputs during a critical period. Neuron. 2010;66:248-259. Jiang B, Sohya K, Sarihi A, Yanagawa Y, Tsumoto T. Laminar-specific maturation of GABAergic transmission and susceptibility to visual deprivation are related to endocannabinoid sensitivity in mouse visual cortex. J Neurosci. 2010; 30:14261-14272. Carmignoto G, Vicini S. Activity-dependent decrease in NMDA receptor responses during development of the visual cortex. Science. 1992;258:1007-1011. Nase G, Weishaupt J, Stern P, Singer W, Monyer H. Genetic and epigenetic regulation of NMDA receptor expression in the rat visual cortex. Eur J Neurosci. 1999;11:4320-4326. Flint AC, Maisch US, Weishaupt JH, Kriegstein AR, Monyer H. NR2A subunit expression shortens NMDA receptor synaptic currents in developing neocortex. J Neurosci. 1997;17:24692476. Mitchell SJ, Silver RA. Shunting inhibition modulates neuronal gain during synaptic excitation. Neuron. 2003;38:433-445. Pavlov I, Savtchenko LP, Kullmann DM, Semyanov A, Walker MC. Outwardly rectifying tonically active GABAA receptors in pyramidal cells modulate neuronal offset, not gain. J Neurosci. 2009;29:15341-15350. Hausser M, Clark BA. Tonic synaptic inhibition modulates neuronal output pattern and spatiotemporal synaptic integration. Neuron. 1997;19:665-678..
(8)
수치
관련 문서
Understanding the visual language demands the ‘Visual clue’ which helps the information audiences comprehend the structure of the visual language and grasp
Method : : : : We evaluate clinical features of 714 Korean vitiligo patients who lived in the Gwangju chonnam province(315 males and 399 females).. Results
In the past year, it is obvious that this cooperation development has also promoted in Vietnam the formation and development of a Korean studies training
To review the distinctive features and potential problems of Korean government plans this report analyzes the case of Power Development Plan and Housing Development Plan. In
Bublitz & Ettredge, “The Information in Discretionary Outlays: Advertising, Research and Development”, The Accounting Review, vol.. Cournot, Researches Into
웹 표준을 지원하는 플랫폼에서 큰 수정없이 실행 가능함 패키징을 통해 다양한 기기를 위한 앱을 작성할 수 있음 네이티브 앱과
The index is calculated with the latest 5-year auction data of 400 selected Classic, Modern, and Contemporary Chinese painting artists from major auction houses..
1 John Owen, Justification by Faith Alone, in The Works of John Owen, ed. John Bolt, trans. Scott Clark, "Do This and Live: Christ's Active Obedience as the
