INTRODUCTION
The incidence of thyroid cancer continues to increase world- wide, including Korea.1,2 Papillary thyroid cancer (PTC) usual- ly has a favorable prognosis with an excellent survival rate.1,2 However, a minority of PTC patients develop locoregional re- currence, including cervical lymph node metastases, and some of them may eventually succumb to the cancer.3 Treat- ment of PTC employs a three-tiered approach, including sur- gery, radioactive iodine ablation (RAI), and long-term exoge- nous hormone replacement.3 Following surgery and RAI, neck ultrasonography and whole-body radioactive iodine scan (WBS) are usually employed to detect residual tumors or metastasis.3 Received: March 14, 2018 Revised: May 29, 2018 Accepted: June 15, 2018
Co-corresponding authors: Tae Sik Goh, MD, PhD, Department of Orthopaedic Surgery and Biomedical Research Institute, Pusan National University Hospital, 179 Gudeok-ro, Seo-gu, Busan 49241, Korea.
Tel: 82-51-240-7389, Fax: 82-51-240-7442, E-mail: [email protected] and Kyoungjune Pak, MD, PhD, Department of Nuclear Medicine and Biomedical Research Institute, Pusan National University Hospital, 179 Gudeok-ro, Seo-gu, Busan 49241, Korea.
Tel: 82-51-240-7389, Fax: 82-51-240-7442, E-mail: [email protected]
*Sunghwan Suh and Yun Hak Kim contributed equally to this work.
•The authors have no financial conflicts of interest.
© Copyright: Yonsei University College of Medicine 2018
This is an Open Access article distributed under the terms of the Creative Com- mons Attribution Non-Commercial License (https://creativecommons.org/licenses/
by-nc/4.0) which permits unrestricted non-commercial use, distribution, and repro- duction in any medium, provided the original work is properly cited.
mRNA Expression of SLC5A5 and SLC2A Family Genes in Papillary Thyroid Cancer: An Analysis
of The Cancer Genome Atlas
Sunghwan Suh1*, Yun Hak Kim2*, Tae Sik Goh3, Dae Cheon Jeong4, Chi-Seung Lee5, Jeon Yeob Jang6, Wonjae Cha7, Myoung-Eun Han2, Seong-Jang Kim8, In Joo Kim9, and Kyoungjune Pak9
1Department of Internal Medicine, Dong-A University College of Medicine, Busan;
2Department of Anatomy, School of Medicine, Pusan National University, Yangsan;
Departments of 3Orthopaedic Surgery and 9Nuclear Medicine, and Biomedical Research Institute, Pusan National University Hospital, Busan;
4Department of Statistics, Korea University, Seoul;
5Biomedical Research Institute, Pusan National University Hospital and School of Medicine, Pusan National University, Busan;
6Department of Otorhinolaryngology-Head and Neck Surgery, Ajou University Hospital, Suwon;
7Department of Otorhinolaryngology-Head and Neck Surgery, Pusan National University Hospital, Busan;
8Department of Nuclear Medicine and Research Institute for Convergence of Biomedical Science and Technology, Pusan National University Yangsan Hospital, Yangsan, Korea.
Purpose: The present study investigated the dynamics and prognostic role of messenger RNA (mRNA) expression responsible for
18F-fluorodeoxyglucose (FDG) uptake in FDG positron emission tomography (PET) and radioactive iodine (131I) uptake in whole- body radioactive iodine scans (WBS) in papillary thyroid cancer (PTC) patients.
Materials and Methods: The primary and processed data were downloaded from the Genomic Data Commons Data Portal. Ex- pression data for sodium/iodide symporter (solute carrier family 5 member 5, SLC5A5), hexokinase (HK1–3), glucose-6-phos- phate dehydrogenase (G6PD), and glucose transporter (solute carrier family 2, SLC2A1–4) mRNA were collected.
Results: Expression of SLC5A5 mRNA were negatively correlated with SLC2A1 mRNA and positively correlated with SLC2A4 mRNA. In PTC with BRAF mutations, expressions of SLC2A1, SLC2A3, HK2, and HK3 mRNA were higher than those in PTC with- out BRAF mutations. Expression of SLC5A5, SLC2A4, HK1, and G6PD mRNA was lower in PTC without BRAF mutation. PTCs with higher expression of SLC5A5 mRNA had more favorable disease-free survival, but no association with overall survival.
Conclusion: Expression of SLC5A5 mRNA was negatively correlated with SLC2A1 mRNA. This finding provides a molecular basis for the management of PTC with negative WBS using 18F-FDG PET scans. In addition, higher expression of SLC5A5 mRNA was associated with less PTC recurrence, but not with deaths.
Key Words: Thyroid cancer, SLC5A5, fluorodeoxyglucose, positron emission tomograph
pISSN: 0513-5796 · eISSN: 1976-2437 Yonsei Med J 2018 Aug;59(6):746-753
https://doi.org/10.3349/ymj.2018.59.6.746
Nowadays, positron emission tomography (PET) using 18F-flu- orodeoxyglucose (FDG) has become a standard modality for staging, restaging, and monitoring treatment responses in a variety of tumors.4 However, routine use of PET scans as a work- up is not recommended in thyroid cancer. In PTC patients with high thyroglobulin levels and negative WBS, 18F-FDG PET should be considered in order to detect suspected tumor recurrence or metastasis.3
In the field of oncology, messenger RNA (mRNA) has emerged as a major molecular player in cancer genes, because mRNA is a core part of protein synthesis.5 In cancer, mutated DNA is transcribed into complementary mRNA, which is then trans- lated into malfunctioning cancer protein. However, few stud- ies have investigated the role of mRNA as a prognostic predic- tor.5 Recently, The Cancer Genome Atlas (TCGA) Research Network Initiative provided a detailed description of the ge- nomic landscape of 509 PTC cases, named the “Integrated Ge- nomic Characterization of PTC.”6
18F-FDG, a glucose analog, is transported to tumor cells via glucose transporter (GLUT) proteins and then phosphorylat- ed by hexokinase (HK).7123I or 131I are radiopharmaceuticals that are applied in WBS and transported transcellularly to thy- rocytes by the sodium/iodide symporter (NIS).8 Therefore, we investigated mRNA expression of these genes, which are con- nected with FDG PET and WBS, to discern potential prognos- tic roles of mRNA using PTC data from TCGA.
MATERIALS AND METHODS
Data acquisition and characteristics
The primary and processed data were downloaded from the Genomic Data Commons Data Portal (https://gdc-portal.nci.
nih.gov/) in August 2016. All TCGA data were available with- out restrictions on publications or presentations according to TCGA publication guidelines. We downloaded data regarding somatic mutations, mRNA expression [normalized by RNAseq by the Expectation-Maximization (RSEM) method], and clini- cal information, which were last updated in May 2016. This process was performed using the ‘cgdsr’ package in R statisti- cal software (The R Foundation for Statistical Computing, 2016). Of the 509 PTC cases, 118 patients in the PTC cohort were excluded. The reason for exclusion were 1) samples from met- astatic tissues, 2) patients with not available or - infinite gene expression, and 3) patients with insufficient clinical informa- tion (age, sex, stage, BRAF mutation, and RAS mutation). mRNA expression data for NIS (solute carrier family 5 member 5, SL- C5A5), hexokinase (HK1–3), glucose-6-phosphate dehydro- genase (G6PD), and glucose transporter (solute carrier family 2, SLC2A1–4) were collected.
Statistical analysis
Disease-free survival (DFS) and overall survival (OS) were an-
alyzed with a logrank test after being divided into two groups with a median mRNA expression value and generation of Ka- plan-Meier survival plots. After log2 transformation, Spearman rank correlation analysis was used to determine the associa- tion between mRNA expression patterns, and the Mann-Whit- ney U test was used to compare mRNA expression patterns in PTC patients with or without genetic mutations (BRAF and RAS). Thyroid differentiation score was calculated by averag- ing the log2 transformed fold change of 16 genes (deiodinase, iodothyronine, type I; deiodinase, iodothyronine, type II; dual oxidase 1; dual oxidase 2; forkhead box E1; GLIS family zinc finger 3; NK2 homeobox 1; paired box 8; SLC26A4; SLC5A5;
SLC5A8; thyroglobulin; thyroid hormone receptor, alpha; thy- roid hormone receptor, beta; thyroid peroxidase; and thyroid stimulating hormone receptor).9 Statistical analyses were per- Table 1. Patient Demographics and Clinical Characteristics
Characteristic n (%)
Age
≥45 212 (54.2)
<45 179 (45.8)
Sex
Male 111 (28.3)
Female 280 (71.6)
Histological type of PTC
Classical 273 (69.8)
Follicular 85 (21.8)
Tall cell 29 (7.4)
Others 4 (1.0)
Extrathyroidal extension
Yes 114 (29.2)
Minimal 102 (26.1)
Moderate 11 (2.8)
Very advanced 1 (0.2)
No 265 (67.8)
NA 12 (3.0)
Lymph node metastasis
Yes 161 (41.2)
No 222 (56.8)
NA 8 (2.0)
Distant metastasis
Yes 9 (2.3)
No 382 (97.7)
TNM (The American Joint Committee on Cancer 7th)
I/II 266 (68.0)
III/IV 125 (32.0)
BRAF mutation
Yes 234 (59.8)
No 157 (40.2)
RAS mutation
Yes 52 (13.3)
No 339 (86.7)
PTC, papillary thyroid cancer; NA, not assessed.
formed using GraphPad Prism 7 for Mac OS X (GraphPad Soft- ware Inc, San Diego, CA, USA).
RESULTS
Patient characteristics
A total of 391 PTC cases were included in this study (111 males and 280 females; age: 47.2±15.8 years). According to histologi- cal PTC types, 273 cases were included in the classical type, 85 in the follicular type, 29 in the tall cell variant, and four in others.
Extrathyroidal extension was observed in 114 patients. Medi- an follow-up duration was 30.1 months. Patient characteris- tics are summarized in Table 1.
Correlation of mRNA expression of SLC5A5 with other assessed genes
mRNA expression patterns according to thyroid differentia- tion are described in a heatmap plot of 391 PTC patients (Fig. 1).
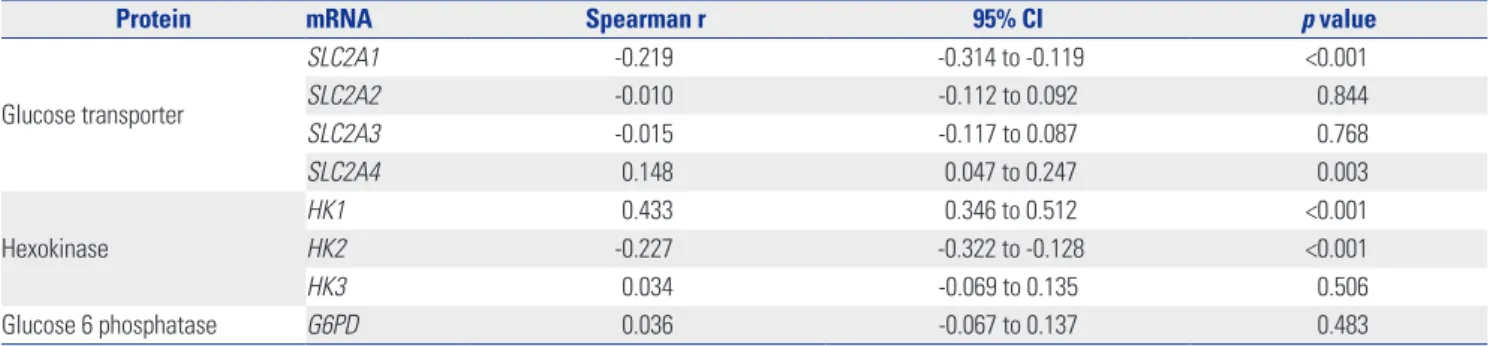
Among the SLC2 family genes, expression of SLC5A5 mRNA was negatively correlated with that of SLC2A1 (r=-0.2187, p<
0.0001) and positively with that of SLC2A4 (r=0.1483, p=
0.0033). Among HK family genes, expression of SLC5A5 mRNA was positively correlated with that of HK1 (r=0.4326, p<0.0001) and negatively with that of HK2 (r=-0.2268, p<0.0001) (Table 2, Fig. 2).
Thyroid differentiation score SLC5A5 SLC2A1 SLC2A2 SLC2A3 SLC2A4 G6PD HK1 HK2 HK3 G6PD
mRNA level
(log2 transformed values) 15
0
Fig. 1. Heatmap of mRNA expression according to thyroid differentiation score. Genes assessed were SLC5A5, SLC2A1, SLC2A2, SLC2A3, SLC2A4, HK1, HK2, HK3, and G6PD.
Table 2. Correlation between mRNA Expression of SLC5A5 and Other Genes Assessed in this Study
Protein mRNA Spearman r 95% CI p value
Glucose transporter
SLC2A1 -0.219 -0.314 to -0.119 <0.001
SLC2A2 -0.010 -0.112 to 0.092 0.844
SLC2A3 -0.015 -0.117 to 0.087 0.768
SLC2A4 0.148 0.047 to 0.247 0.003
Hexokinase
HK1 0.433 0.346 to 0.512 <0.001
HK2 -0.227 -0.322 to -0.128 <0.001
HK3 0.034 -0.069 to 0.135 0.506
Glucose 6 phosphatase G6PD 0.036 -0.067 to 0.137 0.483
CI, confidence interval.
15
10
5 mRNA level (log2 transformed values)
SLC5A5 mRNA level (log2 transformed values)
0 5 10 15
–
–
–
p<0.0001, r=0.4326 p<0.0001, r=-0.2268 p<0.0001, r=-0.2187 p<0.0033, r=0.1483 HK1
HK2 SLC2A1 SLC2A4
Fig. 2. Correlation of mRNA expression of SLC5A5 with the other genes.
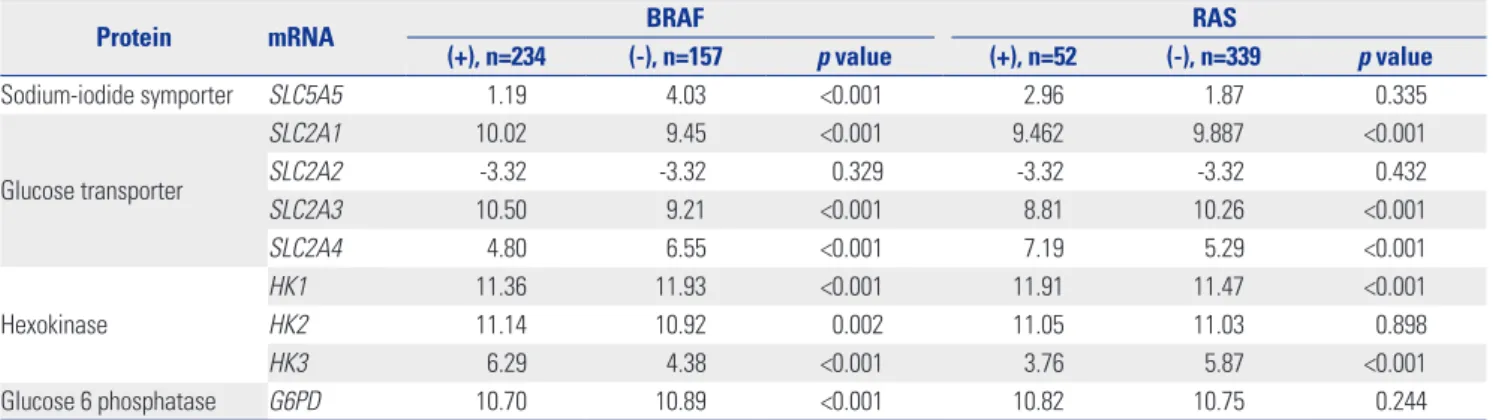
mRNA expression according to genetic mutation status Most mRNA expression patterns were significantly associated with either BRAF or RAS mutation. In PTC patients with BRAF mutation, expression of SLC2A1 (p<0.0001), SLC2A3 (p<
0.0001), HK2 (p=0.0018), and HK3 (p<0.0001) mRNA was sig- nificantly higher than in PTC patients without BRAF muta- tions. However, expression of SLC5A5 (p<0.0001), SLC2A4 (p<
0.0001), HK1 (p<0.0001), and G6PD (p<0.0001) mRNA was
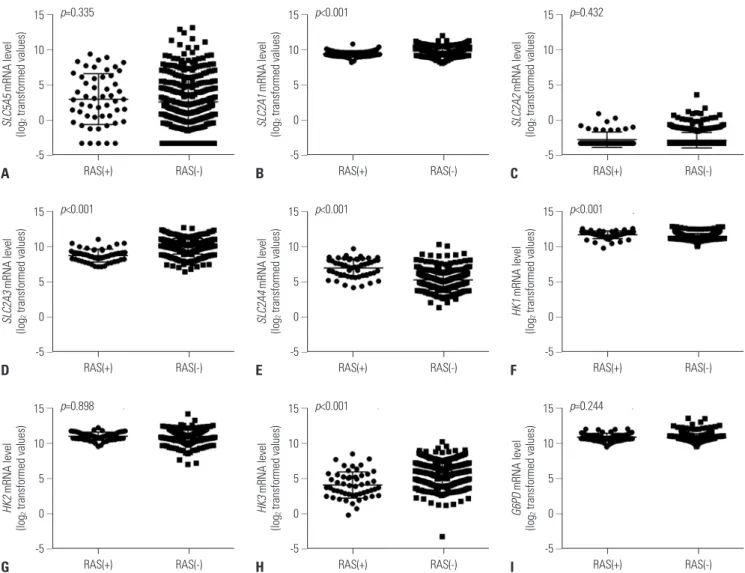
lower in PTC patients with BRAF mutations (Fig. 3). In PTC pa- tients with RAS mutations, expression of SLC2A4 (p<0.0001) and HK1 (p<0.0001) mRNA was higher, and SLC2A1 (p<0.0001), SLC2A3 (p<0.0001), and HK3 (p<0.0001) mRNA expression was lower than in PTC patients without RAS mutations (Table 3, Fig. 4).
Survival analysis
PTC cases with higher expression of SLC5A5 mRNA had a fa- vorable prognosis regarding DFS (hazard ratio 0.3319, p=
0.004); however, there was no association with OS (Fig. 5). In addition, SLC2A2 and SLC2A3 mRNA had unfavorable prog- nosis regarding OS. Among the HK family genes, higher ex- 15
10 5 0 -5
15 10 5 0 -5
15 10 5 0 -5
15 10 5 0 -5
15 10 5 0 -5
15 10 5 0 -5
15 10 5 0 -5
15 10 5 0 -5
15 10 5 0 -5 SLC5A5 mRNA level (log2 transformed values)SLC2A3 mRNA level (log2 transformed values)HK2 mRNA level (log2 transformed values) SLC2A1 mRNA level (log2 transformed values)SLC2A4 mRNA level (log2 transformed values)HK3 mRNA level (log2 transformed values) SLC2A2 mRNA level (log2 transformed values)HK1 mRNA level (log2 transformed values)G6PD mRNA level (log2 transformed values)
BRAF(-) BRAF(+)
BRAF(-) BRAF(+)
BRAF(-) BRAF(+)
BRAF(-) BRAF(+)
BRAF(-) BRAF(+)
BRAF(-) BRAF(+)
BRAF(-) BRAF(+)
BRAF(-) BRAF(+)
BRAF(-) BRAF(+)
–
–
–
–
–
–
–
–
–
–
–
–
–
–
–
–
–
–
–
–
–
–
–
–
–
–
–
–
–
–
–
–
–
–
–
–
–
–
–
–
–
–
–
–
–
p<0.001
p<0.001
p=0.002
p<0.001
p<0.001
p<0.001
p=0.329
p<0.001
p<0.001 A
D
G
B
E
H
C
F
I
Fig. 3. mRNA expression dynamics according to BRAF mutation status. (A) SLC5A5, (B) SLC2A1, (C) SLC2A2, (D) SLC2A3, (E) SLC2A4, (F) HK1, (G) HK2, (H) HK3, and (I) G6PD.
Table 3. Median mRNA Expression according to BRAF or RAS Mutation Status
Protein mRNA BRAF RAS
(+), n=234 (-), n=157 p value (+), n=52 (-), n=339 p value
Sodium-iodide symporter SLC5A5 1.19 4.03 <0.001 2.96 1.87 0.335
Glucose transporter
SLC2A1 10.02 9.45 <0.001 9.462 9.887 <0.001
SLC2A2 -3.32 -3.32 0.329 -3.32 -3.32 0.432
SLC2A3 10.50 9.21 <0.001 8.81 10.26 <0.001
SLC2A4 4.80 6.55 <0.001 7.19 5.29 <0.001
Hexokinase
HK1 11.36 11.93 <0.001 11.91 11.47 <0.001
HK2 11.14 10.92 0.002 11.05 11.03 0.898
HK3 6.29 4.38 <0.001 3.76 5.87 <0.001
Glucose 6 phosphatase G6PD 10.70 10.89 <0.001 10.82 10.75 0.244
The median of log2 transformation of mRNA expression is indicated.
pression of HK1 mRNA was associated with a better prognosis concerning DFS (0.4055, p=0.013), although PTC patients with higher expression of HK3 mRNA showed a worse prog- nosis in DFS (2.299, p=0.0227) (Table 4).
DISCUSSION
In this study, expression of SLC5A5 mRNA was negatively cor- related with that of SLC2A1 and HK2 and was positively cor- related with SLC2A4 and HK1. During the natural evolution of
15 10 5 0 -5
15 10 5 0 -5
15 10 5 0 -5
15 10 5 0 -5
15 10 5 0 -5
15 10 5 0 -5
15 10 5 0 -5
15 10 5 0 -5
15 10 5 0 -5 SLC5A5 mRNA level (log2 transformed values)SLC2A3 mRNA level (log2 transformed values)HK2 mRNA level (log2 transformed values) SLC2A1 mRNA level (log2 transformed values)SLC2A4 mRNA level (log2 transformed values)HK3 mRNA level (log2 transformed values) SLC2A2 mRNA level (log2 transformed values)HK1 mRNA level (log2 transformed values)G6PD mRNA level (log2 transformed values)
RAS(-) RAS(+)
RAS(-) RAS(+)
RAS(-) RAS(+)
RAS(-) RAS(+)
RAS(-) RAS(+)
RAS(-) RAS(+)
RAS(-) RAS(+)
RAS(-) RAS(+)
RAS(-) RAS(+)
–
–
–
–
–
–
–
–
–
–
–
–
–
–
–
–
–
–
–
–
–
–
–
–
–
–
–
–
–
–
–
–
–
–
–
–
–
–
–
–
–
–
–
–
–
p=0.335
p<0.001
p=0.898
p<0.001
p<0.001
p<0.001
p=0.432
p<0.001
p=0.244 A
D
G
B
E
H
C
F
I
Fig. 4. mRNA expression patterns according to RAS mutation status. (A) SLC5A5, (B) SLC2A1, (C) SLC2A2, (D) SLC2A3, (E) SLC2A4, (F) HK1, (G) HK2, (H) HK3, and (I) G6PD.
100
50
0
100
50
0
Percent survival Percent survival
Months Months
0 50 100 150 200 0 50 100 150 200
–
–
–
–
–
–
p=0.004 Low p=0.3536
High Low
High
Fig. 5. Survival curves in the context of SLC5A5 mRNA abundance. (A) Disease-free survival and (B) overall survival.
A B
differentiated thyroid cancer (DTC), either before diagnosis or over the course of treatment and follow-up, there is some loss of the ability to take up iodine owing to diminished SLC5A5 expression. A defective iodide-trapping mechanism due to re- duced SLC5A5 expression appears to be an early and consis- tent feature of the oncogenic transformation of thyroid cells, and is associated with neoplastic transformation.10 This phe- nomenon is often seen as DTC progresses to the later stages of cancer development, and explains why advanced, high-risk DTC patients have a poorer response to RAI than early-stage DTC patients.11
Among the 14 SLC2A subtypes, SLC2A1 has been most widely investigated in various cancer types, including thyroid cancer, wherein some studies have found increased SLC2A1 expression.12,13 Furthermore, adverse effects of SLC2A overex- pression on survival outcomes in PTC patients have been im- plied for associations between SLC2A1 overexpression and tumor aggressiveness or dedifferentiation.14,15 The expression of SLC5A5 and SLC2A1 mRNA is related to the accumulation of radioactive iodine (123I or 131I) and 18F-FDG in thyroid cancer cells,16 and the expression of these genes provides a molecular basis for the image modalities of gamma cameras and PET with these radiopharmaceuticals. High glucose uptake mea- sured by FDG PET is associated with low SLC5A5 expression, which indicates dedifferentiation in thyroid cancer.17 This finding is a known phenomenon called “flip-flop” in FDG PET and WBS, which explains the mechanism of how FDG PET detects recurrent or metastatic cancer in patients, but WBS fails to detect tumors,18 consistent with guidelines from the American Thyroid Association.3 As a whole, our findings suggest that SLC2A1 and HK2 expression may be related to BRAF mutation and 18F-FDG uptake of PTC, which leads to cancer aggressiveness or dedifferentiation. Further studies are needed to clarify the relationship among 18F-FDG uptake, the expression of variable glucose transporters, HK2, and BRAF mutations.
Most mRNA expression patterns in this study were signifi- cantly associated with PTC genetic mutations. Findings from a previous PTC TCGA showed that BRAF and RAS-like classes
of PTC are significantly distinct in regards to differentiation state, and BRAF-like tumors exhibit a gene expression profile associated with a less differentiated state.9 Morari, et al.19 found that 230 DTC patients with a BRAF mutation had reduced SL- C5A5 mRNA abundance. In this study, expressions of SLC2A1, SLC2A3, HK2, and HK3 mRNA were higher in PTC patients with BRAF mutations, which might reflect excessive glucose influx required for cancer cell proliferation facilitated by SL- C2A,20 a well-known prognostic marker of DTC.21 This study is the first to show an association between mRNA and genetic mutation-prognosis. Our data suggest that mRNA expression helps to characterize a patient’s risk and to identify individu- als with a poor response to therapy. A larger number of patients with long-term follow-up may also confirm the clinical use of mRNA expression, reinforcing the predictive value of clinico- pathological outcomes/markers, such as age and tumor size, as well as molecular markers, such as BRAF mutations.
We demonstrated that the expression of SLC5, SLC2, and HK genes (associated with survival) was associated with BRAF and RAS mutations, a well-known, adverse prognostic factor in PTC.21 The BRAF gene encodes a serine/threonine kinase that belongs to the RAS-RAF-MEK-ERK-MAP kinase pathway, whose biological role is to mediate cellular responses to growth factors.1,2 Furthermore, we demonstrated that expression of SLC5A5, HK1, and HK3 mRNA was associated with PTC re- currence. Extranodal extension is also associated with poor prognosis in thyroid cancer.22 Our study is the first to show an association between mRNA expression and genetic mutation in cancer prognosis. Our data suggests that mRNA expression may help to determine patient risk and individuals with a poor response to therapy. Ward, et al.23 identified that patients with PTC who experienced early recurrence or metastasis show low expression levels of SLC5A5 mRNA in primary tu- mors. As expected, SLC2A2 and SLC2A3 mRNA, which are known to be associated with BRAF and RAS mutations, had unfavorable prognosis regarding OS. As lower mRNA expres- sion of SLC5A5 reflects a poorer response to radioactive io- dine therapy, it is reasonable that this population of patients have favorable prognosis in DFS. However, mRNA expression Table 4. Survival Analysis according to mRNA Expression
Protein mRNA Disease-free survival Overall survival
Hazard ratio 95% CI p value Hazard ratio 95% CI p value
Sodium-iodide symporter SLC5A5 0.332 0.169−0.650 0.004 1.660 0.550−5.007 0.354
Glucose transporter
SLC2A1 1.499 0.765−2.938 0.247 2.402 0.798−7.228 0.166
SLC2A2 1.612 0.823−3.157 0.171 4.351 1.456−13 0.035
SLC2A3 1.294 0.660−2.536 0.457 3.432 1.123−10.490 0.082
SLC2A4 0.513 0.262−1.004 0.063 0.593 0.198−1.780 0.377
Hexokinase
HK1 0.406 0.207−0.794 0.013 1.339 0.450−3.983 0.596
HK2 1.406 0.718−2.753 0.326 0.820 0.276−2.432 0.720
HK3 2.299 1.174−4.504 0.023 1.806 0.605−5.392 0.317
Glucose 6 phosphatase G6PD 0.809 0.413−1.585 0.538 1.099 0.367−3.287 0.864
CI, confidence interval.
of SLC5A5 did not affect OS, as PTC is perceived to have a high survival rate, with a minority of patients showing recur- rence or metastasis.24 A larger number of patients with long- term follow-up may also confirm the clinical use of mRNA ex- pression, reinforcing the predictive value of well-recognized clinical and pathological predictors of outcome.
Despite a vast amount of genetic and epigenetic information, the absence of solid prospective studies on thyroid cancer and information on the relationships among clinical, pathological, and genetic factors makes it difficult to discern the prognostic role played by genetic mutations.5 The molecular character- ization of thyroid cancer has begun to influence its diagnosis and treatment landscape. Gene expression analysis might also be clinically useful in the near future. In this study, we found evidence for the genetic basis of 18F-FDG PET in PTC patients with negative WBS with RAI and the prognostic value of SL- C5A5 in PTC. Additionally, there is a demand for new drugs for PTC refractory to standard treatment with RAI, as the im- pact of tyrosine kinase inhibitors on survival is not satisfactory and their side effects are often fatal.1,2 In addition to prognosis, the aforementioned mutations and respective molecular path- ways, as well as genetic and epigenetic alterations recently identified by TCGA,9 may serve as likely targets and areas of focus for personalized therapy. Furthermore, drugs inhibiting SLC2A-family genes might have great therapeutic potential by inducing starvation of tumor cells.25 In addition, SLC5A5 ex- pression can be augmented by upregulation of both transcrip- tional and post-translational pathways. Some isoform-specific signal transduction pathways may play critical roles in tissue- specific SLC5A5 regulation. Delineation of such signaling path- ways may lead to methods that will further enhance function- al SLC5A5 expression in DTC, thus expanding the application of RAI to RAI-refractory PTC.26 We could not analyze the other important genes related to iodine metabolism due to lack of data. In addition, we could only analyze expressions of mRNAs, not those of proteins. Further studies are needed to investigate the expression levels of proteins between SLC2A family and SLC5A5.
In conclusion, expression of SLC5A5 mRNA was negatively correlated with SLC2A1. This finding provides a molecular basis for the management of PTC patients with negative WBS using 18F-FDG PET scans. In addition, higher SLC5A5 mRNA expression was associated with less frequent recurrence or metastasis, but not with deaths. Moreover, PTC patients with BRAF mutations had reduced SLC5A5 mRNA expression and higher expression of HK2 and HK3 mRNA, which might re- flect a less-differentiated state of PTC.
ACKNOWLEDGEMENTS
This work was supported by a Dong-A University research fund grant and the Basic Science Research Program through the National Research Foundation of Korea (2017R1D1A1B03029
352/2017R1D1A1B03033235). The funding source had no role in the collection of the data or in the decision to submit the man- uscript for publication.
ORCID
Sunghwan Suh https://orcid.org/0000-0001-6865-966X Yun Hak Kim https://orcid.org/0000-0002-9796-8266 Tae Sik Goh https://orcid.org/0000-0003-1861-5647 Kyoungjune Pak https://orcid.org/0000-0001-5051-1894
REFERENCES
1. Cabanillas ME, McFadden DG, Durante C. Thyroid cancer. Lan- cet 2016;388:2783-95.
2. Ahn HS, Welch HG. South Korea’s thyroid-cancer “Epidemic”- -turning the tide. N Engl J Med 2015;373:2389-90.
3. Haugen BR, Alexander EK, Bible KC, Doherty GM, Mandel SJ, Ni- kiforov YE, et al. 2015 American Thyroid Association manage- ment guidelines for adult patients with thyroid nodules and dif- ferentiated thyroid cancer: The American Thyroid Association Guidelines Task Force on thyroid nodules and differentiated thy- roid cancer. Thyroid 2016;26:1-133.
4. Pak K, Cheon GJ, Nam HY, Kim SJ, Kang KW, Chung JK, et al.
Prognostic value of metabolic tumor volume and total lesion gly- colysis in head and neck cancer: a systematic review and meta- analysis. J Nucl Med 2014;55:884-90.
5. Tavares C, Melo M, Cameselle-Teijeiro JM, Soares P, Sobrinho- Simöes M. ENDOCRINE TUMOURS: Genetic predictors of thy- roid cancer outcome. Eur J Endocrinol 2016;174:R117-26.
6. Chai YJ, Yi JW, Oh SW, Kim YA, Yi KH, Kim JH, et al. Upregulation of SLC2 (GLUT) family genes is related to poor survival outcomes in papillary thyroid carcinoma: analysis of data from The Cancer Genome Atlas. Surgery 2017;161:188-94.
7. Smith TA. FDG uptake, tumour characteristics and response to therapy: a review. Nucl Med Commun 1998;19:97-105.
8. Filetti S, Bidart JM, Arturi F, Caillou B, Russo D, Schlumberger M.
Sodium/iodide symporter: a key transport system in thyroid can- cer cell metabolism. Eur J Endocrinol 1999;141:443-57.
9. Cancer Genome Atlas Research Network. Integrated genomic characterization of papillary thyroid carcinoma. Cell 2014;159:
676-90.
10. Ros P, Rossi DL, Acebrón A, Santisteban P. Thyroid-specific gene expression in the multi-step process of thyroid carcinogenesis. Bio- chimie 1999;81:389-96.
11. Winter J, Winter M, Krohn T, Heinzel A, Behrendt FF, Tuttle RM, et al. Patients with high-risk differentiated thyroid cancer have a lower I-131 ablation success rate than low-risk ones in spite of a high ablation activity. Clin Endocrinol (Oxf) 2016;85:926-31.
12. Ravazoula P, Batistatou A, Aletra C, Ladopoulos J, Kourounis G, Tzigounis B. Immunohistochemical expression of glucose trans- porter Glut1 and cyclin D1 in breast carcinomas with negative lymph nodes. Eur J Gynaecol Oncol 2003;24:544-6.
13. Haber RS, Weiser KR, Pritsker A, Reder I, Burstein DE. GLUT1 glucose transporter expression in benign and malignant thyroid nodules. Thyroid 1997;7:363-7.
14. Józ´wiak P, Krzes´lak A, Pomorski L, Lipin´ska A. Expression of hy- poxia-related glucose transporters GLUT1 and GLUT3 in benign, malignant and non-neoplastic thyroid lesions. Mol Med Rep 2012;6:601-6.
15. Kim S, Chung JK, Min HS, Kang JH, Park DJ, Jeong JM, et al. Ex-
pression patterns of glucose transporter-1 gene and thyroid spe- cific genes in human papillary thyroid carcinoma. Nucl Med Mol Imaging 2014;48:91-7.
16. Chung JK. Sodium iodide symporter: its role in nuclear medicine.
J Nucl Med 2002;43:1188-200.
17. Moon SH, Oh YL, Choi JY, Baek CH, Son YI, Jeong HS, et al. Com- parison of 18F-fluorodeoxyglucose uptake with the expressions of glucose transporter type 1 and Na+/I- symporter in patients with untreated papillary thyroid carcinoma. Endocr Res 2013;38:77-84.
18. Chung JK, So Y, Lee JS, Choi CW, Lim SM, Lee DS, et al. Value of FDG PET in papillary thyroid carcinoma with negative 131I whole-body scan. J Nucl Med 1999;40:986-92.
19. Morari EC, Marcello MA, Guilhen AC, Cunha LL, Latuff P, Soares FA, et al. Use of sodium iodide symporter expression in differenti- ated thyroid carcinomas. Clin Endocrinol (Oxf) 2011;75:247-54.
20. Yamamoto T, Seino Y, Fukumoto H, Koh G, Yano H, Inagaki N, et al. Over-expression of facilitative glucose transporter genes in hu-
man cancer. Biochem Biophys Res Commun 1990;170:223-30.
21. Pak K, Suh S, Kim SJ, Kim IJ. Prognostic value of genetic muta- tions in thyroid cancer: a meta-analysis. Thyroid 2015;25:63-70.
22. Suh S, Pak K, Seok JW, Kim IJ. Prognostic value of extranodal ex- tension in thyroid cancer: a meta-analysis. Yonsei Med J 2016;57:
1324-8.
23. Ward LS, Santarosa PL, Granja F, da AssumpÇão LV, Savoldi M, Goldman GH. Low expression of sodium iodide symporter identi- fies aggressive thyroid tumors. Cancer Lett 2003;200:85-91.
24. Schlumberger MJ. Papillary and follicular thyroid carcinoma. N Engl J Med 1998;338:297-306.
25. Ulanovskaya OA, Cui J, Kron SJ, Kozmin SA. A pairwise chemical genetic screen identifies new inhibitors of glucose transport. Chem Biol 2011;18:222-30.
26. Kogai T, Brent GA. The sodium iodide symporter (NIS): regula- tion and approaches to targeting for cancer therapeutics. Phar- macol Ther 2012;135:355-70.