Received: June 19, 2013 Revised: September 8, 2013 Accepted: October 18, 2013
Correspondence to: Nam Joong Kim, Department of Internal Medicine, Seoul National University College of Medicine, 101, Daehak-ro, Jongno-gu, Seoul 110-744, Korea
Tel: 02-2072-0835, Fax: 02-762-9662 E-mail: [email protected]
KI Jun and HL Koo are equally contributed to this article.
일개 대학병원의 항생제 사용양상 변화(2001-2012)
전강일1ㆍ구혜림2ㆍ김민경1ㆍ강창경1ㆍ김민재1ㆍ천신혜1ㆍ송정숙2ㆍ김향숙3ㆍ김남중1,2ㆍ김의종4ㆍ오명돈1
서울대학교 의과대학 내과학교실1, 서울대학교병원 감염관리실2, 서울대학교병원 약제부3 서울대학교 의과대학 진단검사의학교실4
Trends in Antibiotic Use in a Single University Hospital
Kang Il Jun1, Hei Lim Koo2, Min Kyung Kim1, Chang Kyung Kang1, Min Jae Kim1, Shin Hye Chun1, Jung Sook Song2, Hyang Sook Kim3, Nam Joong Kim1,2, Eui Chong Kim4, Myoung Don Oh1
Department of Internal Medicine, Seoul National University College of Medicine1,
Infection Control Service, Seoul National University Hospital2, Department of Pharmacy, Seoul National University Hospital3, Department of Laboratory Medicine, Seoul National University College of Medicine4, Seoul, Korea
Background: The aim of this study was to evaluate antibiotic consumption by adult patients at a single university hospital in Korea between 2001 and 2012.
Methods: We used the 2004 World Health Organization Anatomical Therapeutic Chemical Classification System definition of defined daily doses (DDD) per 1,000 patient-days to calculate the annual antibiotic consumption for 18 antibiotic groups. Chi-square linear-by-linear analysis was performed to evaluate antibiotic consumption trends for each group.
Results: Average annual antibiotic consumption during 2001-2012 was 644.6 DDD/1,000 patient-days (standard deviation, 33.3 DDD/1,000 patient-days). Although no statistically significant change was observed during the study period, consumption of first- and second-generation cephalosporins, and aminoglycosides was significantly decreased, while that of beta-lactam/beta-lactamase inhibitors, fourth-generation cephalosporins, carbapenem, glycopeptide, linezolid, colistin, and quinolone increased significantly.
Conclusion: The total amount of prescribed antibiotics did not change, but the use of broad-spectrum antibiotics increased during the study period.
Keywords: Anti-bacterial agents, University hospitals, Utilization
Introduction
항생제는 병원에서 흔히 처방되는 약물로 병
원에 입원 중인 환자의 25%-50%가 항생제를 투 여 받고 있다[1,2]. 감염병을 치료하기 위해 항생 제를 투여하지만, 항생제 투여에는 부작용 발생, 비용 및 항생제 내성균 증가라는 손해가 동반될 수 있다. 적절한 항생제 요법이라 함은 원인 미 생물에 대해 항균력이 있고 감염병소 투과력이 우수한 항생제 중 가장 항균력이 좁은 약제를 선 정하여 적절한 용량으로 필요한 기간만큼 항생 제를 투여하는 것을 뜻한다. 항생제를 투여 받는 환자를 대상으로 적절성을 평가한 연구들에서 적절한 항생제를 투여받는 분율은 30%-80% 정 도로 다양한 분포를 보이고 있다[3-6].
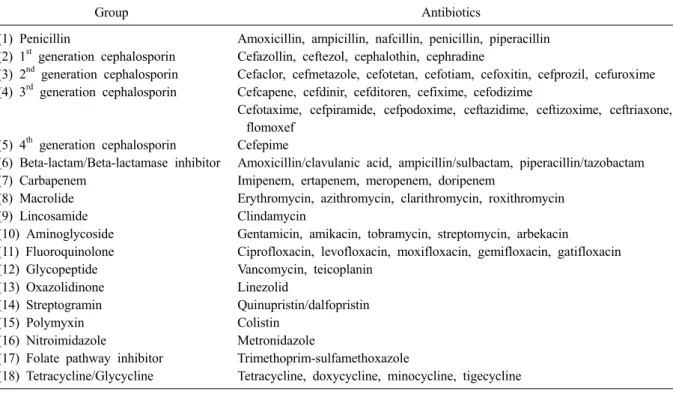
Table 1. Categorization of antibiotics into 18 groups
Group Antibiotics
(1) Penicillin Amoxicillin, ampicillin, nafcillin, penicillin, piperacillin (2) 1st generation cephalosporin Cefazollin, ceftezol, cephalothin, cephradine
(3) 2nd generation cephalosporin Cefaclor, cefmetazole, cefotetan, cefotiam, cefoxitin, cefprozil, cefuroxime (4) 3rd generation cephalosporin Cefcapene, cefdinir, cefditoren, cefixime, cefodizime
(5) 4th generation cephalosporin
Cefotaxime, cefpiramide, cefpodoxime, ceftazidime, ceftizoxime, ceftriaxone, flomoxef
Cefepime
(6) Beta-lactam/Beta-lactamase inhibitor Amoxicillin/clavulanic acid, ampicillin/sulbactam, piperacillin/tazobactam (7) Carbapenem Imipenem, ertapenem, meropenem, doripenem
(8) Macrolide Erythromycin, azithromycin, clarithromycin, roxithromycin
(9) Lincosamide Clindamycin
(10) Aminoglycoside Gentamicin, amikacin, tobramycin, streptomycin, arbekacin
(11) Fluoroquinolone Ciprofloxacin, levofloxacin, moxifloxacin, gemifloxacin, gatifloxacin
(12) Glycopeptide Vancomycin, teicoplanin
(13) Oxazolidinone Linezolid
(14) Streptogramin Quinupristin/dalfopristin
(15) Polymyxin Colistin
(16) Nitroimidazole Metronidazole
(17) Folate pathway inhibitor Trimethoprim-sulfamethoxazole
(18) Tetracycline/Glycycline Tetracycline, doxycycline, minocycline, tigecycline Only antibiotics prescribed in the study hospital are included.
항생제 사용 적절성을 높이려면 감염병의 정 확한 진단, 원인미생물의 감수성 결과에 따른 항 생제 선정, 항생제 처방 의료진에 대한 교육, 광 범위 항생제에 대한 사전승인 시스템 등이 필요 하다[7]. 또한 해당 병원에서 분리되는 미생물의 항생제 감수성 양상, 항생제 사용양상의 변화를 파악하여 항생제 내성균 분리율이 증가하는지, 광범위 항생제 사용이 늘고 있는지 모니터링이 필요하다. 우리나라 3차 병원에서 항생제 사용양 상 변화를 분석한 자료가 몇 차례 발표된 바 있 으나 2007년 이후 항생제 사용양상 변화에 대한 자료는 발표되지 않았다[8,9]. 본 연구의 목적은 2001년부터 2012년 사이에 우리나라 일개 대학 병원에서 항생제 사용량과 사용양상의 변화를 파악하는 것이다.
Materials and Methods
본 연구는 서울에 위치한 1,600병상 규모의 일 개 대학병원에서 이루어졌다. 2001년 1월부터 2012년 12월 사이에 입원치료를 받은 18세 이상 의 성인환자에서 사용된 모든 경구 항생제, 근육 주사 및 정맥주사 항생제를 대상으로 항생제 종
류와 사용량을 조사하였다. 국소도포 항생제, 항 진균제, 항바이러스제는 조사대상에서 제외되었 다. 항생제의 사용량을 세계보건기구의 Anatomical Therapeutic Chemical Classification System에서 제시 한 defined daily dose (DDD)로 변경한 후, 연간사 용량을 DDD/1,000 patient-days로 환산하였다[10].
DDD가 정의되어 있지 않은 항생제에 대해서는 일반적인 사용량을 바탕으로 연구자들이 DDD를 결정하였다. 항생제 전체 사용량과 함께 계열별 사용량을 조사하였으며 이때 사용한 그룹별 항 생제 분류방식은 Table 1과 같다. 또한 중환자실 에 국한하여 광범위 항생제 사용량(3세대 세팔로 스포린, 4세대 세팔로스포린, 카바페넴, 퀴놀론, 글리코펩티드)과 다제내성균 분리율을 조사하였 다. 시간 경과에 따른 항생제 사용량의 변화 양 상을 알기 위해 카이제곱 선형 대 선형결합 분석 법을 시행하였다.
Results
항생제 사용량의 변화
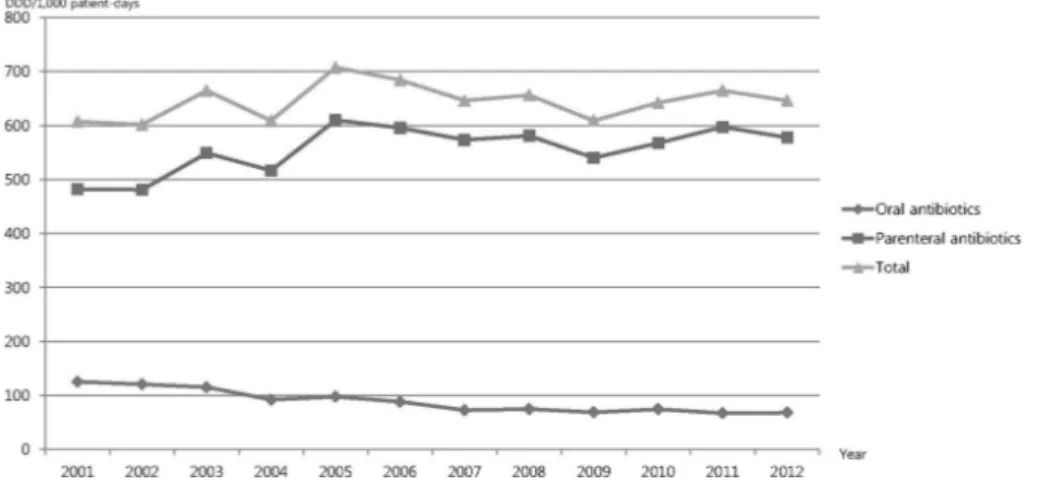
2001년부터 2012년까지 12년 동안 항생제 사 용량의 평균값은 644.6 DDD/1,000 patient-days
Fig. 1. The amount of an- nual oral, parenteral, and total antibiotic consumption between 2001 and 2012.
(표준편차 33.3 DDD/1,000 patient-days)었다(Fig. 1).
경구 항생제 사용량의 평균값은 88.8 DDD/1,000 patient-days (표준편차 21.5 DDD/1,000 patient- days) 였고, 정주 항생제 사용량의 평균값은 555.8 DDD/1,000 patient-days (표준편차 43.3 DDD/1,000 patient-days) 였다. 12년 동안 항생제 전체 사용량의 유의한 차이는 없었다(카이제곱 선형 대 선형결합 P=0.42). 하지만 경구 항생제 사용량은 2001년 125.3 DDD/1,000 patient-days에 서 2012년 68.1 DDD/1,000 patient-days로 유의하 게 감소하였다(P=0.002). 반면 정주 항생제 사용 량은 2001년 481.9 DDD/1,000 patient-days에서 2012년 577.7 DDD/1,000 patient-days로 증가하였 으나 통계적 유의성은 없었다(P=0.31).
계열별 항생제 사용량의 변화
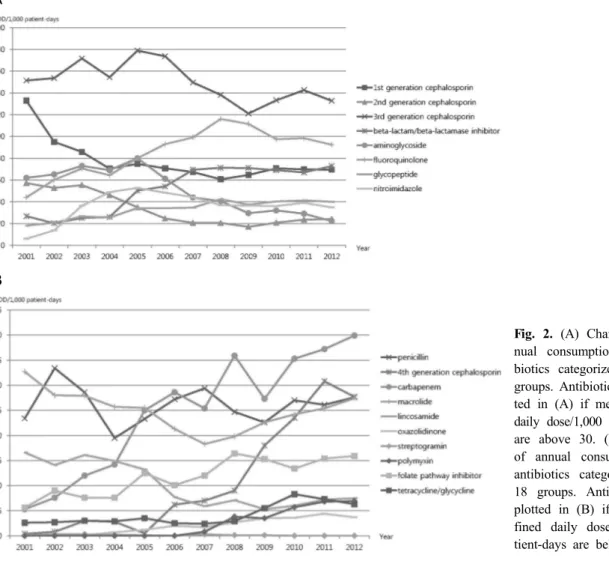
2001년부터 2012년까지 12년 동안 계열별 항생 제 사용량의 변화를 Fig. 2에 제시하였다. 연구 기 간 중 1세대 세팔로스포린의 사용량은 2001년 132.9 DDD/1,000 patient-days에서 2012년 69.5 DDD/1,000 patient-days (P=0.019)로 2세대 세팔로 스포린의 사용량은 2001년 57.1 DDD/1,000 pa- tient-days에서 2012년 24.2 DDD/1,000 patient-days (P=0.004)로 아미노글리코사이드의 사용량은 2001 년 62.0 DDD/1,000 patient-days에서 2012년 22.4 DDD/1,000 patient-days (P=0.004)로 감소하였다.
4세대 세팔로스포린의 사용량은 2001년 0.4 DDD/1,000 patient-days에서 2012년 27.7 DDD/
1,000 patient-days (P=0.019)로 카바페넴 사용량은 2001년 5.3 DDD/1,000 patient-days에서 2012년
39.9 DDD/1,000 patient-days (P=0.002)로 베타락탐/
베타락탐분해효소 억제제의 사용량은 2001년 26.8 DDD/1,000 patient-days에서 2012년 72.8 DDD/1,000 patient-days (P=0.003)로 증가하였다. 또한 글리코 펩티드의 사용량은 2001년 18.1 DDD/1,000 pa- tient-days에서 2012년 40.0 DDD/1,000 patient-days (P=0.002)로 리네졸리드의 사용량은 2003년 0.1 DDD/1,000 patient-days에서 2012년 3.7 DDD/1,000 patient-days (P=0.001)로 퀴놀론 사용량은 2001년 44.1 DDD/1,000 patient-days에서 2012년 92.4 DDD/1,000 patient-days (P=0.007)로 증가하였다.
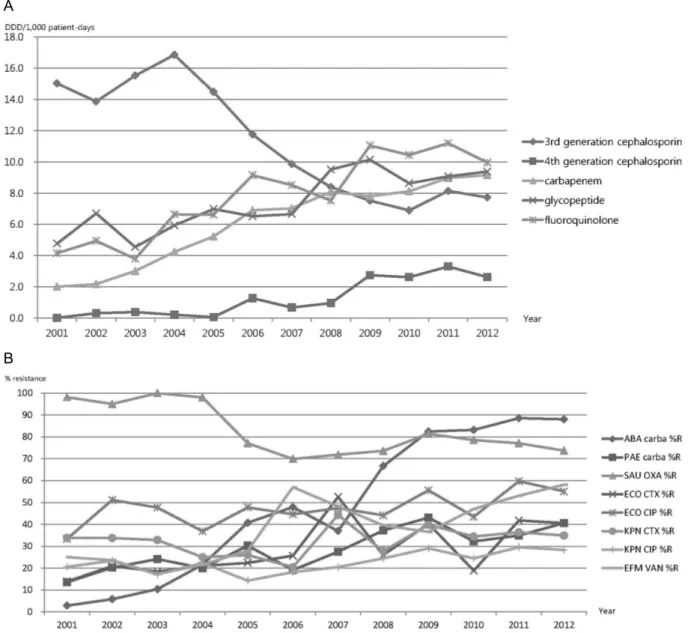
중환자실의 광범위 항생제 사용량과 다제내 성균 분리율
중환자실로 국한하여 광범위 항생제에 속하는 3세대 세팔로스포린, 4세대 세팔로스포린, 카바페 넴, 퀴놀론, 글리코펩티드의 사용량 변화를 조사 하였다(Fig. 3). 3세대 세팔로스포린을 제외한 다 른 광범위 항생제 사용량이 모두 유의하게 증가하 였다. 중환자실에서 분리된 S. aureus의 메티실린 내성률과 K. pneumoniae의 3세대 세팔로스포린 내 성률은 증가하지 않았으나 E. faecium의 반코마이 신 내성률, E. coli의 퀴놀론 및 3세대 세팔로스포 린 내성률, K. pneumoniae의 퀴놀론 내성률, P.
aeruginosa의 카바페넴 내성률, A. baumannii의 카 바페넴 내성률은 모두 유의하게 증가하였다.
Discussion
2001년부터 2012년 사이 국내 일개 대학병원
A
B
Fig. 2. (A) Change of an- nual consumption of anti- biotics categorized into 18 groups. Antibiotics are plot- ted in (A) if mean defined daily dose/1,000 patient-days are above 30. (B) Change of annual consumption of antibiotics categorized into 18 groups. Antibiotics are plotted in (B) if mean de- fined daily dose/1,000 pa- tient-days are below 30.
에서 조사한 항생제 사용량의 평균값은 644.6 DDD/1,000 patient-days였고, 시간에 따른 유의 한 차이가 없었다. 항생제 사용량은 연구 기간 및 국가, 연구대상 병원의 규모에 따라 상당한 차이가 있다. 외국 자료에서 제시된 항생제 전 체 사용량은 적게는 100 DDD/1,000 patient-days 였고, 많게는 1,000 DDD/1,000 patient-days를 상 회하였다[4,11-14]. 국내 다른 3차 병원에서 2000-2006년 사이에 조사된 총 항생제 사용량 은 680-820 DDD/1,000 patient-days로 본 연구와 큰 차이가 없었다[8,9].
연구기간동안 전체 항생제 사용량은 변동이 없었으나 계열별 항생제 사용량은 뚜렷한 변동 이 있었다. 항균범위가 상대적으로 좁은 1세대 및 2세대 세팔로스포린 사용량이 줄었고, 신독성 및 이독성으로 인해 제한적인 사용이 추천되고 있는 아미노글리코사이드 사용량이 유의하게 줄
었다. 반면 항균범위가 상대적으로 넓은 베타락 탐/베타락탐분해효소 억제제, 4세대 세팔로스포 린, 카바페넴, 글리코펩티드, 리네졸리드, 콜리스 틴, 퀴놀론의 사용량은 유의하게 늘었다. 2001년 대비 항생제 사용량 증가가 가장 뚜렷한 항생제 는 카바페넴으로 2012년 사용량이 2001년 사용 량의 7.53배에 해당하였다. 특히 중환자실에서 4 세대 세팔로스포린, 카바페넴, 퀴놀론, 글리코펩 티드의 사용량 증가는 뚜렷하였다. 연구자들은 1998년부터 2010년 사이 동일병원의 혈액배양 검체에서 분리된 병원균의 항생제 내성양상변화 를 발표한 바 있다[15]. 1998년부터 2010년 사이 동일병원에서 분리된 S. aureus 중 메티실린 내성 균의 분율은 48%에서 62%로 증가하였고, E. fae- cium 중 반코마이신 내성균의 분율은 0%에서 35%로 증가하였다. 또 E. coli의 시프로플록사신 내성균의 분율은 20%에서 35%로 증가하였고, A.
A
B
Fig. 3. (A) Change of annual consumption of broad spectrum antibiotics (3rd generation cephalosporin, 4th generation cephalosporin, carbapenem, glycopeptide, and quinolone) for patients in the intensive care units. (B) Change of anti- microbial resistance rate in the intensive care units. Carba, carbapenem; OXA, oxacillin; CTX, ceftriaxone; CIP, cipro- floxacin; VAN, vancomycin, ABA, A. baumannii; PAE, P. aeruginosa; SAU, S. aureus; ECO, E. coli; KPN, K. pneumo- niae, EFM, E. faecium; %R, % resistant.
baumannii 중 카바페넴 내성균의 분율은 5%에서 70%로 뚜렷한 증가를 보였다. 연구기간 동안 중 환자실 환자에서 분리된 E. faecium 중 반코마이 신 내성균의 분율, E. coli의 퀴놀론 및 3세대 세 팔로스포린 내성균의 분율, K. pneumoniae의 퀴 놀론 내성균의 분율, P. aeruginosa의 카바페넴 내 성균의 분율, A. baumannii의 카바페넴 내성균의 분율은 모두 유의하게 증가하였다. 퀴놀론 사용 증가와 methicillin resistant S. aureus 발생, 반코마 이신 사용증가와 vancomycin resistant enterococcus
발생, 카바페넴 사용증가와 imipenem resistant A.
baumannii 발생의 연관성은 잘 알려져 있다[16,17].
본 연구결과는 일개 대학병원에서 수집된 것 이지만, 이전에 발표된 국내자료와 비교하였을 때 항생제 사용양상이 비슷함을 확인할 수 있었 다. 2000년부터 2006년 사이 일개 대학병원의 항 생제 사용양상을 발표한 자료에서 연도별 항생 제 사용량은 700-800 DDD/1,000 patient-days였고 시간이 지남에 따라 유의한 증가를 보였다[8]. 상 기 연구에서 시간이 지남에 따라 베타락탐/베타
락탐분해효소 억제제, 3세대 세팔로스포린, 카바 페넴, 글리코펩티드의 사용량은 유의하게 늘었고 아미노글리코사이드의 사용량은 유의하게 줄었 다. 김 등은 ‘의약품 등 생산실적표’를 토대로 1981년부터 2008년 사이 국내 항생제 사용실태 변화추세를 발표하였으며, 이 연구에서도 시간경 과에 따라 베타락탐/베타락탐분해효소 억제제, 3 세대 및 4세대 세팔로스포린, 카바페넴, 글리코 펩티드 생산량은 증가하고 1세대 세팔로스포린, 아미노글리코사이드 생산량은 감소함이 관찰되 었다[18].
2004년 10월 연구대상 병원에 전자의무기록이 도입되었으며, 항생제 적정사용을 유도하기 위해 항생제 사용관리프로그램이 함께 도입되었다. 입 원 중인 환자에서 항생제를 투여하려면 반드시 항생제 사용관리프로그램을 사용하도록 강제하 였으며, 항생제 처방사유와 감염부위를 입력하면 적절한 항생제를 추천하여 이 중 선택하도록 권 고하였다. 하지만 항생제 사용관리프로그램 도입 전후에 분석한 항생제 처방건수 및 사용량은 유 의한 차이를 보이지 않았다[19].
본 연구에서는 성인환자에서 투여된 항생제만 을 조사대상으로 하였기 때문에 소아환자에서 항생제 사용량의 변화나 사용양상은 파악할 수 없었고 항진균제와 항바이러스제에 대한 분석을 시행하지 않았다. 또한 시계열분석을 하지 않았 기 때문에 항생제 사용량과 내성률 변화 사이의 통계적 유의성을 검증하지 못하였다. 하지만 12 년간 항생제 사용양상 변화에 대한 자료는 앞으 로 적절한 항생제 사용을 유도하기 위한 자료로 가치가 있다고 생각한다.
요약하면 일개대학병원에서 12년간 사용한 항 생제 사용량의 평균값은 644.6 DDD/1,000 pa- tient-days였고, 시간이 경과함에 따라 광범위 항 생제 사용이 유의하게 증가하였다.
Summary
배경: 국내 일개 대학병원에서 2001년 1월부 터 2012년 12월 사이 18세 이상의 성인환자에서 사용된 모든 경구 항생제, 근육주사 및 정맥주사 항생제를 대상으로 항생제 종류와 사용량을 조
사하였다.
방법: 항생제 사용량을 세계보건기구의 Anat- omical Therapeutic Chemical Classification System 에서 제시한 defined daily dose (DDD)로 변경한 후, 연간사용량을 DDD/1,000 patient-days로 환산 하였다. 연도별로 전체 항생제 사용량, 계열별 항 생제 사용량을 조사하였다.
결과: 2001년부터 2012년까지 12년 동안 항생 제 사용량의 평균값은 644.6 DDD/1,000 patient- days (표준편차 33.3 DDD/1,000 patient-days) 였 고, 전체 항생제 사용량의 유의한 변화는 관찰되 지 않았다. 연구기간 중 1세대 및 2세대 세팔로 스포린, 아미노글리코사이드 사용량이 유의하게 줄었고, 항균범위가 넓은 베타락탐/베타락탐분해 효소 억제제, 4세대 세팔로스포린, 카바페넴, 글 리코펩티드, 리네졸리드, 콜리스틴, 퀴놀론의 사 용량은 유의하게 늘었다.
결론: 12년간 사용한 항생제 사용량의 평균값 은 644.6 DDD/1,000 patient-days였고, 시간이 경 과함에 따라 광범위 항생제 사용이 유의하게 증 가하였다.
References
1. Wickens HJ, Ashiru-Oredope DAI, Farrell S, Jacklin A. Managing and reporting of antibiotic usage data in English hospitals. Clin Microbiol Infect 2012;18(S):1-113, O658.
2. Borrás Novell C, Hernández Bou S, García García JJ; en representación del Grupo de Trabajo de Enfermedades Infecciosas de la Sociedad Española de Urgencias de Pediatría (SEUP). Pre- scribing of antibiotics in patients admitted from Emergency Departments: a multicenter study. An Pediatr (Barc) 2013;79:15-20.
3. John JF Jr and Fishman NO. Programmatic role of the infectious diseases physician in controlling antimicrobial costs in the hospital. Clin Infect Dis 1997;24:471-85.
4. Janknegt R, Oude Lashof A, Gould IM, van der Meer JW. Antibiotic use in Dutch hospitals 1991-1996. J Antimicrob Chemother 2000;45:
251-6.
5. Cieslak PR, Strausbaugh LJ, Fleming DW, Ling JM. Vancomycin in Oregon: who's using it and why. Infect Control Hosp Epidemiol 1999;20:
557-60.
6. Melo DO, Ribeiro E. Vancomycin use in a Brazilian teaching hospital: comparison with the Hospital Infection Controlpractices Advisory Committee Guidelines (HICPAC). Braz J Infect Dis 2009;13:161-4.
7. Paskovaty A, Pflomm JM, Myke N, Seo SK. A multidisciplinary approach to antimicrobial stew- ardship: evolution into the 21st century. Int J Antimicrob Agents 2005;25:1-10.
8. Song YA, Jung SI, Chang MO, Ban HJ, Jin NC, Kim HK, et al. Relationship between antibiotic use and antibiotic resistance in major nosocomial pathogens at a university hospital. Chonnam Med J 2008;44:137-43.
9. Yoon YK, Kim MJ, Sohn JW, Park DW, Kim JY, Chun BC. Surveillance of antimicrobial use and antimicrobial resistance. Infect Chemother 2008;
40:93-101.
10. Dumartin C, L'Hériteau F, Péfau M, Bertrand X, Jarno P, Boussat S, et al. Antibiotic use in 530 French hospitals: results from a surveillance net- work at hospital and ward levels in 2007. J Antimicrob Chemother 2010;65:2028-36.
11. Petersen IS, Hesselbjerg L, Jørgensen L, Ren- strup J, Barnung S, Schierbeck J, et al. High anti- biotic consumption in Danish intensive care units?
APMIS 1999;107:989-96.
12. Carling PC, Fung T, Coldiron JS. Parenteral anti- biotic use in acute-care hospitals: A standardized analysis of fourteen institutions. Clin Infect Dis 1999;29:1189-96.
13. Walther SM, Erlandsson M, Burman LG, Cars O,
Gill H, Hoffman M, et al; Icustrama Study Group. Antibiotic prescription practices, con- sumption and bacterial resistance in a cross sec- tion of Swedish intensive care units. Acta Anaesthesiol Scand 2002;46:1075-81.
14. Gentry C, Flournoy DJ, Reinert R. Analysis of antimicrobial resistance among gram-negative ba- cilli and antimicrobial use in intensive care unit patients for 5 years in a Veterans Affairs medical center. Am J Infect Control 2002;30:411-6.
15. Kim NH, Hwang JH, Song KH, Choe PG, Park WB, Kim ES, et al. Changes in antimicrobial susceptibility of blood isolates in a university hospital in South Korea, 1998-2010. Infect Che- mother 2012;44:275-81.
16. Kang CI, Kim DM, Yi JY, Park WB, Lee KD, Kim HB, et al. Antimicrobial susceptibility of es- cherichia coli and Klebsiella pneumoniae blood isolates over 5 years:Influence of extended-spec- trum Beta-Lactamase-Producing organisms. Infect Chemother 2003;35:365-9.
17. Karlowsky JA, Jones ME, Thornsberry C, Fried- land IR, Sahm DF. Trends in antimicrobial sus- ceptibilities among Enterobacteriaceae isolated from hospitalized patients in the United States from 1998 to 2001. Antimicrob Agents Chemo- ther 2003;47:1672-80.
18. Kim YJ, Chun HJ, Lee JW, Hong KW, Kim SI, Wie SH, et al. The changing patterns of anti- biotics usage in Korea during 1981-2008. Infect Chemother 2012;44:411-8.
19. Kim SH, Kim MK, Kim KS, Hahn HJ, Son IJ, Lee HS. The effects of the antimicrobial control program by electronic medical record system on the antimicrobial prescriptions. J Kor Soc Health- Syst Pharm 2010;27:271-80.