This is an Open Access article distributed under the terms of the Creative Commons Attribution Non-Commercial License (http://creativecommons.org/licenses/by-nc/3.0/) which permits unrestricted non-commercial use, distribution, and reproduction in any medium, provided the original work is properly cited.
© 2015 The Korean Society of Clinical Nutrition Clin Nutr Res 2015;4:242-249
http://dx.doi.org/10.7762/cnr.2015.4.4.242 pISSN 2287-3732 ∙ eISSN 2287-3740
*Corresponding author Soon-Kyung Kim
Address Department of Food Sciences & Nutrition, Soonchunhyang University, 22 Soonchunhyang-ro, Sinchang-myeon, Asan 31538, Korea
Tel +82-41-530-1261 Fax +82-41-530-1264 E-mail [email protected]
Received September 30, 2015 Revised October 16, 2015 Accepted October 16, 2015
Introduction
The liver is one of the largest and most important organs in the body, and it plays a crucial role in the metabolism of nutrients. Liver dysfunction is usually associated with severe protein malnutrition and patients with severe liver cirrhosis ex- perience a severe catabolic state, in which fatty acids are used as a source of energy [1]. Hence many patients awaiting liver transplantation show various forms of nutritional deficiency, which increases the chance of occuring infection-related dis- eases after transplantation, increases mortality, and is associ- ated with a reduction in quality of life [2]. Liver transplantation is a pioneering method for treating unresectable liver cancer and, acute or chronic liver failure with a survival period of less than 1 year [3]. In 2013, a total of 1,186 liver transplants were performed in South Korea, and the 1-year survival rate after liver transplantation has been improved on annual basis. The
Evaluation of Malnutrition Risk after Liver Transplantation Using the Nutritional Screening Tools
Hee-Sook Lim
1,2, Hyung-Chul Kim
3, Yoon-Hyung Park
2, Soon-Kyung Kim
4*
1Department of Clinical Nutrition, Soonchunhyang University Bucheon Hospital, Bucheon 14584, Korea
2Department of Preventive Medicine, College of Medicine, Soonchunhyang University, Cheonan 31151, Korea
3Department of Surgery, College of Medicine, Soonchunhyang University Bucheon Hospital, Bucheon 14584, Korea
4Department of Food Sciences & Nutrition, Soonchunhyang University, Asan 31538, Korea
Malnutrition is a common problem in patients with end-stage liver disease requiring liver transplantation. The aim of this study was to evaluate nutritional status by using nutritional screening tools [Nutritional Risk Screening (NRS) 2002, Malnutrition Uni- versal Screening Tool (MUST) and Subjective Global Assessment (SGA)] in patients before and after liver transplantation. We analyzed medical record, blood test, nutrient intake and malnutrition rate just before transplantation and at discharge, and at 3, 6, 12 months after transplantation respectively. Initially 33 patients enrolled as study subjects and finally 28 patients completed the study. Nutrients intake such as energy, fiber, calcium, potassium, vitamin C, and folate were insufficient at 12 months after transplantation. The rates of malnutrition before transplantation were very high, reported at 81.8% for the NRS 2002, 87.9%
for the MUST, and 84.8% for the SGA. By 12 months after operation, malnutrition rates reported at NRS, MUST and SGA had decreased to 6.1%, 10.7%, and 10.7%, respectively. Sensitivity was 87.1% for the NRS 2002, 82.0% for the MUST, and 92.0%
for the SGA. Of these screening tools the SGA was the highest sensitive tool that predict the risk of mortality in malnutrition patients who received transplantation. Further studies on nutritional status of patients and proper tools for nutrition interven- tion are needed to provide adequate nutritional care for patients.
Key Words: Nutritional status, Liver transplantation, Mortality, Sensitivity, Specificity
1-year survival rate at 2013 was 76.9% for cadaveric donor liver transplantation (CDLT) and 88.6% for live donor liver transplantation (LDLT) [4]. It is anticipated that the demand for liver transplantation and the frequency of surgeries will be increased.
The nutritional deficiency rate in chronic liver disease pa- tients is approximately 65–100%, and in the recipients of liver transplants is 30–50% [5]. Among liver transplant patients, severe malnutrition group prior to transplantation are reported to require a larger volume of blood transfusion during surgery than well-nourished group and these patients are also likely to have an extended hospitalization period after transplanta- tion [6]. As a method of evaluating the nutritional status of patients waiting for liver transplants, the Subjective Global Assessment (SGA) has shown high reliability, and has also demonstrated a strong significant association with postopera- tive anthropometric indices [7]. Severe muscle depletion and malnutrition status before transplantation have been reported to be associated with 1-year postoperative mortality [8]. Thus, there have been various studies emphasizing the importance of improving nutritional conditions before and after liver transplantation surgery. Nevertheless, it is essential to assess the risk of malnutrition before seeking the way to improve patients’ nutritional conditions. Although there are several nutrition assessment tools currently in use in clinics and hos- pitals of South Korea and overseas, there have been almost no studies of liver transplant patients in Korea.
The present study was a prospective study in which vari- ous nutritional screening tools were applied before and after
surgery in liver transplant patients to compare diagnosis rate of malnutrition according to these nutritional screening tools and to verify the most useful tools in terms of correlation with mortality.
Materials and Methods
Patients
Patients who were awaiting a liver transplant at Soonchun- hyang University Hospital Bucheon and consented to the aims of the study were included as subjects. A total of 39 patients were initially recruited, but after the exclusion of 6 patients who refused to participate. Patients at the start of the study were 33 patients (23 males, 10 females). The total number of patients at the end of the study were 28 patients because 5 patients were expired in the middle of the study. Several investigations were conducted through individual interviews before transplantation, discharge after transplantation, and during follow-up visits as an outpatient at 3, 6, and 12 months after transplantation. The patients and guardians were educat- ed in methods of diet management. This study was approved by the Institutional Review Board of Soonchunhyang Univer- sity and all subjects provided written informed consent. Figure 1 displays a flow diagram of patient’s participation.
Clinicopathologic data
The subjects’ gender, age, and reason for liver transplan- tation were analyzed, and the type of liver transplant was classified as either LDLT or CDLT. In order to ascertain liver
Figure 1. Flow diagram of patient’s participation. LDLT: living donor liver transplantation, CDLT: cadaveric donor liver transplantation.
Pre op
Discharge
Postop 3 m
Postop 6 m
Postop 12 m
TOTAL (n) = 33
LDLT (n) = 12 CDLT (n) = 21
LDLT (n) = 12 CDLT (n) = 20
LDLT (n) = 12 CDLT (n) = 19
LDLT (n) = 10 CDLT (n) = 18
Drop out: expire (1)
Drop out: expire (1)
Drop out: expire (1) Drop out: expire (2)
transplantation urgency, patients were categorized as A, B, or C, according to the Child-Turcotte-Pugh (CTP) staging method [9], with the majority of patients waiting for a liver transplant belonging to class B or C. In addition, the Model for End- Stage Liver Disease (MELD) score, currently used by the United Network for Organ Sharing (UNOS) was calculated, with liver transplantation recommended for patients with scores of 16 points or more [10]. This score make clinicians distinguish pa- tients who are eligible for liver transplantation and is thought to minimize patient drop-out due to death while waiting for a transplant, while maximizing survival after transplantation.
The overall length of hospital stay and intensive care unit (ICU) stay was analyzed, and clinical data was investigated using medical records, based on the assessment of a surgeon.
Biochemical analysis
A total of 23 items were evaluated through blood tests to in- vestigate trends at different periods before or after transplan- tation, and these included hemoglobin (Hgb), hematocrit (Hct), white blood cell (WBC) count, lymphocytes, C-reactive protein (CRP), serum albumin, liver function tests, cholesterol, blood glucose, blood urea nitrogen (BUN), creatinine (Cr), magnesium (Mg), sodium (Na), potassium (K), and chloride (Cl).
Nutrient intake survey
In order to evaluate nutrient intake, 3-day food records were conducted and analyzed using the computer-aided nutritional analysis program (CAN-Pro 3.0; Korean Nutrition Society, Seoul, Korea).
Nutritional status assessment
Three different screening tools for malnutrition were used in this study. The Nutritional Risk Screening (NRS) 2002, con- ceived in Europe, identifies a nutritional risk group with a score of 3 points or greater in a scored assessment. It is unique for including disease severity as a component of the nutritional screening index [11]. The Malnutrition Universal Screening Tool (MUST) provides scores for body mass index (BMI), percentage body weight loss, and acute or chronic disease. It is divided into 3 stages, with patients with scores of 2 points or higher classified as the high-risk group [12], and relatively quick and easy screening tool. The SGA is a subjective nutritional assess- ment method [13] that has been used in numerous studies.
This tool also categorizes patients into one of three stages by considering patients' body weight changes and metabolic de-
mands.
Statistical analysis
Statistical analyses were performed using R 3.1.3 version freely available on the web (http://cran.r-project.org/) and SPSS (version 18.0; SPSS, Inc, Chicago, IL, USA). All data were reported as mean ± standard deviation or as number and percentage. In order to identify the diagnostic power of nutri- tional tools before transplantation in predicting the mortality of liver transplant patients at 12 months postoperation, the sensitivity, specificity, negative predictive values, and positive predictive values were calculated for each nutritional index, and 95% confidence intervals were presented.
Table 1. Clinicopathologic characteristics of patients Total (n = 33)
Age, years 47.2 ± 10.3*
Gender, n (%)
Male 23 (69.7)†
Female 10 (30.3)
Diagnosis, n (%)
HCC 6 (18.2)
LC 18 (54.5)
ALC 6 (18.2)
Hepatitis 2 (6.1)
Caroli 1 (3.0)
Type of transplant, n (%)
LDLT 12 (36.4)
CDLT 21 (63.6)
Child-Pugh stage, n (%)
A 5 (15.2)
B 4 (12.1)
C 24 (72.7)
MELD score 20.2 ± 10.9
Length of ICU stay, days 4.8 ± 4.5
Duration of hospitalization (Total), days 18.3 ± 15.8 HCC: hepatocellular carcinoma, LC: liver cirrhosis, ALC: alcholic liver cirrho- sis, HF: hepatic failure, Caroli: caroli syndrome, LDLT: living donor liver trans- plantation, CDLT: cadaveric donor liver transplantation, MELD: The model for end-stage liver disease score, ICU: intensive care unit.
*Data expressed as mean ± standard deviation; †Data expressed as number (%).
Results
Clinicopathologic characteristics
An average age of the subjects were 47.2 years. There were 23 males (69.7%) and 10 females (30.3%). The major diagno- ses were hepatocellular cancer (18.2%), liver cirrhosis (54.5%), alcoholic liver cirrhosis (18.2%), hepatitis (6.1%), and Caroli (3.0%). In type of transplant, 63.6% were CDLT and 36.4%
were LDLT. According to the CTP classification, 84.8% of pa- tients belonged to class B or C, while the average MELD score of 20.2 showed that these subjects were suitable candidates
for liver transplantation. The average ICU stay was 4.8 days, and the average hospital stay was 18.3 days (Table 1).
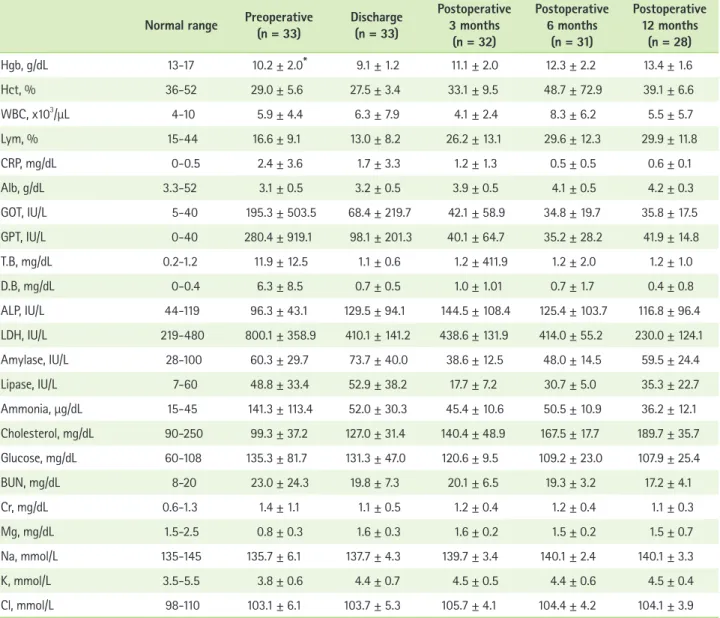
Change of biochemical data
The results of blood test at pre-transplantation in patients with hepatic failure were very abnormal and unstable. Com- pared to the normal range, liver function and infection-related values were high before transplantation, while anemia-related values and albumin were low. Biochemical indices which have values in normal range before transplantation were WBC
Table 2. Change of biochemical data before and after transplantation Normal range Preoperative
(n = 33) Discharge (n = 33)
Postoperative 3 months
(n = 32)
Postoperative 6 months
(n = 31)
Postoperative 12 months
(n = 28)
Hgb, g/dL 13-17 10.2 ± 2.0* 9.1 ± 1.2 11.1 ± 2.0 12.3 ± 2.2 13.4 ± 1.6
Hct, % 36-52 29.0 ± 5.6 27.5 ± 3.4 33.1 ± 9.5 48.7 ± 72.9 39.1 ± 6.6
WBC, x103/µL 4-10 5.9 ± 4.4 6.3 ± 7.9 4.1 ± 2.4 8.3 ± 6.2 5.5 ± 5.7
Lym, % 15-44 16.6 ± 9.1 13.0 ± 8.2 26.2 ± 13.1 29.6 ± 12.3 29.9 ± 11.8
CRP, mg/dL 0-0.5 2.4 ± 3.6 1.7 ± 3.3 1.2 ± 1.3 0.5 ± 0.5 0.6 ± 0.1
Alb, g/dL 3.3-52 3.1 ± 0.5 3.2 ± 0.5 3.9 ± 0.5 4.1 ± 0.5 4.2 ± 0.3
GOT, IU/L 5-40 195.3 ± 503.5 68.4 ± 219.7 42.1 ± 58.9 34.8 ± 19.7 35.8 ± 17.5
GPT, IU/L 0-40 280.4 ± 919.1 98.1 ± 201.3 40.1 ± 64.7 35.2 ± 28.2 41.9 ± 14.8
T.B, mg/dL 0.2-1.2 11.9 ± 12.5 1.1 ± 0.6 1.2 ± 411.9 1.2 ± 2.0 1.2 ± 1.0
D.B, mg/dL 0-0.4 6.3 ± 8.5 0.7 ± 0.5 1.0 ± 1.01 0.7 ± 1.7 0.4 ± 0.8
ALP, IU/L 44-119 96.3 ± 43.1 129.5 ± 94.1 144.5 ± 108.4 125.4 ± 103.7 116.8 ± 96.4
LDH, IU/L 219-480 800.1 ± 358.9 410.1 ± 141.2 438.6 ± 131.9 414.0 ± 55.2 230.0 ± 124.1
Amylase, IU/L 28-100 60.3 ± 29.7 73.7 ± 40.0 38.6 ± 12.5 48.0 ± 14.5 59.5 ± 24.4
Lipase, IU/L 7-60 48.8 ± 33.4 52.9 ± 38.2 17.7 ± 7.2 30.7 ± 5.0 35.3 ± 22.7
Ammonia, μg/dL 15-45 141.3 ± 113.4 52.0 ± 30.3 45.4 ± 10.6 50.5 ± 10.9 36.2 ± 12.1
Cholesterol, mg/dL 90-250 99.3 ± 37.2 127.0 ± 31.4 140.4 ± 48.9 167.5 ± 17.7 189.7 ± 35.7
Glucose, mg/dL 60-108 135.3 ± 81.7 131.3 ± 47.0 120.6 ± 9.5 109.2 ± 23.0 107.9 ± 25.4
BUN, mg/dL 8-20 23.0 ± 24.3 19.8 ± 7.3 20.1 ± 6.5 19.3 ± 3.2 17.2 ± 4.1
Cr, mg/dL 0.6-1.3 1.4 ± 1.1 1.1 ± 0.5 1.2 ± 0.4 1.2 ± 0.4 1.1 ± 0.3
Mg, mg/dL 1.5-2.5 0.8 ± 0.3 1.6 ± 0.3 1.6 ± 0.2 1.5 ± 0.2 1.5 ± 0.7
Na, mmol/L 135-145 135.7 ± 6.1 137.7 ± 4.3 139.7 ± 3.4 140.1 ± 2.4 140.1 ± 3.3
K, mmol/L 3.5-5.5 3.8 ± 0.6 4.4 ± 0.7 4.5 ± 0.5 4.4 ± 0.6 4.5 ± 0.4
Cl, mmol/L 98-110 103.1 ± 6.1 103.7 ± 5.3 105.7 ± 4.1 104.4 ± 4.2 104.1 ± 3.9
Hgb: hemoglobin, Hct: hematocrit, WBC: white blood cell, Lym: lymphocyte, CRP: c-reactive protein, Alb: albumin, GOT: glutamic-oxaloacetic transaminase, GPT:
glutamic-pyruvate transaminase, T.B: total bilirubin, D.B: direct bilirubin, ALP: alkaline phosphatase, LDH: lactate dehydrogenase, BUN: blood urea nitrogen, Cr:
creatinine, Mg: magnesium, Na: sodium, K: potassuum, Cl: chloride.
*Data expressed as mean ± standard deviation.
count, lymphocytes, amylase, lipase, cholesterol, Na, K, and Cl.
Upon discharge after transplantation, total bilirubin, LDH, BUN, and Mg values were normal. By 3 months postoperation, albu- min, ammonia, and Cr values were within the normal range; at 6 months postoperation, Hct, CRP, GOT, and GPT were normal;
and at 12 months postoperation, Hgb, direct bilirubin, ALP, and glucose values were normal (Table 2).
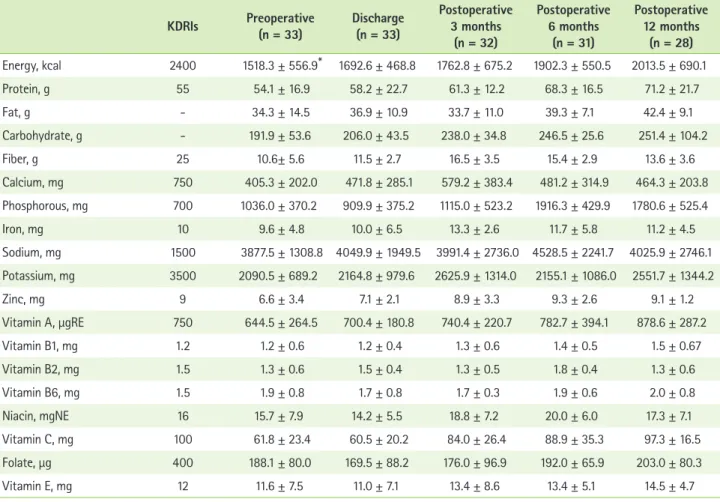
Change of nutrient intake
Analysis of nutrients intake are displayed in Table 3. By considering age and gender distribution of study participants patients' nutrient intake were assessed relative to the recom- mended nutritional allowances [14] for a 40–49-year-old male.
Upon discharge, intake of protein, iron, and vitamin B1 had exceeded the dietary reference; at 3 months postoperation, intake of niacin and vitamin E had returned to the level of in- take at preoperation; and at 6 months, intake of zinc, vitamin A,
and vitamin B2 had increased to the level of dietary reference.
However, energy, as well as fiber, calcium, potassium, vitamin C, and folate remained below the reference intake beyond the end of the investigation (Table 3).
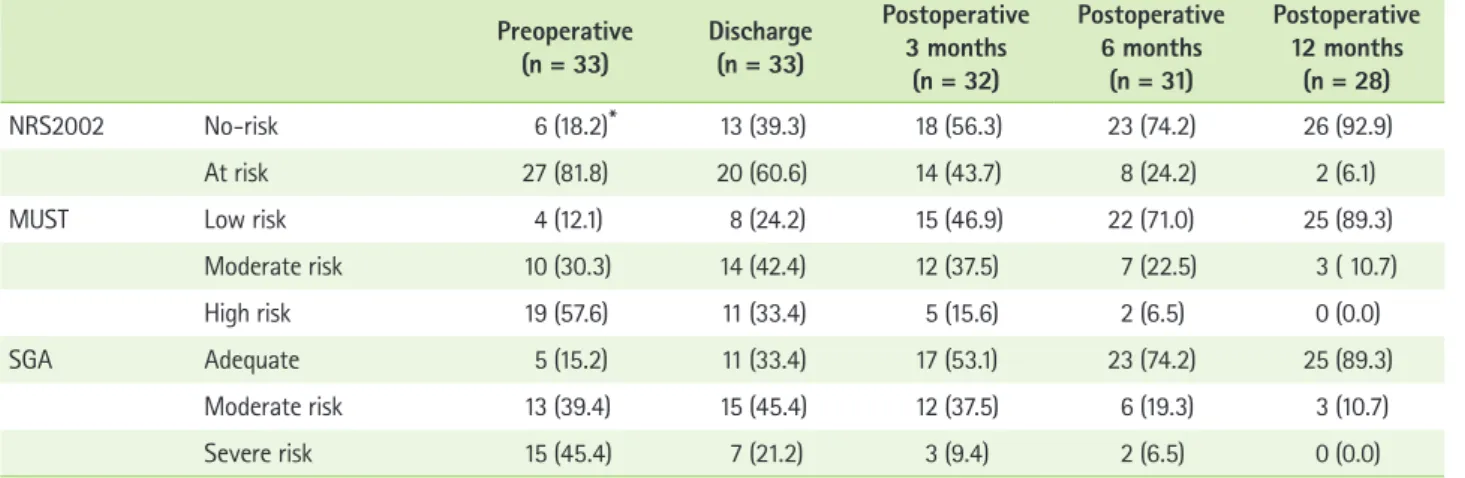
Prevalence of malnutrition according to the nutritional screening tools
Table 4 displays the results of the malnutrition assessments using nutritional screening tools. The rates of malnutrition be- fore transplantation were very high, reported at 81.8% for the NRS 2002, 87.9% for the MUST, and 84.8% for the SGA. Upon discharge after transplantation, the rates of malnutrition were still high, at 60.6%, 75.8%, and 66.6%, respectively, while these rates decreased to 43.7%, 53.1% and 46.9% at 3 month postoperation. By 6 months postoperation, malnutrition rates decreased to 24.4%, 29.0%, and 25.8% and, at 12 months postoperation, these rates further decreased to 6.1%, 10.7%,
Table 3. Change of nutrient intake of patients
KDRIs Preoperative
(n = 33) Discharge (n = 33)
Postoperative 3 months
(n = 32)
Postoperative 6 months
(n = 31)
Postoperative 12 months
(n = 28) Energy, kcal 2400 1518.3 ± 556.9* 1692.6 ± 468.8 1762.8 ± 675.2 1902.3 ± 550.5 2013.5 ± 690.1
Protein, g 55 54.1 ± 16.9 58.2 ± 22.7 61.3 ± 12.2 68.3 ± 16.5 71.2 ± 21.7
Fat, g - 34.3 ± 14.5 36.9 ± 10.9 33.7 ± 11.0 39.3 ± 7.1 42.4 ± 9.1
Carbohydrate, g - 191.9 ± 53.6 206.0 ± 43.5 238.0 ± 34.8 246.5 ± 25.6 251.4 ± 104.2
Fiber, g 25 10.6± 5.6 11.5 ± 2.7 16.5 ± 3.5 15.4 ± 2.9 13.6 ± 3.6
Calcium, mg 750 405.3 ± 202.0 471.8 ± 285.1 579.2 ± 383.4 481.2 ± 314.9 464.3 ± 203.8
Phosphorous, mg 700 1036.0 ± 370.2 909.9 ± 375.2 1115.0 ± 523.2 1916.3 ± 429.9 1780.6 ± 525.4
Iron, mg 10 9.6 ± 4.8 10.0 ± 6.5 13.3 ± 2.6 11.7 ± 5.8 11.2 ± 4.5
Sodium, mg 1500 3877.5 ± 1308.8 4049.9 ± 1949.5 3991.4 ± 2736.0 4528.5 ± 2241.7 4025.9 ± 2746.1 Potassium, mg 3500 2090.5 ± 689.2 2164.8 ± 979.6 2625.9 ± 1314.0 2155.1 ± 1086.0 2551.7 ± 1344.2
Zinc, mg 9 6.6 ± 3.4 7.1 ± 2.1 8.9 ± 3.3 9.3 ± 2.6 9.1 ± 1.2
Vitamin A, μgRE 750 644.5 ± 264.5 700.4 ± 180.8 740.4 ± 220.7 782.7 ± 394.1 878.6 ± 287.2
Vitamin B1, mg 1.2 1.2 ± 0.6 1.2 ± 0.4 1.3 ± 0.6 1.4 ± 0.5 1.5 ± 0.67
Vitamin B2, mg 1.5 1.3 ± 0.6 1.5 ± 0.4 1.3 ± 0.5 1.8 ± 0.4 1.3 ± 0.6
Vitamin B6, mg 1.5 1.9 ± 0.8 1.7 ± 0.8 1.7 ± 0.3 1.9 ± 0.6 2.0 ± 0.8
Niacin, mgNE 16 15.7 ± 7.9 14.2 ± 5.5 18.8 ± 7.2 20.0 ± 6.0 17.3 ± 7.1
Vitamin C, mg 100 61.8 ± 23.4 60.5 ± 20.2 84.0 ± 26.4 88.9 ± 35.3 97.3 ± 16.5
Folate, μg 400 188.1 ± 80.0 169.5 ± 88.2 176.0 ± 96.9 192.0 ± 65.9 203.0 ± 80.3
Vitamin E, mg 12 11.6 ± 7.5 11.0 ± 7.1 13.4 ± 8.6 13.4 ± 5.1 14.5 ± 4.7
KDRIs: dietary reference intakes for Koreans.
*Data expressed as mean ± standard deviation.
and 10.7%, respectively (Table 4).
Validity of the nutritional screening tools
In order to test the ability of the screening tools to predict death in patients at risk of malnutrition, sensitivity, specificity, and prediction accuracy of the screening tools were assessed.
Sensitivity, which is the proportion of correctly predicted deaths in a group of patients with malnutrition, was 87.1% for the NRS 2002, 82.0% for the MUST, and 92.0% for the SGA, while prediction accuracy was 83.3%, 78.8%, and 91.9%, respectively. The specificity was 74.4%, 61.4% and 79.5%, re- spectively (Table 5).
Discussion
In South Korea, 80% of the patients requiring liver trans- plants are the patients of liver cirrhosis. The majority are male, and recent changes in perception toward liver transplantation have led a gradual increase in LDLT [4]. The clinical conditions
of the participants in the current study showed similar pat- terns with overall domestic trends. The level of most biochem- ical indices in blood test were improved to the normal level after transplantation, while a recovery of liver function will take a long time. Nevertheless, close observation and active treatment are required to ensure early recovery of anemia and to maintain normal blood glucose after liver transplantation.
Nutritional assessment and care before and after liver trans- plantation are very important aspects of treatment. Before transplantation, the majority of patients accompany various complications, including cachexia, ascites, and esophageal varices, and these complication should be considered for patients' menu plan [15]. After transplantation, adequate nu- trients intake is important for the rapid recovery and regrowth of hepatocytes, and additional nutrition care is recommended for preventing obesity and adverse effects of transplantation [16]. Although a large number of patients showed an increase in nutritional intake due to increased appetite and consump- tion amount, long-term intake of energy, fiber, calcium, potas- Table 4. Prevalence of malnutrition according to the nutritional screening tools
Preoperative
(n = 33) Discharge (n = 33)
Postoperative 3 months
(n = 32)
Postoperative 6 months
(n = 31)
Postoperative 12 months
(n = 28)
NRS2002 No-risk 6 (18.2)* 13 (39.3) 18 (56.3) 23 (74.2) 26 (92.9)
At risk 27 (81.8) 20 (60.6) 14 (43.7) 8 (24.2) 2 (6.1)
MUST Low risk 4 (12.1) 8 (24.2) 15 (46.9) 22 (71.0) 25 (89.3)
Moderate risk 10 (30.3) 14 (42.4) 12 (37.5) 7 (22.5) 3 ( 10.7)
High risk 19 (57.6) 11 (33.4) 5 (15.6) 2 (6.5) 0 (0.0)
SGA Adequate 5 (15.2) 11 (33.4) 17 (53.1) 23 (74.2) 25 (89.3)
Moderate risk 13 (39.4) 15 (45.4) 12 (37.5) 6 (19.3) 3 (10.7)
Severe risk 15 (45.4) 7 (21.2) 3 (9.4) 2 (6.5) 0 (0.0)
NRS 2002: nutritional risk screening 2002, MUST: malnutrition universal screening tool, SGA: subjective global assessment.
*Data expressed as number (%).
Table 5. Diagnostic value for the nutritional screening tools relative to subjects' mortality at 12 months after liver transplantation
Sensitivity Specificity Accuracy PPV NPV
Preop. NRS2002 87.1 (75.9-99.0)*,† 74.4 (71.3-91.6) 83.3 (68.0-92.8) 80.5 (71.1-95.6) 71.2 (78.1-85.0) Preop. MUST 82.0 (70.4-88.5) 61.4 (66.1-90.0) 78.8 (60.7-89.1) 82.6 (66.1-99.8) 76.0 (68.4-90.5) Preop. SGA 92.0 (82.4-100.0) 79.5 (70.9-96.7) 91.9 (70.8-98.9) 88.0 (78.7-94.7) 79.0 (72.7-93.0)
*95% confidence intervals were calculated using Wilson's method.
NRS 2002: nutritional risk screening 2002, MUST: malnutrition universal screening tool, SGA: subjective global assessment, PPV: positive predictive value, NPV:
negative predictive value.
†Data expressed as percentage.
sium, vitamin C, and folate were insufficient to recover their health status implicating that dietary guidance is required for balanced nutrition in their diet. Insufficient nutrient intake after transplantation is known to cause a negative energy balance, and nutritional interventions with nutritionally well- balanced diet before and after transplantation help to improve nutritional status [17,18].
Several studies have assessed the nutritional status of pa- tients before and after liver transplantation. Because there is still no gold standard for nutritional assessment in patients with terminal hepatic failure, a large number of studies still use anthropometric values, or serum markers such as serum albu- min, prealbumin, and transferrin [9,19]. Ha and Choi-Kwon [20]
reported that an average malnutrition rate of patients were 51.5% immediately after liver transplantation, which is slightly different from the results of the present study. While nutri- tional status improves with an increased survival period after surgery, multifaceted studies are required to minimize the rate of malnutrition. Previously comparative studies of malnutrition rates using different assessment tools were conducted for patients with gastric cancer [21] or elderly [22]. In the present study relatively good results were demonstrated with all three nutritional screening tools in terms of sensitivity and accuracy.
Of these three tools, the SGA showed the highest predictive power. This is similar to the results of Naveau et al. [23] on patients with chronic liver disease, in which the SGA showed a sensitivity of 96.0%. Our study has some limitations. The number of subjects were too small and the 95% confidence intervals were relatively broad. So, it is difficult to generalize the results. But, this study is valuable because studies on nu- tritional status for liver transplant patients in South Korea are very rare, and the authors were able to analyze trends in nu- tritional intake during the survival period after transplantation and to conduct a professional nutritional assessment.
Conclusion
The malnutrition rate of patients in waiting liver transplants is very high. While survival period of post-transplantation is increased the patients still suffer from malnutrition after transplantation. Moreover, the patients' nutritional status re- mains inadequate for long time after transplantation. Among the nutritional assessment tools we examined, the SGA had the highest sensitivity and accuracy. Proper nutritional as- sessment and intervention are difficult for patients with ter- minal hepatic failure, but the nutrition care is still important
and helpful in the treatment of patients who underwent liver transplantation. Hence, a team approach with physicians and dietitians is required to ensure that nutritional support is not delayed, and the accurate nutritional screening tools are used.
In the future, long-term studies with larger numbers of par- ticipants will be needed to elucidate these issues.
Acknowledgment
This work was supported by the Soonchunhyang University Research Fund.
Conflict of interest
We declare that we have no conflict of interest.
ORCID
Hee-Sook Lim http://orcid.org/0000-0003-0745-8906
References
1. Hammad A, Kaido T, Uemoto S. Perioperative nutritional therapy in liver transplantation. Surg Today 2015;45:271-83.
2. Urano E, Yamanaka-Okumura H, Teramoto A, Sugihara K, Morine Y, Imura S, Utsunomiya T, Shimada M, Takeda E. Pre- and postoperative nutritional assessment and health-related quality of life in recipients of living donor liver transplantation. Hepatol Res 2014;44:1102-9.
3. Stickel F, Inderbitzin D, Candinas D. Role of nutrition in liver transplan- tation for end-stage chronic liver disease. Nutr Rev 2008;66:47-54.
4. Korean Network for Organ Sharing (KNOS). 2013 Annual report of transplant. Seoul: Korean Network for Organ Sharing; 2014.
5. Merli M, Giusto M, Gentili F, Novelli G, Ferretti G, Riggio O, Corradini SG, Siciliano M, Farcomeni A, Attili AF, Berloco P, Rossi M. Nutritional status: its influence on the outcome of patients undergoing liver trans- plantation. Liver Int 2010;30:208-14.
6. Ricci P, Therneau TM, Malinchoc M, Benson JT, Petz JL, Klintmalm GB, Crippin JS, Wiesner RH, Steers JL, Rakela J, Starzl TE, Dickson ER. A prognostic model for the outcome of liver transplantation in patients with cholestatic liver disease. Hepatology 1997;25:672-7.
7. Stephenson GR, Moretti EW, El-Moalem H, Clavien PA, Tuttle-Newhall JE. Malnutrition in liver transplant patients: preoperative subjective global assessment is predictive of outcome after liver transplantation.
Transplantation 2001;72:666-70.
8. de Carvalho L, Parise ER, Samuel D. Factors associated with nutritional status in liver transplant patients who survived the first year after transplantation. J Gastroenterol Hepatol 2010;25:391-6.
9. Yovita H, Djumhana A, Abdurachman SA, Saketi JR. Correlation be- tween anthropometrics measurements, prealbumin level and transferin serum with Child-Pugh classification in evaluating nutritional status of liver cirrhosis patient. Acta Med Indones 2004;36:197-201.
10. Habib S, Berk B, Chang CC, Demetris AJ, Fontes P, Dvorchik I, Eghtesad B, Marcos A, Shakil AO. MELD and prediction of post-liver transplantation survival. Liver Transpl 2006;12:440-7.
11. Kondrup J, Allison SP, Elia M, Vellas B, Plauth M; Educational and Clini- cal Practice Committee, European Society of Parenteral and Enteral
Nutrition (ESPEN). ESPEN guidelines for nutrition screening 2002. Clin Nutr 2003;22:415-21.
12. Stratton RJ, Hackston A, Longmore D, Dixon R, Price S, Stroud M, King C, Elia M. Malnutrition in hospital outpatients and inpatients: preva- lence, concurrent validity and ease of use of the ‘malnutrition universal screening tool’ (‘MUST’) for adults. Br J Nutr 2004;92:799-808.
13. Detsky AS, McLaughlin JR, Baker JP, Johnston N, Whittaker S, Mendel- son RA, Jeejeebhoy KN. What is subjective global assessment of nutri- tional status? JPEN J Parenter Enteral Nutr 1987;11:8-13.
14. The Korean Nutrition Society. Dietary reference intakes for Koreans 2010 [Internet]. Seoul: The Korean Nutrition Society; 2010 [cited 2015 Sep 10]. Available from: http://www.kns.or.kr/Download/2010KDRIs_
open_final.pdf.
15. Bianchi G, Marzocchi R, Lorusso C, Ridolfi V, Marchesini G. Nutritional treatment of chronic liver failure. Hepatol Res 2008;38 Suppl 1:S93-101.
16. Cabré E, Gassull MA. Nutritional and metabolic issues in cirrhosis and liver transplantation. Curr Opin Clin Nutr Metab Care 2000;3:345-54.
17. Patton KM, Aranda-Michel J. Nutritional aspects in liver disease and liver transplantation. Nutr Clin Pract 2002;17:332-40.
18. Yoshida R, Yagi T, Sadamori H, Matsuda H, Shinoura S, Umeda Y, Sato D, Utsumi M, Nagasaka T, Okazaki N, Date A, Noguchi A, Tanaka A,
Hasegawa Y, Sakamoto Y, Fujiwara T. Branched-chain amino acid- enriched nutrients improve nutritional and metabolic abnormalities in the early post-transplant period after living donor liver transplantation.
J Hepatobiliary Pancreat Sci 2012;19:438-48.
19. Yosry A, Omran D, Said M, Fouad W, Fekry O. Impact of nutritional sta- tus of Egyptian patients with end-stage liver disease on their outcomes after living donor liver transplantation. J Dig Dis 2014;15:321-6.
20. Ha JS, Choi-Kwon SM. The effect of the immediate postoperative nutri- tional status in liver transplant recipients in SICU on clinical outcome. J Korean Biol Nurs Sci 2013;15:193-201.
21. Gavazzi C, Colatruglio S, Sironi A, Mazzaferro V, Miceli R. Importance of early nutritional screening in patients with gastric cancer. Br J Nutr 2011;106:1773-8.
22. Durán Alert P, Milà Villarroel R, Formiga F, Virgili Casas N, Vilarasau Farré C. Assessing risk screening methods of malnutrition in geriatric patients: Mini Nutritional Assessment (MNA) versus Geriatric Nutri- tional Risk Index (GNRI). Nutr Hosp 2012;27:590-8.
23. Naveau S, Belda E, Borotto E, Genuist F, Chaput JC. Comparison of clini- cal judgment and anthropometric parameters for evaluating nutritional status in patients with alcoholic liver disease. J Hepatol 1995;23:234-5.