Introduction
Kidney transplantation is the most common solid organ transplant procedure. According to annual report of the transplant 2011 by Korean Network for Organ Sharing (KNOS), the number of patients receiving kidney transplantation was 11,367, which was 55.1% of 20,662 solid organ transplanta- tions [1]. Kidney transplantation shows better effect on cost and quality of life (QOL) of kidney transplant recipients (KTRs) than dialysis [2,3].
The survival rate after kidney transplantation has rapidly im- proved with the development in technique of transplantation and immunosuppressive agents [4]. However, many KTRs still suffer from chronic allograft nephropathy and cardiovascular disease (CVD) and it was reported that several obesity related
Clin Nutr Res 2013;2:1-11
http://dx.doi.org/10.7762/cnr.2013.2.1.1 pISSN 2287-3732 ∙ eISSN 2287-3740
Evaluation of Nutrient Intake in Early Post Kidney Transplant Recipients
Mi Ra Rho
1, Jeong Hyun Lim
1, Jung Hwa Park
1, Seung Seok Han
2, Yon Su Kim
2, Young Hee Lee
1, Won Gyoung Kim
1*
1Department of Food Service and Nutritional Care, Seoul National University Hospital, Seoul 110-744, Korea
2Department of Internal Medicine, Seoul National University College of Medicine, Seoul 110-744, Korea
The purpose of our study was to evaluate the dietary intake of kidney transplant recipients (KTRs) and assess oral intake related nutrition problems. Fifty patients who had undergone kidney transplantation were included: 24 males, 26 females. The mean age was 46.8 ± 11.2 years, height was 161.3 ± 8.3 cm, and body weight was 60.5 ± 8.7 kg. We conducted nutrition education based on the diet guideline for KTRs (energy 32 kcal/kg of ideal body weight [IBW], protein 1.3 g/kg of IBW) and neutropenic diet guideline before discharge. Dietary intake of the patients at 1 month after transplantation was investigated by 3-day food records. Body weight and laboratory values for nutritional status and graft function were also collected. Body weight was significantly decreased from admission to discharge. Body weight from discharge to 1 month and 3 months after transplanta- tion was increased but was not significant. Biochemical measurements were generally improved but the number of patients with hypophosphatemia increased. The daily dietary intake of energy and protein was adequate (33.1 kcal/kg, 1.5 g/kg, respec- tively). However, the dietary intake of calcium, folate, and vitamin C did not meet the Korean Recommended Nutrient Intake of vitamins and minerals (86.8%, 62.4%, and 88.0%, respectively). Patients with low intake of calcium, folate, and vitamin C presented low intake in milk and dairy products, vegetables, and fruits, and these foods were related to restricted food items in neutropenic diet. More attention should be paid on improving quality of diet, and reconsideration of present neutropenic diet guideline is necessary. These results can be used to establish evidence-based medical nutrition therapy guideline for KTRs.
Key Words: Kidney transplant recipients, Oral intake, Medical nutrition therapy guideline
*Corresponding author Won Gyoung Kim
Address Department of Food Service and Nutritional Care, Seoul National University Hospital, 101 Daehak-ro, Jongno-gu, Seoul 110- 744, Korea Tel +82-2-2072-3202 Fax +82-2-764-3480
E-mail [email protected] Received November 28, 2012 Revised December 21, 2012 Accepted December 27, 2012
This is an Open Access article distributed under the terms of the Creative Commons Attribution Non-Commercial License (http://creativecommons.org/licenses/by-nc/3.0/) which permits unrestricted non-commercial use, distribution, and reproduction in any medium, provided the original work is properly cited.
© 2013 The Korean Society of Clinical Nutrition
disorders such as insulin resistance, dyslipidemia, hypertension, and hyperuricemia played a crucial role in such conditions [5-7].
Researches recommended management of obesity including lifestyle modification for the control of these metabolic disor- ders and CVD [7,8]. It was also reported that diet intervention plays an important role in management of body weight and lipid profile [9].
In general, obesity is thought to be related to overnutrition, but the nutrition problems of KTRs are not always related to overnutrition. Since KTRs have followed many diet restrictions for a long time before transplantation, many of them can experience nutrition problems related to undernutrition. The major nutritional goal for KTRs should be to treat preexist- ing undernutrition and prevent excessive weight gain. Several reports presented diet guidelines for KTRs [7, 10-12]. They sug- gested two-step (early post-transplant period and late post- transplant) recommendation of energy (30-35 kcal/kg, 25-30 kcal/kg, respectively) and protein (1.3-2.0 g/kg, 0.8-1.2 g/kg, respectively) for KTRs. In addition, sodium, potassium, phos- phorus and fluid are not subjected to the restriction unless KTRs showed abnormal findings in their clinical signs.
Although lots of studies have reported the importance of diet for the management of KTRs, there is limited data on the diet and nutrition related problems of KTRs in Koreans. The purpose of our study was to evaluate the dietary intake of KTRs and assess oral intake related nutrition problems. The study results will show baseline data to establish guideline for medical nutrition therapy after kidney transplantation.
Materials and Methods
Subjects
Fifty-two patients aged 20 years and older who had under- gone successful kidney transplantation from September 2009 to August 2010 participated in this study. All subjects were referred to dietitians for nutrition education before discharge.
A skilled dietitian conducted nutrition education based on the diet guideline for KTRs (energy 32 kcal/kg of ideal body weight [IBW], protein 1.3 g/kg of IBW) [11] and neutropenic diet guide- line for patients using immunosuppressive therapy after trans- plantation (food safety guideline and restrictions in raw or uncooked foods) [13]. Patients were also instructed how to log 3-day food records. Fifty subjects completed 3-day records were included for the analyses. Written informed consent was obtained from all patients. The study was approved by the In-
stitutional Review Board (IRB) at the Seoul National University Hospital, Seoul, Korea (No. H-0906-037-283) and was carried out according to the policies of the IRB.
Survey content and method General characteristics
We collected age, gender, day of operation, and pre-trans- plant dialysis status from electric medical record (EMR).
Anthropometric, biochemical measurements, and clinical data Body weight at admission, discharge, 1 month and 3 months after operation, and height were obtained from EMR.
To monitor changes of nutritional status and graft function, we reviewed EMR and collected total cholesterol, total protein, albumin, uric acid, blood urea nitrogen, creatinine, calcium, phosphorus, potassium, hemoglobin, total lymphocyte and ab- solute neutrophile count (ANC) values at admission, 1 month and 3 months after kidney transplantation.
Dietary intake analysis
Dietary intake of the patients after discharge was investi- gated by 3-day food records. The patients were instructed to record food items they ate for 3 days over 2 weekdays and 1 weekend day and asked to return the 3-day food records at 1 month after transplantation. Patients were encouraged to provide as much detail as possible. To improve the accuracy of the dietary data, each record was evaluated by a skilled dietitian for completeness and accuracy with patients being asked to provide additional information about unclear food items and amounts. We used the CAN-Pro (Ver. 3.0) developed by the Korean Nutrition Society to analyze average daily nu- trient intake. We compared daily nutrient intakes of patients with recommended intake for energy (32 kcal/kg of IBW) and protein (1.3 g/kg of IBW) and Korean Recommended Nutrient Intake (KRNI) for vitamins and minerals [14].
Statistical analysis
All statistical analyses were performed using SPSS version 19.0 and the results were expressed as means with standard deviation (SD) for continuous variables and as numbers and proportions for categorical variables. To compare variables, student’s t-test and paired t-tests were used. Generalized linear model (GLM) was used to analyze food intake accord- ing to nutrient intake levels and Duncan’s multiple range test was used to verify the significance of difference. The relation-
ship between body weight change and nutrient intake was presented with Pearson’s correlation coefficient. The level of statistical significance was defined as p < 0.05.
Results
General characteristics
General characteristics of the patients are given in Table 1.
The average age of the patients was 46.8 years old (range, 22 to 69 years). The mean body mass index (BMI) was 23.2 kg/
m2 and the BMI ranged from 18.1 to 29.4 kg/m2. The number of patients with BMI under 18.5 kg/m2 was 4 (2.0%), and that over 25 kg/m2 was 12 (24.0%). Percentage of the patients who had undergone dialysis before transplantation was 76.0%
(hemodialysis, 54.0%; peritoneal dialysis, 22.0%) and 24.0% of the patients did not receive dialysis before transplantation.
Changes in anthropometric and biochemical measurements The body weight and BMI at discharge, 1 month and 3 months after transplantation significantly decreased com- pared to those at admission. The mean weight loss between admission and discharge was 4 kg. The mean weight gain from discharge to 1 month and 3 months after transplantation was 0.4 kg and 1.0 kg, respectively, and there was no significant
difference (Figure 1).
Changes in biochemical measurements are shown in Table 2. Most of the indicators showing nutrition status and graft function showed significant differences between values at admission and 1 month and 3 months after transplantation (p
< 0.05). The mean values of BUN, creatinine, phosphorus, and
Table 1. General characteristics of the subjects
Men (n = 24) Women (n = 26) Total (n = 50)
Age, yr (min, max) 45.8 ± 12.7 (22, 66) 47.7 ± 9.8 (26, 69) 46.8 ± 11.2 (22, 69)
< 30, n (%) 3 (12.5) 1 (3.8) 4 (8.0)
30-39, n (%) 5 (20.8) 5 (19.2) 10 (20.0)
40-49, n (%) 7 (29.2) 8 (30.8) 15 (30.0)
50-59, n (%) 4 (16.7) 10 (38.5) 14 (28.0)
≥ 60, n (%) 5 (20.8) 2 (7.7) 7 (14.0)
Height, cm 167.7 ± 6.4 155.3 ± 4.6 161.3 ± 8.3
Weight, kg 65.1 ± 7.6 56.3 ± 7.5 60.5 ± 8.7
Percentage of IBW, % (min, max) 105.0 ± 9.5 (82, 121) 111.1 ± 13.8 (92, 140) 108.2 ± 12.2 (82, 140) BMI, kg/m2 (min, max) 23.1 ± 2.1 (18.1, 26.7) 23.3 ± 2.9 (19.3, 29.4) 23.2 ± 2.5 (18.1, 29.4) Length of hospital stay, day (min, max) 18.4 ± 3.1 (14, 26) 22.1 ± 9.5 (14, 44) 20.3 ± 7.3 (14, 44) Renal replacement, n (%)
Hemodialysis 13 (54.2) 14 (53.8) 27 (54.0)
Peritoneal dialysis 4 (16.7) 7 (26.9) 11 (22.0)
None 7 (29.2) 5 (19.2) 12 (24.0)
IBW: ideal body weight (height in meters squared multiplied 22 for male; height in meters squared multiplied 21 for female), BMI: body mass index.
Values are presented as mean ± standard deviation (min, max) or number (%).
65.0 35.0
30.0
25.0
20.0
15.0 60.5
23.2 21.7* 21.7† 22.1‡
56.5* 56.8† 57.5‡
60.0
55.0
50.0
Admission
Body weight, kg BMI, kg/m2
Discharge 1 month
after KTPL 3 months after KTPL
BMI Weight
Figure 1. Changes of body weight and body mass index after kidney transplantation. KTPL: kidney transplantation, BMI: body mass index. *Values are significantly different between admission and discharge at p < 0.05 by paired t-test;
†Values are significantly different between admission and 1 month after KTPL at p < 0.05 by paired t-test; ‡Values are significantly different between admission and 3 months after KTPL at p < 0.05 by paired t-test.
potassium were within normal limits at 1 month after trans- plantation. The ranges of BUN, creatinine, phosphorus, and potassium at this time were 8-46 mg/dL, 0.6-4.6 mg/dL, 1.2- 5.4 mg/dL, 3.2-5.9 mg/dL, respectively, but 28.0% of patients showed lower level than normal limits in phosphorus.
Nutrient intake analysis
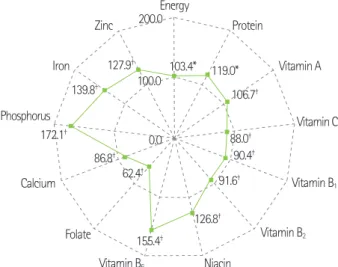
The daily nutrient intake of the patients at the first month after kidney transplantation is presented in Table 3. The ra- tio of carbohydrate, protein, and fat to total energy was 53.5:18.7:28.2. The average energy intake was 1855.5 ± 457.4 kcal/day, which was 33.1 ± 7.7 kcal/kg/day and 103.4% of recommended energy intake. The mean intake of protein was 86.6 ± 23.4 g/day, which was 1.5 ± 0.4 g/kg/day and 119% of
recommended protein intake. When we compared the vitamin and mineral intakes to KRNI, the intake levels of vitamin C (88.0%), folate (62.4%), and calcium (86.8%) were under 90%
of KRNI (Figure 2). Especially, in the case of folate the percent- age of patients whose folate intake level was less than 75% of KRNI was 76.0% (Figure 3).
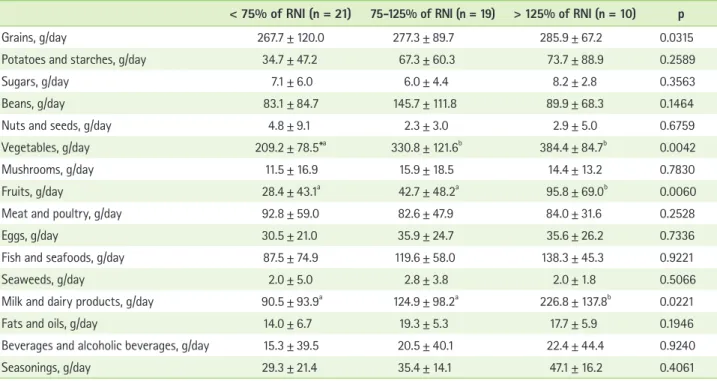
To investigate food contributing the intake of vitamin C, folate, and calcium, we divided the patients into 3 groups according to their relative intake to RNI (< 75% of RNI, 75- 125% of RNI, and > 125% of RNI) and analyzed the mean food intake by each food group. In the case of vitamin C, the lowest intake group showed significantly lower intakes of ce- reals, vegetables, fruits, and milk than the other groups (Table 4). The lowest folate intake group also presented significantly Table 2. Changes in biochemical measurements of the subjects after kidney transplantation
Reference range Admission 1 month after KTPL 3 months after KTPL
Total protein, g/dL 6.0-8.0 6.7 ± 0.8 6.9 ± 0.4 7.1 ± 0.4†
Serum albumin, g/dL 3.3-5.2 3.8 ± 0.5 4.2 ± 0.3* 4.4 ± 0.3†,‡
Total cholesterol, mg/dL 0-240 157.8 ± 34.3 190.0 ± 41.8* 176.5 ± 36.2†,‡
Hemoglobin, g/dL 12-16 10.7 ± 1.7 11.6 ± 1.4* 12.3 ± 1.3†,‡
TLC, /mm3 > 1500 1462.6 ± 606.2 2023.4 ± 728.9* 1902.9 ± 563.9†
ANC, /μL (min, max) 2500-8000 4143.8 ± 1706.0 (1079, 11189) 4459.0 ± 1723.9 (1680, 8761) 3528.7 ± 1434.8†,‡ (1191, 6905) BUN, mg/dL (min, max) 10-26 52.4 ± 22.4 (13, 92) 22.2 ± 8.4* (8, 46) 20.1 ± 5.6†,‡ (9, 35)
< 10, n (%) 0 (0.0) 1 (2.0) 1 (2.0)
10-26, n (%) 5 (10.0) 36 (72.0) 42 (84.0)
> 26, n (%) 45 (90.0) 13 (26.0) 7 (14.0)
Creatinine, mg/dL (min, max) 0.70-1.40 8.76 ± 3.38 (3.3, 18.9) 1.30 ± 0.55* (0.6, 4.6) 1.22 ± 0.26† (0.8, 1.8)
< 0.70, n (%) 0 (0.0) 1 (2.0) 0 (0.0)
0.70-1.40, n (%) 0 (0.0) 36 (72.0) 40 (80.0)
> 1.40, n (%) 50 (100.0) 13 (26.0) 10 (20.0)
Uric acid, mg/dL 3.0-7.0 6.2 ± 2.4 5.6 ± 1.5 6.0 ± 1.3‡
Calcium, mg/dL 8.8-10.5 9.0 ± 0.9 9.7 ± 0.7* 9.7 ± 0.8†
Phosphorous, mg/dL (min, max) 2.5-4.5 4.9 ± 1.7 (1.7, 9.2) 3.1 ± 1.0* (1.2, 5.4) 3.2 ± 0.8† (1.5, 4.7)
< 2.5, n (%) 3 (6.0) 14 (28.0) 7 (14.0)
2.5-4.5, n (%) 21 (42.0) 34 (68.0) 40 (80.0)
> 4.5, n (%) 26 (52.0) 2 (4.0) 3 (6.0)
Potassium, mmol/L (min, max) 3.5-5.5 4.7 ± 0.9 (3.4, 7.9) 4.4 ± 0.5* (3.2, 5.9) 4.4 ± 0.4† (3.4, 4.9)
< 3.5, n (%) 1 (2.0) 2 (4.1) 1 (2.0)
3.5-5.5, n (%) 43 (86.0) 46 (93.9) 49 (98.0)
> 5.5, n (%) 6 (12.0) 1 (2.0) 0 (0.0)
KTPL: kidney transplantation, TLC: total lympocyte count, ANC: absolute neutrophil count, BUN: blood urea nitrogen.
Values are presented as mean ± standard deviation (min, max) or number (%).
*Values are significantly different between admission and 1 month after KTPL at p < 0.05 by paired t-test; †Values are significantly different between admission and 3 months after KTPL at p < 0.05 by paired t-test; ‡Values are significantly different between 1month after TPL and 3 months after KTPL at p < 0.05 by paired t-test.
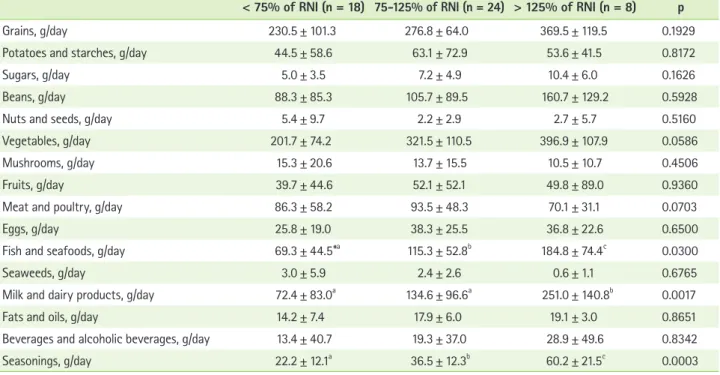
lower intake of eggs. They also showed decreased tendency of vegetable intake, but it was not significant (Table 5). Fish, milk and dairy products, and seasonings were also consumed sig- nificantly less in the lowest calcium intake group than in other groups (Table 6).
As our result showed a higher proportion of patients with hypophosphatemia at 1 month after transplantation com- pared to the proportion of hypophosphatemia before trans- plantation, we analyzed phosphorus intake of patients with hypophosphatemia (< 2.5 mg/dL). The phosphorus intake in the patients with hypophosphatemia was significant lower than that in those with phosphorus level over 2.5 mg/dL (967.7
± 256.0 vs. 1296.4 ± 316.2, p = 0.001). It presented the same result after adjusting energy intake (p = 0.001).
The relationship between weight changes from discharge to 1 month and 3 months after transplantation and nutrients in- take is given in Table 7. Results showed that weight gain from discharge to 1 month after transplantation was significantly Energy
Protein
Vitamin A
Vitamin C
Vitamin B1
Vitamin B2
Vitamin B6
Folate Calcium Phosphorus
Iron
Zinc 200.0
103.4* 119.0*
106.7†
88.0† 90.4† 91.6†
126.8† 155.4†
62.4† 86.8† 172.1†
139.8† 127.9†
100.0
0.0
Niacin
Figure 2. Comparison of nutrient intakes to Recommended Dietary Intakes. *Percentage of recommended daily intake for energy (32 kcal/kg of IBW) and protein (1.3 g/kg of IBW); †Percentage of recommended daily intake based on Recommended Nutrient Intake by the Korean Nutrition Society.
Table 3. The nutrient intakes of the subjects at 1 month after kidney transplantation
Men (n = 24) Women (n = 26) Total (n = 50)
Energy, kcal 2130.7 ± 277.5 1601.5 ± 446.6 1855.5 ± 457.4
Carbohydrate, g 288.6 ± 46.7 211.5 ± 64.2 248.5 ± 68.1
Protein, g 98.7 ± 17.8 75.5 ± 22.6 86.6 ± 23.4
Fat, g 64.5 ± 14.9 51.6 ± 15.8 57.8 ± 16.6
% Energy from carbohydrate 54.2 ± 6.0 52.8 ± 6.5 53.5 ± 6.2
% Energy from protein 18.5 ± 2.2 18.9 ± 2.9 18.7 ± 2.5
% Energy from fat 27.2 ± 5.0 29.2 ± 5.6 28.2 ± 5.4
Fiber, g 22.7 ± 6.1 18.7 ± 5.9 20.6 ± 6.2
Vitamin A, μg R.E 844.3 ± 318.4 616.8 ± 272.0 726.0 ± 313.8
Vitamin E, mg α-TE 23.3 ± 6.7 18.9 ± 6.9 21.0 ± 7.1
Vitamin C, mg 97.3 ± 43.2 79.3 ± 34.3 88.0 ± 39.5
Vitamin B1, mg 1.2 ± 0.2 0.9 ± 0.2 1.0 ± 0.3
Vitamin B2, mg 1.4 ± 0.4 1.1 ± 0.3 1.2 ± 0.4
Niacin, mg 22.4 ± 7.4 16.1 ± 4.8 19.1 ± 6.9
Vitamin B6, mg 2.6 ± 0.5 1.9 ± 0.6 2.3 ± 0.6
Folate, ug 293.6 ± 110.8 208.8 ± 81.1 249.5 ± 104.7
Calcium, mg 689.2 ± 206.5 562.3 ± 194.2 623.2 ± 208.2
Phosphorus, mg 1371.9 ± 270.9 1049.7 ± 313.5 1204.4 ± 333.2
Potassium, mg 3210.8 ± 721.9 2572.4 ± 742.5 2878.8 ± 793.5
Iron, mg 16.8 ± 3.6 12.9 ± 3.5 14.8 ± 4.0
Zinc, mg 13.1 ± 8.2 9.6 ± 6.2 11.3 ± 7.3
Cholesterol, mg 440.5 ± 172.0 291.6 ± 108.2 363.1 ± 159.7
Values are presented as mean ± standard deviation.
related to energy, carbohydrate (p < 0.001) and protein intake (p = 0.003) and weight gain from discharge to 3 months after transplantation was significantly related to energy, carbohy- drate, protein (p < 0.001), and fat intake (p = 0.003).
Discussion
The present study investigated oral intake of adult KTRs to evaluate the intake of nutrients and assess oral intake related problems in Korea. The average BMI of pre-transplant patients was 23.2 kg/m2 and it was lower than that in the Dialysis Outcomes and Practice Patterns Study [15], 25.2 kg/m2, but it was higher than the average BMI of hemodialysis patients reported by Odamaki, 19.0-20.0 kg/m2 [16]. The BMI range in our study was from 18.1 to 29.4 kg/m2, and the percentage of patients with BMI above 25.0 kg/m2 was 24.0%. Our result indicated that some KTRs showed preexisting obesity before transplantation. Obesity is one of the common problems in KTRs and it is known to be associated with increased risk of CVD, dyslipidemia, hypertension and diabetes [17]. Diet therapy plays a main role in management of obesity related disease in KTRs [9]. At the same time, a previous study reported that 15-
Table 4. The food group intakes by vitamin C intake
< 75% of RNI (n = 21) 75-125% of RNI (n = 19) > 125% of RNI (n = 10) p
Grains, g/day 267.7 ± 120.0 277.3 ± 89.7 285.9 ± 67.2 0.0315
Potatoes and starches, g/day 34.7 ± 47.2 67.3 ± 60.3 73.7 ± 88.9 0.2589
Sugars, g/day 7.1 ± 6.0 6.0 ± 4.4 8.2 ± 2.8 0.3563
Beans, g/day 83.1 ± 84.7 145.7 ± 111.8 89.9 ± 68.3 0.1464
Nuts and seeds, g/day 4.8 ± 9.1 2.3 ± 3.0 2.9 ± 5.0 0.6759
Vegetables, g/day 209.2 ± 78.5*a 330.8 ± 121.6b 384.4 ± 84.7b 0.0042
Mushrooms, g/day 11.5 ± 16.9 15.9 ± 18.5 14.4 ± 13.2 0.7830
Fruits, g/day 28.4 ± 43.1a 42.7 ± 48.2a 95.8 ± 69.0b 0.0060
Meat and poultry, g/day 92.8 ± 59.0 82.6 ± 47.9 84.0 ± 31.6 0.2528
Eggs, g/day 30.5 ± 21.0 35.9 ± 24.7 35.6 ± 26.2 0.7336
Fish and seafoods, g/day 87.5 ± 74.9 119.6 ± 58.0 138.3 ± 45.3 0.9221
Seaweeds, g/day 2.0 ± 5.0 2.8 ± 3.8 2.0 ± 1.8 0.5066
Milk and dairy products, g/day 90.5 ± 93.9a 124.9 ± 98.2a 226.8 ± 137.8b 0.0221
Fats and oils, g/day 14.0 ± 6.7 19.3 ± 5.3 17.7 ± 5.9 0.1946
Beverages and alcoholic beverages, g/day 15.3 ± 39.5 20.5 ± 40.1 22.4 ± 44.4 0.9240
Seasonings, g/day 29.3 ± 21.4 35.4 ± 14.1 47.1 ± 16.2 0.4061
RNI: recommended nutrient intake by the Korean Nutrition Society.
Values are presented as mean ± standard deviation; *Values with different alphabets are significantly different among the three groups at p < 0.05 by Duncan test.
Zinc† 8.0 6.0
14.0 36.0
76.0 2.0
8.0 32.0 22.0
42.0 26.0 8.0
10.0 68.0 22.0
52.0 40.0
40.0 34.0
38.0 20.0
74.0 4.0
58.0 10.0
50.0 42.0
24.0 74.0
20.0 4.0
48.0 16.0
86.0
38.0 56.0
60.0 32.0
Iron† Phosphorus† Calcium† Folate† Vitamin B6† Niacin† Vitamin B2† Vitamin B1† Vitamin C† Vitamin A† Protein*
Energy*
0 10 20 30 40
Nutrients
Distribution (%)
50 60 70 80 90 100
< 75% of RNI 75-125% of RNI 125% of RNI
Figure 3. Distribution expressed in percentage of nutrients intakes compared to Recommended Dietary Intakes.
*Percentage of Recommended Daily Intakes for energy (32 kcal/kg of IBW) and protein (1.3 g/kg of IBW); †Percentage of Recommended Daily Intakes based on Recommended Nutrient Intake by the Korean Nutrition Society.
Table 5. The food group intakes by folate intake
< 75% of RNI (n = 38) 75-125% of RNI (n = 10) > 125% of RNI (n = 2) p
Grains, g/day 267.9 ± 109.6 294.2 ± 50.4 314.4 ± 5.2 0.1008
Potatoes and starches, g/day 48.2 ± 54.2 61.5 ± 53.6 148.3 ± 205.1 0.1409
Sugars, g/day 6.6 ± 5.3 8.3 ± 3.2 7.1 ± 4.9 0.8890
Beans, g/day 108.8 ± 101.9 107.5 ± 76.4 101.4 ± 129.3 0.5187
Nuts and seeds, g/day 4.0 ± 7.4 1.9 ± 2.6 1.2 ± 0.6 0.8712
Vegetables, g/day 257.1 ± 106.6 380.5 ± 101.9 472.9 ± 89.0 0.0765
Mushrooms, g/day 15.1 ± 18.1 8.7 ± 10.9 14.0 ± 13.2 0.3610
Fruits, g/day 41.1 ± 53.7 56.8 ± 61.4 118.4 ± 2.3 0.1917
Meat and poultry, g/day 80.2 ± 52.4 104.4 ± 34.1 133.8 ± 0.6 0.4495
Eggs, g/day 27.3 ± 18.6*a 50.8 ± 27.1ab 65.9 ± 20.0b 0.0326
Fish and seafoods, g/day 102.1 ± 69.5 137.1 ± 49.3 119.7 ± 33.0 0.5568
Seaweeds, g/day 2.4 ± 4.3 2.4 ± 3.2 0.9 ± 1.2 0.8034
Milk and dairy products, g/day 120.7 ± 112.6 162.2 ± 133.3 166.7 ± 47.2 0.9361
Fats and oils, g/day 15.8 ± 6.4 19.8 ± 4.5 20.6 ± 13.4 0.9462
Beverages and alcoholic beverages, g/day 17.4 ± 40.0 13.8 ± 23.4 67.5 ± 95.5 0.2384
Seasonings, g/day 32.8 ± 20.5 42.0 ± 9.3 45.4 ± 4.7 0.9806
RNI: recommended nutrient intake by the Korean Nutrition Society.
Values are presented as mean ± standard deviation; *Values with different alphabets are significantly different among the three groups at p < 0.05 by Duncan test.
Table 6. The food group intakes by calcium intake
< 75% of RNI (n = 18) 75-125% of RNI (n = 24) > 125% of RNI (n = 8) p
Grains, g/day 230.5 ± 101.3 276.8 ± 64.0 369.5 ± 119.5 0.1929
Potatoes and starches, g/day 44.5 ± 58.6 63.1 ± 72.9 53.6 ± 41.5 0.8172
Sugars, g/day 5.0 ± 3.5 7.2 ± 4.9 10.4 ± 6.0 0.1626
Beans, g/day 88.3 ± 85.3 105.7 ± 89.5 160.7 ± 129.2 0.5928
Nuts and seeds, g/day 5.4 ± 9.7 2.2 ± 2.9 2.7 ± 5.7 0.5160
Vegetables, g/day 201.7 ± 74.2 321.5 ± 110.5 396.9 ± 107.9 0.0586
Mushrooms, g/day 15.3 ± 20.6 13.7 ± 15.5 10.5 ± 10.7 0.4506
Fruits, g/day 39.7 ± 44.6 52.1 ± 52.1 49.8 ± 89.0 0.9360
Meat and poultry, g/day 86.3 ± 58.2 93.5 ± 48.3 70.1 ± 31.1 0.0703
Eggs, g/day 25.8 ± 19.0 38.3 ± 25.5 36.8 ± 22.6 0.6500
Fish and seafoods, g/day 69.3 ± 44.5*a 115.3 ± 52.8b 184.8 ± 74.4c 0.0300
Seaweeds, g/day 3.0 ± 5.9 2.4 ± 2.6 0.6 ± 1.1 0.6765
Milk and dairy products, g/day 72.4 ± 83.0a 134.6 ± 96.6a 251.0 ± 140.8b 0.0017
Fats and oils, g/day 14.2 ± 7.4 17.9 ± 6.0 19.1 ± 3.0 0.8651
Beverages and alcoholic beverages, g/day 13.4 ± 40.7 19.3 ± 37.0 28.9 ± 49.6 0.8342
Seasonings, g/day 22.2 ± 12.1a 36.5 ± 12.3b 60.2 ± 21.5c 0.0003
RNI; recommended nutrient intake by the Korean Nutrition Society.
Values are presented as mean ± standard deviation; *Values with different alphabets are significantly different among the three groups at p < 0.05 by Duncan test.
23% of KTRs presented signs of undernutrition, BMI under 21 kg/m2 [18]. Rettkowski et al. [19] reported that KTRs with BMI under 23 kg/m2 at 1 year after kidney transplantation shows the increased risk of loss of kidney graft function. These facts indicate that management of undernutrition is as important as that of obesity in KTRs. Percentage of patients with BMI less than 18.5 kg/m2 was 2% in our study, which is relatively low. However, as KTRs are nutritionally heterogeneous, indi- vidualized medical nutrition care plan for weight management should be applied to the KTRs.
It is known that recovery of nutritional status and weight gain mainly occurs during the first year after transplantation [20]. However, Nishi et al. [21] reported that KTRs in Japan showed decrease in weight by 7.6% 3 months after trans- plantation, and weight loss continued 6 months after trans- plantation, and it was not until 2 years after transplantation that the weight reached to pre-transplant weight. Our study also showed significant weight loss after transplantation, but weight loss mainly occurred from admission to discharge.
Body weight from discharge to 1 month and 3 months after transplantation increased but was not significant. Nish et al. [21]
explained that the early post-transplant weight change result- ed from a hypercatabolic state after kidney transplantation.
However, considering both decrease in weight and increase in other nutrition indicators such as albumin, cholesterol and hemoglobin in our study, we could not rule out the influence of changes in hydration status. The albumin level in renal patients is affected not only by poor nutrition, inflammation, and comorbid disease but also by hydration status [22]. Coroas et al. [23] reported decrease in total body water, extracellular water and intracellular water in KTRs. Therefore, the improve- ment in nutrition related biochemical measurements such as
albumin could be a sign of recovery of fluid retention in the body caused by renal dysfunction. We should understand weight loss right after transplantation as a consequence of a hypercatabolic state and change of hydration status rather than deterioration of nutritional status.
Even though 52.0% of the patients in our study showed pre-transplant hyperphospatemia, 28.0% of the patients pre- sented hypophosphatemia at 1 month after transplantation.
Hypophosphatemia is common when renal function normal- izes in KTRs with preexisting hyperparathyrodism. Inadequate phosphorus intake could be one of the risk factors. The phos- phorus intake of patients with hypophosphatemia was 967.7
± 256.0 mg/day and it was significantly lower than that of patients with phosphorus level more than 2.5 mg/dL, 1296.4 ± 316.2 mg/day (p = 0.001). The mean intake of each group was more than KDRI of phosphorus, 800 mg/day. Our results sug- gested that patients with early post-transplant hypophospha- temia need more phosphorus intake than KRDI of phosphorus.
Chadban et al. [24] recommended at least 1.4 g/kg/day pro- tein intake for KTRs during the first 4 weeks after transplanta- tion to reverse negative nitrogen balance and increase muscle mass. Low protein intake at early post-transplant period was a meaningful risk factor of more fat mass and less muscle mass at 1 year after transplantation in KTRs [25]. These facts indicated that adequate protein intake in early post-transplant period is important to maintain muscle mass. The daily mean protein intake of patients in our study was 86.6 g (1.5 g/kg) and it was 119.0% of protein recommended intake for KTRs.
It showed that a strong positive relationship between the protein intake and weight gain from discharge to 1 and 3 month after transplantation (p < 0.001). When we consider that the percentage energy from protein of Korean National Table 7. Correlation coefficient between post-kidney transplantation body weight change and nutrient intakes
Body weight gain
from discharge to 1 month after KTPL from discharge to 3 months after KTPL
Energy, kcal 0.512§ 0.637§
Carbohydrate, g 0.537§ 0.601§
Protein, g 0.419‡ 0.540§
Fat, g 0.254 0.435‡
Energy as percentage of recommendations*, % 0.444‡ 0.607§
Protein as percentage of recommendations*, % 0.327† 0.494§
KTPL: kidney transplantation.
*Recommendations are 32 kcal/kg of IBW/day for energy and 1.3 g/kg of IBW/day for protein; †p < 0.05; ‡p < 0.01; §p < 0.001.
Health and Nutrition Examination Survey (KNHANES) [26] was around 15%, our results, 18.7%, was a little higher than that of KNHANES and it could be the effect of nutrition education provided by a skilled dietitian before discharge. Since most chronic kidney disease patients before transplantation are recommended to control protein intake in some extent, so it is important to educate KTRs that diet after transplantation is different from that before transplantion and adequate protein intake is necessary to maintain muscle mass after transplanta- tion.
When we compared vitamin and mineral intakes of the pa- tients with RNI, most vitamin and mineral intakes were more than 90% of RNI except calcium, folate, and vitamin C. Mean daily intake percentages of calcium, folate, and vitamin C were 86.8%, 62.4%, 88.0% of RNI, respectively. This presented more concerns on quality of diet was necessary in addition to intake of energy and protein in KTRs.
Some KTRs already have chronic kidney disease related bone disease before transplantation and steroid use after transplantation, inadequate calcium intake and hyperparathy- roidism could make bone disease worse [27,28]. Supplementa- tion of calcium and vitamin D is recommended after kidney transplantation to prevent bone disease [29]. Recommended intake of calcium for KTRs is 800-1000 mg/day, which is higher than that for general populations (700-750 mg/day for man, 650-700 mg/day for woman) [7]. Calcium intake in our study was 623.2 mg, which was slightly higher than that reported in KNHANES [26], 529.6 mg, but it was still less than recommended calcium intake for KTRs and 36.0% of patients showed calcium intake under 75% of RNI [12]. When we di- vided the patients into 3 groups according to their intake per- centage (< 75% of RNI, 75-125% of RNI, and > 125% of RNI) and analyzed the mean food intake by each food group, we found significant differences in the intakes of milk and dairy products, fish and seafoods, and seasonings. This was similar to KNHANES results reporting milk and anchovies as main sources of calcium [26]. Calcium in seasonings came from salt with parched sesame and fermented soybean paste. We rec- ommend at least 1 cup of milk per day for adequate calcium intake in KTRs.
Folate intake in our study was also inadequate. Folate in- take was 62.4% of RNI and percentage of patients with folate intake under 75% of RNI was 76.0%. This was similar to the results showing adequate energy and protein intake with inad- equate folate and vitamin D intake at 3 years after transplan-
tation [30]. Inadequate folate intake and plasma folate level were reported as main factors of hyperhomocysteinemia [31].
Hyperhomocysteinemia is known as an independent cardio- vascular risk factor in general population. KTRs showed ele- vated homocysteine levels [32]. Inadequate folate intake is not the main factor of elevated homocysteine level, but it could be a contributing factor. In order to know the main food source of folate, we divided the patients into 3 groups according to folate intake percentage (< 75% of RNI, 75-125% of RNI, and
> 125% of RNI) and analyzed the mean food intake by each food group. Eggs showed significant difference (p < 0.05) and vegetables also showed difference but not significantly (p = 0.0765). This was also similar with the previous study reporting eggs, seaweeds, spinach, and bean sprouts as main sources of folate [33].
Vitamin C was also one of the nutrients showing inadequate intake in our study and percentage of patients with vitamin C intake under 75% of RNI was 42.0%. To investigate food contributing vitamin C intake, we divided the patients into 3 groups according to the level of vitamin C intake (< 75% of RNI, 75-125% of RNI, and > 125% of RNI) and analyzed the mean food intake by each food group and we found signifi- cant differences in milk and dairy products, vegetables, and fruits.
In these results, we found that patients with inadequate fo- late, calcium, and vitamin C intake consumed less foods from milk and dairy products and vegetable and fruits in common and many items in these food groups were not allowed in our neutropenic diet guideline during first few months after trans- plantation. Restrictions of fresh vegetables, fruits, and milk and dairy products not in Tetra Pak in our neutropenic diet guideline could hinder patients from selecting various foods and it could be one of the reasons presenting the lower intake in milk and dairy products, vegetables, and fruits in some pa- tients.
There is no clear consensus on the definition of neutropenia, but lower ANC reported more infections (ANC < 500 /μl, se- vere risk of infection; 500 /μl ≤ ANC < 1000 /μl, moderate risk of infection; 1000 /μl ≤ ANC < 1500 /μl, minimal risk of infec- tion) [34]. The mean level of ANC after transplantation in our study was more than 3000 /μl and patient with ANC under 1500 /μl was only 2 (4.0%) at 3 months after transplantation.
There was also no consensus on level of neutropenic dietary restrictions [35] and it has been reported that evidence didn’t support the efficacy of stringent dietary restrictions in neutro-
penic diet for KTRs [29]. Strict restrictions in neutropenic diet could cause inadequate nutrients intake in KTRs. We suggest reviewing current neutropenic diet guidelines for transplant recipients, which limits fresh vegetables and fruits and milk and dairy products unless they are aseptically processed and packaged.
Conclusion
This study reviewed body weight changes, some biochemi- cal changes related to nutritional status and graft function of 50 KTRs in Korea and evaluated dietary intake and assessed oral intake related nutrition problems. This study showed 4 kg of weight loss right after transplantation with a tendency of weight increase from discharge to 1 month and 3 months after transplantation. Body weight gain during this period was significantly related to intake of energy and protein. Biochemi- cal measurements indicating graft function mostly turned to normal limits. Some patients showed hypophosphatemia, which was related to relatively low phosphorus intake. Energy and protein intakes were adequate but calcium, folate, and vi- tamin C presented inadequate intake. Patients with inadequate intake in such nutrients showed reduced intake in several food groups such as milk and dairy products, vegetables, and fruits, and these were related to food items not allowed in neutrope- nic diet after transplantation. The limitations of our study are that the study was conducted in a single center with a short follow up period. We still don’t know what the nutrition relat- ed problem after 3 months. These limitations must be comple- mented in further studies. In conclusion, KTRs have possibility of under-or over-nutrition related problems. Individualized nu- tritional care plan is necessary to nutritionally heterogeneous KTRs and reviewing present neutropenic diet guideline is also necessary.
References
1. Ministry of Health and Welfare; Korean Network for Organ Sharing.
Annual report of the transplant 2011. Seoul: Korean Network for Organ Sharing; 2012.
2. Kim MH, Kim MS, Kwon OJ, Kang CM. Comparison of quality of life between kidney transplant patients and dialysis patients. J Korean Soc Transplant 2009;23:65-70.
3. Laupacis A, Keown P, Pus N, Krueger H, Ferguson B, Wong C, Muirhead N.
A study of the quality of life and cost-utility of renal transplantation.
Kidney Int 1996;50:235-42.
4. Favi E, Salerno MP, Romagnoli J, Castagneto M, Citterio F. Significant improvement in patient survival after renal transplantation in the last
decade. Transplant Proc 2011;43:285-7.
5. Wang K, Liu QZ. Effect analysis of 1-year posttransplant body mass index on chronic allograft nephropathy in renal recipients. Transplant Proc 2011;43:2592-5.
6. Armstrong KA, Campbell SB, Hawley CM, Nicol DL, Johnson DW, Isbel NM. Obesity is associated with worsening cardiovascular risk factor profiles and proteinuria progression in renal transplant recipients. Am J Transplant 2005;5:2710-8.
7. Teplan V, Valkovsky I, Teplan V Jr, Stollova M, Vyhnanek F, Andel M. Nu- tritional consequences of renal transplantation. J Ren Nutr 2009;19:95- 100.
8. Bia M, Adey DB, Bloom RD, Chan L, Kulkarni S, Tomlanovich S. KDOQI US commentary on the 2009 KDIGO clinical practice guideline for the care of kidney transplant recipients. Am J Kidney Dis 2010;56:189-218.
9. Lopes IM, Martín M, Errasti P, Martínez JA. Benefits of a dietary inter- vention on weight loss, body composition, and lipid profile after renal transplantation. Nutrition 1999;15:7-10.
10. Martins C, Pecoits-Filho R, Riella MC. Nutrition for the post-renal transplant recipients. Transplant Proc 2004;36:1650-4.
11. Beto JA, Bansal VK. Medical nutrition therapy in chronic kidney failure:
integrating clinical practice guidelines. J Am Diet Assoc 2004;104:404- 9.
12. Byham-Gray L, Wiesen K; American Dietetic Association Renal Prac- tice Group; National Kidney Foundation Council on Renal Nutrition. A clinical guide to nutrition care in kidney disease. Chicago, IL: American Dietetic Association; 2004.
13. The Korean Dietetic Association. Manual of medical nutrition therapy.
2nd ed. Seoul: Kyung Hee; 1999.
14. The Korean Nutrition Society. Dietary reference intakes for Koreans. 1st rev. Seoul: Hanareum; 2010.
15. Leavey SF, McCullough K, Hecking E, Goodkin D, Port FK, Young EW.
Body mass index and mortality in ‘healthier’ as compared with ‘sicker’
haemodialysis patients: results from the Dialysis Outcomes and Prac- tice Patterns Study (DOPPS). Nephrol Dial Transplant 2001;16:2386-94.
16. Odamaki M, Furuya R, Yoneyama T, Nishikino M, Hibi I, Miyaji K, Kum- agai H. Association of the serum leptin concentration with weight loss in chronic hemodialysis patients. Am J Kidney Dis 1999;33:361-8.
17. Johnson DW, Isbel NM, Brown AM, Kay TD, Franzen K, Hawley CM, Campbell SB, Wall D, Griffin A, Nicol DL. The effect of obesity on renal transplant outcomes. Transplantation 2002;74:675-81.
18. Djukanović L, Lezaić V, Blagojević R, Radivojević D, Stosović M, Jovanović N, Ristić S, Simić-Ogrizović S. Co-morbidity and kidney graft failure-two main causes of malnutrition in kidney transplant pa- tients. Nephrol Dial Transplant 2003;18 Suppl 5:v68-70.
19. Rettkowski O, Wienke A, Hamza A, Osten B, Fornara P. Low body mass index in kidney transplant recipients: risk or advantage for long-term graft function? Transplant Proc 2007;39:1416-20.
20. Netto MC, Alves-Filho G, Mazzali M. Nutritional status and body com- position in patients early after renal transplantation. Transplant Proc 2012;44:2366-8.
21. Nishi S, Gejyo F, Saito K, Nakagawa Y, Takahashi K. Diet therapy after kidney transplantation: a comparative debate between Japan and western countries. Contrib Nephrol 2007;155:82-9.
22. Jones CH, Akban i H, Croft DC, Worth DP. The relationship between se- rum albumin and hydration status in hemodialysis patients. J Ren Nutr 2002;12:209-12.
23. Coroas AS, de Oliveira JG, Sampaio SM, Tavares IC, Pestana M, Almeida MD. Postrenal transplantation body composition: different evolution depending on gender. J Ren Nutr 2007;17:151-6.
24. Chadban S, Chan M, Fry K, Patwardhan A, Ryan C, Trevillian P, West- garth F; CARI. The CARI guidelines. Protein requirement in adult kidney transplant recipients. Nephrology (Carlton) 2010;15 Suppl 1:S68-71.
25. Han SS, Hwang JH, Oh YJ, Cha RH, Ahn C, Kim YS. Change in body
compositions of Asian recipients after kidney transplantation. J Korean Med Sci 2012;27:1182-7
26. Ministry of Health and Welfare, Korea Centers for Disease Control &
Prevention. Korea health statistics 2010: Korea National Health and Nutrition Examination Survey (KNHANES V-1) 2010. Seoul: Ministry of Health and Welfare, Korea Centers for Disease Control & Prevention;
2011.
27. Pichette V, Bonnardeaux A, Prudhomme L, Gagné M, Cardinal J, Oui- met D. Long-term bone loss in kidney transplant recipients: a cross- sectional and longitudinal study. Am J Kidney Dis 1996;28:105-14.
28. Coco M, Glicklich D, Faugere MC, Burris L, Bognar I, Durkin P, Tellis V, Greenstein S, Schechner R, Figueroa K, McDonough P, Wang G, Malluche H. Prevention of bone loss in renal transplant recipients: a prospective, randomized trial of intravenous pamidronate. J Am Soc Nephrol 2003;14:2669-76.
29. Chan M, Patwardhan A, Ryan C, Trevillian P, Chadban S, Westgarth F, Fry K; Caring for Australasians with Renal Impairment; Dietitians Asso- ciation of Australia. Evidence-based guidelines for the nutritional man- agement of adult kidney transplant recipients. J Ren Nutr 2011;21:47-
51.
30. Heaf J, Jakobsen U, Tvedegaard E, Kanstrup IL, Fogh-Andersen N. Di- etary habits and nutritional status of renal transplant patients. J Ren Nutr 2004;14:20-5.
31. Selhub J, Jacques PF, Wilson PW, Rush D, Rosenberg IH. Vitamin status and intake as primary determinants of homocysteinemia in an elderly population. JAMA 1993;270:2693-8.
32. Arnadottir M, Hultberg B, Vladov V, Nilsson-Ehle P, Thysell H. Hyper- homocysteinemia in cyclosporine-treated renal transplant recipients.
Transplantation 1996;61:509-12.
33. Han YH, Yon M, Hyun TH. Folate intake estimated with an updated da- tabase and its association to blood folate and homocysteine in Korean college students. Eur J Clin Nutr 2005;59:246-54.
34. Hsieh MM, Everhart JE, Byrd-Holt DD, Tisdale JF, Rodgers GP. Preva- lence of neutropenia in the U.S. population: age, sex, smoking status, and ethnic differences. Ann Intern Med 2007;146:486-92.
35. French MR, Levy-Milne R, Zibrik D. A survey of the use of low microbial diets in pediatric bone marrow transplant programs. J Am Diet Assoc 2001;101:1194-8.