834 PISSN 0304-128X, EISSN 2233-9558
반응표면분석법을 이용한 Arthrobacter sp. PAMC 25486의 카로티노이드 생산배지 최적화
김현도 · 최종일† · 한세종*
전남대학교 생물공학과 바이오에너지 및 바이오소재 협동과정 500-757 광주광역시 북구 용봉로 77
*극지연구소 극지생명과학연구부 406-840 인천광역시 연수구 송도미래로 26
(2014년 4월 9일 접수, 2014년 5월 11일 수정본 접수, 2014년 5월 18일 채택)
Optimization of Medium for Carotenoids Production by Arthrobacter sp. PAMC 25486 Using Response Surface Methodology
Hyun-do Kim, Jong-il Choi† and Se Jong Han*
Department of Biotechnology and Bioengineering, Interdisciplinary Program of Graduate School for Bioenergy and Biomaterials, Chonnam National University, 77 Yongbong-ro, Buk-gu, Gwangju 500-757, Korea
*Division of Life Sciences, Korea Polar Research Institute, 26 Songdomirae-ro, Yeonsu-gu, Incheon 406-840, Korea (Received 9 April 2014; Received in revised form 11 May 2014; accepted 18 May 2014)
요 약
본 논문에서는 반응표면분석법을 이용한 Arthrobacter sp. PAMC 25486의 carotenoids 생산 배지의 최적화를 수행 하였다. Placket-Burman 방법을 이용하여 yeast extract, MgSO4, dextrose가 carotenoids의 생산에 영향을 미치는 주요 인자인 것을 확인하였다. 반응표면분석 방법을 이용하여 최대 carotenoids 생산 농도를 갖는 yeast extract, MgSO4, dextrose의 농도를 계산한 결과 1 g/L yeast extract, 0.0879 g/L MgSO4 and 1 g/L dextrose의 농도에서 최대 307 mg/L 의 carotenoids 농도가 예측됐으며, 실제 배양 결과 288 mg/L carotenoids가 얻어졌다. 얻어진 농도 값은 최적화 이전의 값에 비하여 200% 이상 증가하였다. 이러한 결과로부터 미생물 배양에 의한 carotenoids 생산을 증가시키기 위한 배지최적 화 방법으로서 반응표면분석법의 유용성을 확인할 수 있었다.
Abstract − This study was conducted to optimize the medium composition for carotenoid production in Arthrobacter sp. PAMC 25486 through response surface methodology (RSM). Using a Placket-Burman design, from which yeast extract, MgSO4 and dextrose were identified as the significant factors affecting carotenoids production. RSM studies for carotenoids production by Arthrobacter sp. PAMC 25486 have been carried out for three parameters of yeast extract, MgSO4 and dextrose concentrations. These significant factors were optimized by experiments and RSM, as 1 g/L yeast extract, 0.0879 g/L MgSO4 and 1 g/L dextrose. The experimentally obtained concentration of carotenoid was 288 mg/L, and it became 2-fold increase on concentration before optimization.
Key words: Arthrobacter sp., Carotenoid, Response Surface Methodology 1. 서 론
Carotenoids는 미생물에서부터 동·식물에 이르기까지 모든 환경에 널리 분포하고 있는 지용성 색소이며, 지금까지 600여 종 이상이 알 려져 있다[1]. Carotenoids는 항산화 능력이 매우 뛰어나며, 동물의 생장 촉진, 성장률 개선, polar psychrophile carotenoid 질병발생 억
제 등의 효능을 보이며, 식물에서는 광합성을 도와주는 역할을 한다 [2-5]. 뿐만 아니라, 인체 내에서 vitamin A의 전구체 역할을 하며, oxygen radical의 제거에 의한 암 예방, 면역기능 활성화 등의 여러 중요한 대사적 역할을 나타내는 것으로 알려지면서 최근 의약용제, 사료첨가물, 건강식품 및 식품첨가물 등에 이용가치가 클 것으로 예 상되어 산업적인 측면에서 그 수요가 증가하고 있다[5-9].
천연 carotenoids는 합성품에 비해 가격 경쟁적 측면에서 한계를 나타내며, 또한 함유량 자체도 1% 미만으로 매우 적은 양을 함유하고 있다. 이에 따라, 여러 국가들은 균체 혹은 조류 등으로부터 carotenoids 를 추출하는 생물공학적 방법이 연구되고 있으며, Phaffia rhodozyma [10], Haematococcus pluvalis[11], Paracoccus sp.[12] 등이 연구에
†To whom correspondence should be addressed.
E-mail: [email protected]
This is an Open-Access article distributed under the terms of the Creative Com- mons Attribution Non-Commercial License (http://creativecommons.org/licenses/by- nc/3.0) which permits unrestricted non-commercial use, distribution, and reproduc- tion in any medium, provided the original work is properly cited.
단 신
이용되고 있으나 낮은 carotenoid의 함량이 문제가 되고 있다.
극지 환경과 같은 특수한 환경에서 생장하는 많은 미생물들은 아 주 다양한 분자구조의 carotenoid를 생산하는 것으로 알려져 있으며, 낮은 온도에서도 성장이 가능하여 carotenoids의 생산비용이 절감됨 에 따라 산업적으로 많은 관심을 받고 있다. 하지만, 이러한 극지 환 경에서 생장하는 미생물들 또한, 낮은 carotenoids 함량과 느린 성장 속도로 인하여 이용에 많은 제한을 받고 있다.
따라서, 본 논문은 저온에서도 생장이 가능하며 carotenoids를 생 산하는 극지 미생물인 Arthrobacter sp. PAMC 25486을 이용하여 carotenoids의 생산성 향상을 위한 Arthrobacter 배양의 최적화를 수 행하였다. ONE facter at a time (OFAT) 은 인자 간의 상호작용을 확 인하는데 어려움이 있기에 carotenoid의 최대 생산성을 보여주는 배지 조성을 최적화하기 위한 반응표면분석법(RSM)을 이용하였다[13,14].
반응표면분석은 전형적인 최적화 방법으로 여러 변수를 사용하여 최적의 조건을 찾는 방법[15] 이며, 다른 변수들과 하나의 변수와의 상호작용으로 인한 결과를 측정하여 최적의 변수값을 확인할 수 있는 분석법이다. 따라서 본 논문은 arthrobacter를 이용하여 carotenoids 생산의 상업적 이용 가능성을 확인해 보기 위하여 반응표면분석을 이용하여 carotenoids의 최대 생산성을 보여주는 배지의 조성을 조 사하였다.
2. 재료 및 방법 2-1. 균주
실험에 사용한 carotenoids 생산 미생물은 Arthrobacter sp. (PAMC 25486)을 사용하였으며, 극지연구소로부터 분양 받았다. Yeast extract (Becton, Dickinson and Company, USA) 0.5 g/L, proteose peptone NO.3 (Becton, Dickinson and Company) 0.5 g/L, casamino acids (Becton, Dickinson and Company) 0.5 g/L, C6H12O6 (Junsei Chemical Co., Ltd., Tokyo, Japan) 0.5 g/L, soluble starch (Becton, Dickinson and Company) 0.5 g/L, C3H3NaO3 (Sigma-Aldrich Co., St. Louis, MO, USA) 0.3 g/L, HK2O4P (Sigma-Aldrich, Co.) 0.3 g/L, MgSO4·7H2O (Daejung Chemical
& Metal Co., Ltd, Seoul, South Korea) 0.05 g/L, agar (Becton, Dickinson and Company) 15 g/L 조성에 pH 7.2의 배지를 이용하여 20oC에서 계대 배양하였으며, yeast extract 0.5 g/L, proteose peptone NO.3 0.5 g/L, casamino acids 0.5 g/L, C6H12O6 0.5 g/L, soluble starch 0.5 g/L, C3H3NaO3 0.3 g/L, HK2O4P 0.3 g/L, MgSO4·7H2O 0.05 g/L, 조성에 pH 7.2의 배지를 사용하였다.
2-2. 배양 배지 및 배양 조건
전배양 한천 배지는 yeast extract 0.5 g/L, proteose peptone NO.3 0.5 g/L, casamino acids 0.5 g/L, C6H12O6 0.5 g/L, soluble starch 0.5 g/L, C3H3NaO3 0.3 g/L, HK2O4P 0.3 g/L, MgSO4·7 H2O 0.05 g/L, agar 15 g/L 조성에 pH 7.2의 배지에 접종하여 20oC에서 7일간 배양하여 사용하였으며, 액체 배양은 yeast extract 0.5 g/L, proteose peptone NO.3 0.5 g/L, casamino acids 0.5 g/L, C6H12O6 0.5 g/L, soluble starch 0.5 g/L, C3H3NaO3 0.3 g/L, HK2O4P 0.3 g/L, MgSO4·7 H2O 0.05 g/L 조성에 pH 7.2의 배지를 50 mL씩 250 mL triangular flask에 넣고 멸균한 후 균주를 접종하여 20oC에서 150 rpm으로 교반하여 3일간 배양하였다.
통계적 실험 설계를 위한 배지 조성은 yeast extract 0.5 g/L, proteose
peptone NO.3 0.5 g/L, casamino acids 0.5 g/L, C6H12O6 0.5 g/L, soluble starch 0.5 g/L, C3H3NaO3 0.3 g/L, HK2O4P 0.3 g/L, MgSO4 · 7 H2O 0.05 g/L 조성에 pH 7.2의 배지(R2A) 를 사용하였다.
실험 설계는 Plackett-Burman의 방법을 이용하여 설계하였으며[16], 각각 50 mL씩 250 mL triangular flask에 넣고 멸균한 후 균주를 접 종하여 20oC에서 150 rpm으로 교반하여 3일간 배양하여 사용하였다.
모든 실험군은 3회 반복하여 진행하였다.
2-3. Biomass determination
600 nm에서 흡광도를 측정하여 OD/dry weight의 식을 이용하여 20oC의 R2A Broth에서 자란 미생물의 흡광도와 dry weight간의 연 관성을 Fig. 1과 같이 확인하였다.
2-4. 성장률 측정
Arthrobacter의 성장률을 UV/vis spectrophotometer (Mecasys Co, Optizen POP, Seoul, South Korea) 를 사용하여 600 nm에서 흡광도를 측정하였다. 배양액을 200 μL 취하여 멸균된 R2A medium 800 μL에 넣어 5배 희석하여 흡광도를 측정하였고, 멸균된 R2A medium을 blank로 사용하였다.
2-5. Carotenoid 추출 및 정량
Carotenoid 추출은 배양액을 4oC에서 원심분리(14,000 rpm, 10 min) 한 후 침전물을 회수하여 methyl alcohol 등의 유기용매로 색소를 완 전히 추출한 이후에 UV/vis spectrophotometer를 이용하여 474 nm에서 흡광도를 측정하였다. Carotenoid의 수율은 extinction coefficient = 2,100으로 하여 다음 식에 의하여 계산하였다.
총 carotenoid (mg/L) =
2-6.실험 설계 및 반응표면분석(reponse surface methodology;
RSM)
하나의 인자의 수준을 변화시키고 다른 인자들을 고정시켜 인자의 영향을 확인하는 방법인 ONE facter at a time (OFAT)은 인자 간 상 호작용을 확인하기에는 어려움이 있다. 그리하여 carotenoid의 최대
Vol A× 474×10000 E1cm1%(2100) weight of tissue (g)× --- Fig. 1. Relationship between dry weight and UV absorbance in R2A
medium.
생산성을 보여주는 배지 조성을 최적화하기 위한 반응표면분석법 (RSM)[17,18]을 이용하였다. 배지조성에 대한 실험 설계는 Plackett- Burman 법을 사용하여 설계하였고 17개의 실험군을 각각 3반복 하 여 실험하였으며 이에 따른 모델식은 다음과 같다(식 1).
Y = α0 + α1X1 + α2X2 + α3X3 + α12X1X2 + α13X1X3 + α23X2X3 + α11X12 + α22X22 + α33X32 (1) 종속 변수 Y는 carotenoid의 생산량이고 carotenoid 생산에 중요한 독립 변수는 X1과 X2, X3이다.
2-7. 통계 분석
반응표면분석을 위하여 Statistica version 12 (StatSoft, Tulsa, USA)와 MINITAB Release 15 (Minitab Inc., State College, PA, USA), SPSS 21.0 (SPSS Inc., Chicago, IL, USA)을 이용하였다. 실험 결과를 분산분 석, 모수추정, 회귀분석 등을 이용하여 독립 변수와 종속변수간의 상 관관계를 삼차원 표면도로 나타내어 함수관계를 추정하고, 예측하 여 최적화 하였다.
3. 결과 및 고찰 3-1. 통계적 실험설계를 이용한 중요 요소 결정
반응표면분석은 발효공정의 최적화를 수행하는데 가장 효과적인 것으로 알려져 있다. 분류 변수 설계를 위한 각 변수의 범위와 그 결
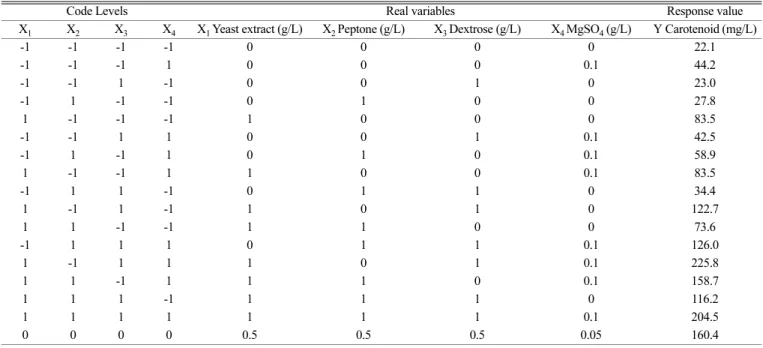
과를 Plackett-Burman의 실험설계를 이용하여 Table 1에 제시하였다.
무기염이 carotenoid 생산을 증가시킨다는 보고[19]에 따라 MgSO4
·7H2O와 질소원인 peptone, yeast extract, 그리고 dextrose를 각각의 독립변수로 두어 carotenoid 농도를 측정하여 carotenoid 농도에 영 향을 주는 인자를 확인하였다.
측정 결과 carotenoid를 가장 많이 생합성한 배지 조건은 peptone이 첨가되지 않고, MgSO4·7H2O 0.1 g/L, yeast extract 1 g/L, dextrose 1 g/L가 첨가되었을 때였고 carotenoid 생산량은 225.8 mg/L의 생산 성을 보였다. 가장 적게 생합성한 배지는 MgSO4·7H2O, peptone, yeast extract, 그리고 dextrose가 모두 첨가되지 않은 조성을 가질 경 우였으며, 이 때 carotenoid의 생산량은 22.1 mg/L을 보였다.
이 실험 결과들을 가지고 회귀분석을 통한 중요 변수를 확인한 결과 yeast extract, MgSO4·7H2O, dextrose, peptone의 순으로 t-값이 높게 계산되었으며 Table 2에 제시하였다. 계산된 값에 따라 peptone (0.5 g/L), casamino acids (0.5 g/L), soluble starch (0.5 g/L), C3H3NaO3 (0.3 g/L), HK2O4P (0.3 g/L)을 고정시키고 MgSO4·7H2O, yeast extract, dextrose 의 농도를 3단계로 나누어 실험을 실시하였다(Table 3).
이 실험 결과를 토대로 RSM을 실시한 결과 다음과 같은 모델식을 얻었다(식 2).
Y = 0.291 + 0.0114X1+ 1.883X2– 0.0367X3+ 0.966X1X2+ 0.1554X1X3 + 0.082X2X3− 0.0204X12− 15.78X22+ 0.032X32
Y는 carotenoid 실험적인 농도와 이론적인 농도이며, X1, X2, X3는
Table 1. Plackett-Burman experimental design matrix for screening of important variables for carotenoid production
Code Levels Real variables Response value
X1 X2 X3 X4 X1 Yeast extract (g/L) X2 Peptone (g/L) X3 Dextrose (g/L) X4 MgSO4 (g/L) Y Carotenoid (mg/L)
-1 -1 -1 -1 0 0 0 0 22.1
-1 -1 -1 1 0 0 0 0.1 44.2
-1 -1 1 -1 0 0 1 0 23.0
-1 1 -1 -1 0 1 0 0 27.8
1 -1 -1 -1 1 0 0 0 83.5
-1 -1 1 1 0 0 1 0.1 42.5
-1 1 -1 1 0 1 0 0.1 58.9
1 -1 -1 1 1 0 0 0.1 83.5
-1 1 1 -1 0 1 1 0 34.4
1 -1 1 -1 1 0 1 0 122.7
1 1 -1 -1 1 1 0 0 73.6
-1 1 1 1 0 1 1 0.1 126.0
1 -1 1 1 1 0 1 0.1 225.8
1 1 -1 1 1 1 0 0.1 158.7
1 1 1 -1 1 1 1 0 116.2
1 1 1 1 1 1 1 0.1 204.5
0 0 0 0 0.5 0.5 0.5 0.05 160.4
Table 2. Data showing the statistical signicance of the coeffient determination Model Unstandardized Coefficients Standardized Coeffients
t Sig. 95% Confidence Interval of the Difference
B Std. Error Beta Lower Upper
(constant) -.043 .120 -.361 .724 -.305 .218
YeastExtract .527 .108 .673 4.879 .000 .292 .762
Peptone .117 .108 .149 1.082 .300 -.118 .352
Dextrose .262 .108 .334 2.425 .032 .027 .497
MagnesiumSulfate 3.369 1.080 .430 3.119 .009 1.016 5.722
Dependent variable : Carotenoid
각각 yeast extract와 MgSO4, dextrose의 농도가 coding된 값을 나타 낸다. 분석결과 결정계수(R2)는 0.953로 계산되었다. 이는 실험설계 한 carotenoid 생산성 설계와 95.3%의 적합성을 보였음을 의미한다.
R2값은 항상 0과 1사이에 존재하며, R2값 > 0.75 일 때 바람직한 실 험설계를 하였다고 할 수 있다.
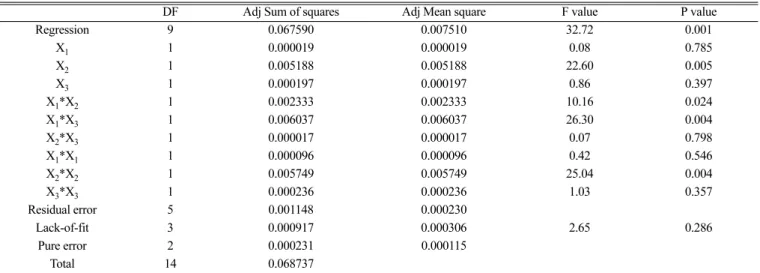
P value는 각 계수의 중요성을 확인하는 도구로 유의 확률을 확인 하는 지표가 되며, 값이 0.05보다 작으면 모델이 유효하다고 판단할 수 있다. F value는 모형의 적합성을 판단하는 지표이며, 모델의 noise가 생길 확률을 확인할 수 있다. 본 연구에서 구한 적합성 결여의 P value는 0.286으로 나타났으며, 이는 얻어진 모델이 매우 적절하다는 것을 의미하는 것이다(Table 4).
결정계수와 결정계수조정은 위 모델의 유효성과 정확성을 암시하고 적합성을 판단할 수 있다(Table 5).
3-2. 중요 요소들 간의 상관관계
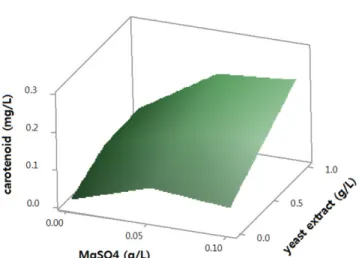
MgSO4와 yeast extract, dextrose의 농도와 carotenoid 생산량과의 관계를 파악하기 위해 3차원 그래프로 표현하였다. Fig. 2에서와 같이 yeast extract가 증가할수록 MgSO4또한 증가하여야 carotenoid 생 산성이 증가하며, Fig. 3의 dextrose 또한 yeast extract가 증가할수록 증가시켜주어야 carotenoid 생산성이 증가한다는 것을 확인하였다.
하지만 Fig. 4에서와 같이 MgSO4와 dextrose의 관계는 일정 농도 이상의 MgSO4첨가 시 carotenoid의 생산량이 증가하지 않는 결과 를 얻었다.
3-3. RSM 결과에 따른 carotenoids 최대 생산량 확인 최근 carotenoid 생산연구에 가장 많이 이용되는 균주는 Rhodotorula 이며, 이전의 반응표면분석을 이용하여 Rhodotorula gracilis mutant의 carotenoid 최대 생산배지 조건을 확인한 연구에서 enebose medium에 sugar concentration 8%, 24oC, pH 7.5, 12일의 배양기간의 조건에서 배양하였을 때 carotenoid의 최대 생산량은 906 mg/L로 기본 enebose medium과 비교하였을 때 약 2배의 매우 높은 증가폭을 보인 선례가 있다[20]. 또한, 2010년에는 Rhodotorula를 sucrose 4%, diammonium Table 3. RSM data on carotenoid production by Arthrobacter sp. PAMC 25486
Code levels Real variables Experimental value Theoretical value
X1 X2 X3 X1a Yeast extract (g/L) X2b MgSO4 (g/L) X3c Dextrose (g/L) Y Carotenoid (mg/L) Y Carotenoid (mg/L)
-1 -1 0 0 0 0.5 16.4 18.8
-1 0 -1 0 0.05 0 72.0 83.8
0 -1 -1 0.5 0 0 43.8 29.7
-1 0 1 0 0.05 1 88.4 83.2
0 -1 1 0.5 0 1 99.8 102.7
-1 1 0 0 0.1 0.5 62.2 53.35
0 1 -1 0.5 0.1 0 111.3 108.5
1 0 -1 1 0.05 0 117.8 123.1
1 -1 0 1 0 0.5 78.5 87.45
0 1 1 0.5 0.1 1 175.5 189.7
1 1 0 1 0.1 0.5 220.9 218.7
1 0 1 1 0.05 1 289.6 277.9
0 0 0 0.5 0.05 0.5 127.6 139.1
0 0 0 0.5 0.05 0.5 140.7 139.1
0 0 0 0.5 0.05 0.5 148.9 139.1
Table 4. Analysis of variance of the experimental results of the BBD
DF Adj Sum of squares Adj Mean square F value P value
Regression 9 0.067590 0.007510 32.72 0.001
X1 1 0.000019 0.000019 0.08 0.785
X2 1 0.005188 0.005188 22.60 0.005
X3 1 0.000197 0.000197 0.86 0.397
X1*X2 1 0.002333 0.002333 10.16 0.024
X1*X3 1 0.006037 0.006037 26.30 0.004
X2*X3 1 0.000017 0.000017 0.07 0.798
X1*X1 1 0.000096 0.000096 0.42 0.546
X2*X2 1 0.005749 0.005749 25.04 0.004
X3*X3 1 0.000236 0.000236 1.03 0.357
Residual error 5 0.001148 0.000230
Lack-of-fit 3 0.000917 0.000306 2.65 0.286
Pure error 2 0.000231 0.000115
Total 14 0.068737
Table 5. Analysis of variance for the fitted quadratic polynomial model of carotenoids production
Item S R2 R2Adj R2Pred
Value 0.0151511 98.33 95.32 77.90
phosphate 1.5%, yeast extract 1% pH 6.0, 30oC, 160 rpm의 조건에서 85.3% 수율을 증가시킨 2.45 mg/L의 최대 carotenoid 생산량 증가를
확인한 연구가 발표되었고, Rhodotorula gracilis strain 1151을 이용 하여 YMP 배지를 최적화하여 3.65 mg/L의 carotenoid의 생산을 확 인한 연구도 존재한다[21,22].
본 연구에서는 반응표면분석으로 예측된 carotenoid의 최대 생산량은 307 mg/L이였고 이때의 yeast extract 및 MgSO4, dextrose의 농도는 각각 1과 0.0879, 1 g/L으로 나타났다. 이에 따른 확인 실험을 수행 한 결과 288 mg/L의 carotenoid를 생성하였다. 이러한 carotenoid의 농도는 최적화되지 않은 R2A 배지에서 얻어진 농도의 207%의 증 가를 보였다. 이는 이전의 연구들과 같이 매우 높은 생산량 증가를 확인한 것이다.
4. 결 론
Carotenoid를 생산하는 극지균주인 Arthrobacter sp.의 carotenoid 생산성 증가를 위해 반응표면분석법을 사용하여 최적의 배지조성을 설계하였다. Arthrobacter의 성장 배지인 R2A 배지를 사용하여 carotenoid 생산성을 측정한 결과 139 mg/L의 carotenoid 농도를 보 였다. R2A 배지의 조성을 각각 변수로 두어 가장 많은 영향을 주는 성분을 알아본 결과 yeast extract, MgSO4, 그리고 dextrose 순으로 영향을 미치는 것으로 확인되었다. Carotenoid 생산성에 대한 회귀 식의 R2은 0.953로 나타났고, 이에 따른 최대 생산량은 307 mg/L로 예상되었으며 이때의 MgSO4및 yeast extract, dextrose의 농도는 각 각 0.0879와 1, 1 g/L으로 나타났다. 즉, yeast extract 1 g/L, peptone 0.5 g/L, casamino acids 0.5 g/L, C6H12O6 1 g/L, soluble starch 0.5 g/L, C3H3NaO3 0.3 g/L, HK2O4P 0.3 g/L, MgSO4·7H2O 0.0879 g/L 조성에 pH 7.2의 배지에서 carotenoid의 최대 생산량을 보일 것이라 예상되 었다. 이에 대한 확인실험 결과 288 mg/L의 carotenoid가 생산되었 으며, 배지의 최적화에 따라 207% 이상의 생산성 증가가 확인되었다.
본 연구에 의해 Arthrobacter sp.의 변형된 조성의 R2A 배지에서의 최적화로 인한 생산성 증가 확인에 따라, 의약품, 축산사료첨가제, 건강식품 및 식품첨가물, 항산화제 등의 다양한 분야에 산업적인 측 면에서 이용이 가능할 것으로 판단된다.
감 사
본 연구는 농림축산식품부·해양수산부·농촌진흥청·산림청 Golden Seed 프로젝트 사업에 지원과 극지연구소 과제(PE14070)지원으로 수행되었습니다.
References
1. An, G. H., Schumn, D. B. and Johnson, E. A., “Isolation of phaf- fia rhodozyma Mutants with Increased Astaxanthin Content,”
Appl. Environ. Microbiol., 55, 116-124(1989).
2. Bendich, A., “β-Carotene and The Immune Response,” Proceed- ings of the Nutrition Society, 50, 363-374(1991).
3. Hong, S. P., “Biological Activity and Prospects of Natural Carot- enoid,” Journal of Food Technology, 9, 127-132(1996).
4. Bauerfeind, J. C., “Carotenoids as Colorants and Vitamin A Pre- cursors,” Academic Press, New York, 1-250(1981).
5. Pierr, A., “Food Carotenoids and Cancer Prevention-An Over- view of Current Research,” Trends Food Sci. Technol., 8, 406- Fig. 2. Three-dimensional response surface plot showing the effect
of MgSO4 concentration and yeast extract concentration on carotenoid production at 0.05% dextrose level in the medium.
Fig. 3. Three-dimensional response surface plot showing the effect of dextrose concentration and yeast extract concentration on carotenoid production at 0.005% of MgSO4 level in the medium.
Fig. 4. Three-dimensional response surface plot showing the effect of dextrose concentration and MgSO4 concentration on carot- enoid production at 0.05% yeast extract level in the medium.
411(1997).
6. Hussein, G., Sankawa, U., Goto, H., Matsumoto, K. and Watanabe, H., “Astaxanthin, a Carotenoid with Potential in Human Health and Nutrition,” J. Nat. Prod., 69, 443-449(2006).
7. Britton, G., “Carotenoids”, Academic Press, London, Methods in Plant Biochemistry., 7, 473-518(1991).
8. Kearsley, M. W. and Rodriguez, N., “The Stability and Use of Natural Colours in Foods: Anthocyanin, β-carotene and Ribofa- vin,” Journal of Food Technology, 16, 421-431(1981).
9. De Hann, A., Burke, R. M. and De Bont, J. A. M., “Microbial Produc- tion of Food Colorants,” Med. Fac. Landbouww. Rijksuniv. Gent., 56, 1655-1660(1991).
10. Chumpolkulwong, N., Kakizono, T., Nagai, S. and Nishio, N.,
“Increased Astaxanthin Production by Phaffia rhodozyma Mutants Isolated as Resistant to Diphenylamine,” J. Ferment. Bioeng., 83, 429-434(1997).
11. Suh, I. S., Joo, H. N. and Lee. C. G., “A Novel Double-layered Photobioreator for Simultaneous Haematococcus pluvialis Cell Growth and Astaxanthin Accumulation,” J. Biotechnol., 125, 540- 546(2006).
12. Lee, J. H., Kim, Y. S., Choi, T. J., Lee, W. J. and Kim, Y. T., “Paracoc- cus haeundaensis sp. Nov., a Gram-negative, Halophilic, Astaxan- thin-producing Bacterium,” International Journal of Systematic and Evolutionary Microbiology, 54, 1699-1702(2004).
13. Riter, L. S., Vitek, O., Gooding, K. M., Hodge, B. D. and Julian, R. K. Jr., “Statistical Design of Experiments as a Tool in Mass Spectrometry,” Journal of Mass Spectrometry, 40, 565-579(2005).
14. Ferdosh, S., Sarker, M. Z. I., Rahman, N. N. N. A., Akand, M. J.
H., Ghafoor, K., Awang, M. B. and Kadir, M. O. A., “Supercritical Carbon Dioxide Extraction of Oil from Thunnus Tonggol Head
by Optimization of Process Parameters Using Response Surface Methodology,” Korean J. Chem. Eng., 30(7), 1466-1472(2013).
15. BoX, E. P. and Draper, R., “Empirical Model-building and Response Surface,” John wiley & Sons, New York(1987).
16. Plackett, R. L. and Bruman, J. P., “The Design of Optimum Multi- factorial Experiments,” J. Biosci. Bioeng., 33, 305-325(1946).
17. Yoon, S. J., Shin, W. S., Chun, G. T. and Jeong. Y. S., “Optimization of Production Medium by Response Surface Method and Develop- ment of Fermentation Condition for Monascus Pilosus Culure,”
Korean Society for Biotechnology and Bioengineering Journal, 22, 288-296(2007).
18. Kim, Y. H., Kang, S. W., Lee, J. H., Chang, H. I., Tun, C. W., Paik, H. D., Kang, C. W. and Kim, S. W., “Optimization of Medium Com- ponents for Cell Mass Production of Saccharomyces Cerevisiae JUL3 Using Response Surface Methodology,” Korean Society for Biotechnology and Bioengineering Journal, 21, 479-483(2006).
19. Pringsheim, E. G., “Nutritional Requirements of Haematococcus pluvialis and Related Species,” J. Phycol., 2, 1-6(1966).
20. Vijayalakshmi, G., Shobha, B., Vanajakshi, V., Divakar, S. and Mano- har, B., “Response Surface Methodology for Optimization of Growth Parameters for the Production of Carotenoids by a Mutant Strain of Rhodotorula gracilis,” European Food Research and Technology, 3, 234-239(2001).
21. Chuang, Z., Lianfang, H. E. and Yucang, Z., “Optimization of Fermentation Conditions for Carotenoid Produced by Rhodotor- ula,” China Brewing, 11(2010).
22. Chandi, G. K., Singh, S. P., Gill, B. S., Sogi, D. S. and Singh, P.,
“Optimization of Carotenoids by Rhodotorula gracilis,” Food Science and Biotechnology, 19, 881-887(2010).