Serum Cystatin C Is a Major Predictor of Vancomycin Clearance in a Population Pharmacokinetic Analysis of Patients with
Normal Serum Creatinine Concentrations
We developed a population pharmacokinetic model of vancomycin by integrating the effects of cystatin C and other demographic factors in a large population of Korean patients with normal serum creatinine concentrations to elucidate the precise role of serum cystatin C concentrations in the prediction of vancomycin clearance. A population pharmacokinetic model of vancomycin was developed using NONMEM software from a total of 1,373 vancomycin concentration measurements in 678 patients whose serum creatinine concentrations were lower than 1.2 mg/dL. Covariate selection revealed that cystatin C was the most influential factor and had negative influence (−0.78) in the relationship. Total body weight, sex, age, and serum creatinine were also significantly correlated with the clearance. The estimated intersubject variabilities of clearance and volume of distribution were 24.7% and 25.1%, respectively. A 14-fold difference in predicted trough concentrations was observed according to only cystatin C concentrations in a population of simulated individuals with median demographic characteristics. The use of serum cystatin C as marker of vancomycin clearance for more accurate predictions of serum vancomycin concentrations could be useful, particularly among patients with normal serum creatinine concentrations.
Key Words: Vancomycin; Cystatin C; Pharmacokinetics; NONMEM; TDM Jae-Yong Chung,1 Sung-Joon Jin,2
Ji-Hyun Yoon,2 and Young-Goo Song2
1Department of Clinical Pharmacology and Therapeutics, Seoul National University College of Medicine and Bundang Hospital, Seongnam;
2Department of Internal Medicine, Yonsei University College of Medicine and Gangnam Severance Hospital, Seoul, Korea
Received: 25 May 2012 Accepted: 15 November 2012 Address for Correspondence:
Young-Goo Song, MD
Department of Internal Medicine, Yonsei University College of Medicine, Gangnam Severance Hospital, 211 Eonju-ro, Gangnam-gu, Seoul 135-720, Korea
Tel: +82.2-2019-3319, Fax: +82.2-3463-3882 E-mail: imfell@yuhs.ac
http://dx.doi.org/10.3346/jkms.2013.28.1.48 • J Korean Med Sci 2013; 28: 48-54
INTRODUCTION
Vancomycin is commonly used to treat methicillin-resistant Staphylococcus aureus (MRSA) infection, and its use has in- creased with the prevalence of MRSA infection (1). Vancomycin has a narrow therapeutic range, and its concentration-effect and concentration-toxicity relationships are generally estab- lished. Therefore, it is appropriate that the therapy is guided by therapeutic drug monitoring (TDM) (2, 3). Vancomycin is pri- marily eliminated via the kidneys, and thus, renal function is an important factor in deciding the dosing regimen of vancomy- cin. Serum creatinine (SCr) concentrations have been widely used as markers for renal function. However, SCr concentra- tions may not accurately reflect the renal function in some pa- tients such as elderly patients or those low muscle mass or my- opathy. It leads to the overestimation of the glomerular filtra- tion rate (GFR) represented by creatinine clearance, and the possibility of renal toxicity due to overdose would be increased in these cases (4, 5).
Cystatin C is a low-molecular-weight protein that is stably produced in the body and has been proposed as an alternative endogenous marker of glomerular filtration. It is the product of
a housekeeping gene expressed in all nucleated cells and there- fore exhibits a stable production rate, even in the presence of an acute inflammatory response (6, 7), irrespective of muscle mass, gender, and body weight. Thus, cystatin C has many of the char- acteristics of an ideal endogenous GFR marker. Recent investi- gations have indicated that cystatin C may be superior to SCr as a GFR marker (6). Vancomycin clearance (CL) is better corre- lated with cystatin C, especially in elderly or critically ill patients (8-10). Our previous study also found that vancomycin concen- tration was better correlated with serum cystatin C than serum creatinine concentration in elderly patients (11). Although data from a small number of patients in the previous study were also included in this study, the purpose and methods of these two studies are significantly different from each other. The previous study was for simple correlation between vancomycin concen- trations and two biomarkers (creatinine and cystatin C) of renal function in elderly patients. On the basis of the results of our previous study, we could plan for this population pharmacoki- netics (PK) modeling study using cystatin C in general patient population.
Although the role of cystatin C in vancomycin PK is estab- lished, no validated population PK model to describe the over-
all impact of cystatin C together with other demographic or clin- ical sources of variability of vancomycin PK is available. If an in- tegrated model with high predictive performance is developed, a more valuable basis for selecting a dosing regimen would be available. One reported study described a population PK ap- proach with cystatin C in Japanese patients; however, this study only included data from 78 patients and only trough concentra- tions, and analysis for other covariates and exact quantification of the cystatin C effect were limited (12). To develop an integrat- ed model describing the effects of multiple factors and to clarify the precise impact of cystatin C, a sufficiently large population should be investigated. In addition, to avoid confounding ef- fects and interactions between cystatin C and SCr, a population with normal SCr concentrations is optimal (≤ 1.2 mg/dL).
Therefore, the present study attempted to develop an assump- tion-free integrated population PK model of vancomycin to quantify the effects of various demographic factors including cystatin C on vancomycin PK by a nonlinear mixed effect mod- eling approach in a large population of 678 Korean patients with normal SCr concentrations.
MATERIALS AND METHODS
Subjects and collection of blood samples
All data were collected from patients receiving vancomycin at a single institution from June 2006 to May 2010. We included pa- tients who were aged 18 yr or older and those whose SCr con- centrations were equal or lower than 1.2 mg/dL. Vancomycin concentrations had reached steady state in most patients. Van- comycin was dispensed in 100 mL of saline per 1,000 mg and then intravenously infused over 1 hr. After vancomycin was ad- ministered more than three times, its concentration was mea- sured. The blood samplings were performed just before the next infusion (trough) and 1 hr after completing the infusion of van- comycin (peak). Concentrations of SCr and cystatin C were mea- sured on the same day with the vancomycin concentrations.
Other clinical and demographic data were collected from the medical records of the recruited patients.
Assay of vancomycin, serum creatinine and cystatin C levels The serum concentrations of vancomycin were determined us- ing fluorescence polarization immunoassay methods (Cobas Integra 800 Analyzer, Roche, Mannheim, Germany). Serum cre- atinine concentrations were measured using Jaffe kinetic meth- od (Hitach 7600, Hitach, Tokyo, Japan). Reference ranges of SCr are 0.6-1.0 mg/dL for female and 0.8-1.3 mg/dL for male. There had been no change in standardization during the study period.
Cystatin C concentrations were measured using particle en- hanced immunoturbidimetric assay (Roche Cobas 6000, Roche, Mannheim, Germany). Human cystatin-C agglutinates with la- tex particles coated with anti-cystatin C antibodies (rabbit). The
aggregate is determined turbidimetrically at 546 nm. Reference ranges of cystatin C are 0.57-0.97 mg/L for female and 0.65-1.10 mg/L for male.
Population Pharmacokinetics analysis
The population PK model was built using the first-order con- ditional estimation with interaction method of the nonlinear mixed-effects modeling program NONMEM® (Version 7.1.0, Icon Development Solutions, Ellicott City, MD, USA) with the gfortran compiler. One- or two-compartment models were com- pared, and several error models were investigated (i.e., propor- tional, exponential, and additive random-effects models) to describe residual variability.
The clinical and demographic variables analyzed as covari- ates for potential influence on vancomycin PK were age, sex, total body weight (TBW), height, serum cystatin C concentra- tion, SCr, intensive care unit admission, and concomitant use of amikacin or furosemide. To screen the influence of covari- ates on parameter estimates, a graphic approach to exploratory data analysis and the generalized additive model (GAM) with the aid of Xpose4 were used (13). Potential covariates identified in the covariate screening step were then tested by stepwise forward selection and backward elimination using NONMEM and the PsN toolkit (14) on the criteria of the minimum objec- tive function value (OFV; −2 × the log likelihood function) with significance set at P < 0.01 (forward) and P < 0.001 (backward).
The final model was evaluated by goodness of fit plots be- tween the predicted and observed values, performing a numer- ical predictive check (NPC) and a bootstrap analysis using the PsN toolkit. The NPC generated 1,000 simulated concentration sets according to the final model, calculated the percentage of observations lying outside of their prediction intervals, and com- pared the values with the expected number. The 95% confidence intervals for the expected number of observations lying outside their prediction intervals were also computed. The nonparamet- ric bootstrap (15) analysis consisted of repeated 1,000 NONMEM runs with random sampling from the original data set. The boot- strap median parameter values and 95% percentile intervals were compared with those estimated from the original data set using the final model. The predictive performance was evaluat- ed by the mean prediction error (MPE, prediction error = ([pre- diction-observation]/observation) and mean absolute predic- tion error (MAPE) of the population and individual predictions, which were measurements for bias and precision, respectively.
The shrinkages of both empirical Bayes estimates (EBEs) and residual errors were calculated by 1−SD × (EBEs)/Intersubject variability, and 1−SD × individual weighted residual (IWRES), respectively.
Finally, given the estimated parameter, simulations were per- formed to describe the time course of the steady-state vanco- mycin concentration profiles following the administration of
1,000 mg of vancomycin q 12 hr according to various cystatin C concentrations (0.4-3.0 mg/L) in a patient group having typical demographic characteristics or representative low and high clearance (CL) groups to depict how the covariate changes con- tributed to the concentration profiles of vancomycin.
Ethics statement
This retrospective study was reviewed and approved by the in- stitutional review board at Gangnam Severance Hospital of the Yonsei University Health System in Seoul, Korea (Reg. No. 3-2011- 0106). The board waived the requirements to obtain informed consents. All procedures were conducted in accordance with the guidelines of the Declaration of Helsinki.
RESULTS
Clinical data description
Patient characteristics are listed in Table 1. A total of 1,373 van- comycin concentration measurements in 678 patients were used to develop the model. The median vancomycin dosage was 2,000 mg/day, and most patients (89%) were treated with 1,000-2,000 mg/day.
Population PK modeling
Both one- and two-compartment models were applied. OFV was lower in the two-compartment model; however, the covari- ance step failed, and even minimization was terminated depend- ing on the structure of intersubject variability (ISV) parameters.
The parameter estimates were unrealistic for both the central and peripheral compartment volumes of distribution (36.5 and 210 L, respectively) regardless of error model, revealing over- parameterization probably because most of the data consisted of only one peak and one trough concentration per patient. In addition, simpler structural model would be more desirable for
covariate model analysis (16). Therefore, the one-compartment model with zero-order intravenous input and first-order elimi- nation was assumed to adequately describe serum vancomycin concentrations.
The numbers of potential covariates detected by GAM analysis were seven for CL and five for V (volume of distribution). Using these potential covariates, stepwise covariate model searching was performed by forward selection and backward elimination.
The final model was described by five covariates (age, TBW, cystatin C, SCr, and sex) for CL and three covariates (age, TBW, and sex) for V. We considered the creatinine clearance (CLCR) calculated by the Cockcroft and Gault method as a covariate, but this did not significantly improve OFV. The Cockcroft and Gault method also has components of creatinine concentration and demographic data, and thus, we omitted this variable to avoid a redundant covariate model structure. Cystatin C was found to be the most influential covariate, and it decreased OFV by 428.3. The relationship with CL was better described by a power model, and the rest of the variables had linear relation- ships. The parameter values for the proposed final model are summarized in Table 2. In this model, the primary PK parame- ters, CL and V, are expressed as follows:
CL = 4.9 × (1 − 0.0042 × [age - 57]) × (1 + 0.00997 × [TBW − 60.8]) × (1 − 0.322 × [SCr − 0.8]) × (cystatin C/0.91)−0.78 L/h (if female, apply 0.85)
V = 46.2 × (1 + 0.0058 × [age - 57]) × (1+ 0.00661 × [TBW − 60.8]) L (if female, apply 0.881).
Compared to the base model, the estimated unexplained ISV of CL and V expressed as coefficients of variation (CVs) were
Table 1. Characteristics of patients
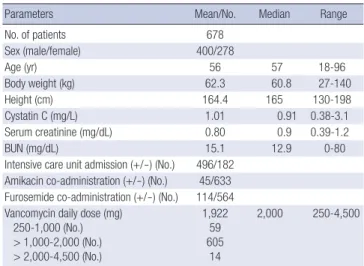
Parameters Mean/No. Median Range
No. of patients 678
Sex (male/female) 400/278
Age (yr) 56 57 18-96
Body weight (kg) 62.3 60.8 27-140
Height (cm) 164.4 165 130-198
Cystatin C (mg/L) 1.01 0.91 0.38-3.1
Serum creatinine (mg/dL) 0.80 0.9 0.39-1.2
BUN (mg/dL) 15.1 12.9 0-80
Intensive care unit admission (+/-) (No.) 496/182 Amikacin co-administration (+/-) (No.) 45/633 Furosemide co-administration (+/-) (No.) 114/564 Vancomycin daily dose (mg)
250-1,000 (No.) > 1,000-2,000 (No.) > 2,000-4,500 (No.)
1,922 59 605
14
2,000 250-4,500
BUN, Blood Urea Nitrogen.
Table 2. Parameter estimates and bootstrap analysis of the final model Parameters* Estimate (RSE†) Median (95% CI) by Bootstrap‡ CLPOP (L/h)§ 4.90 (1.5%) 4.90 (4.77-5.05) VPOP (L)§ 46.2 (1.6%) 46.2 (44.9-47.7)
θCLage -0.00420 (18.2%) -0.00427 (-0.00576--0.00276)
θCLTBW 0.00997 (8.8%) 0.00994 (0.00823-0.0116)
θCLSCr -0.322 (17.1%) -0.321 (-0.428--0.212)
θCLcystatin -0.780 (5.3%) -0.776 (-0.850--0.701)
θCLsex -0.150 (13.5%) -0.151 (-0.190--0.107)
θVage 0.00580 (12.3%) 0.00579 (0.00438-0.00715) θVTBW 0.00661 (15.9%) 0.00665 (0.00437-0.0087) θVsex -0.119 (20.5%) -0.119 (-0.166--0.0722) ISV_CL† (%) 24.7 (26.2%) 24.7 (23.0-26.3) ISV_V† (%) 25.1 (37.3%) 25.0 (21.0-28.4) Residual variability
Additional error (mg/L) Proportional error†
1.40 (12.9%) 6.39% (22.8%)
1.39 (0.904-1.70) 6.48% (3.15%-9.25%)
OFV 5316.986 5295.906 (5160-5440)
*CL, clearance; V, volume of distribution; ISV, unexplained intersubject variability;
OFV, objective function value; CL = CLPOP× (1 + θCLage× [age-57]) × (1 + θCLTBW× [TBW-60.8]) × (1 + θCLSCr× [SCr-0.8]) × (Cystatin C/0.91)θCLcystatin, (if female, apply 1+
θCLsex); V = VPOP× (1 + θVage× [age-57]) × (1+ θVTBW× [TBW-60.8]), (if female, apply 1+θVsex); †Expressed as a coefficient of variation; RSE, % relative standard error of the estimate; ‡Statistics from 1,000 bootstrap replicates; CI, confidence interval;
§Median population value.
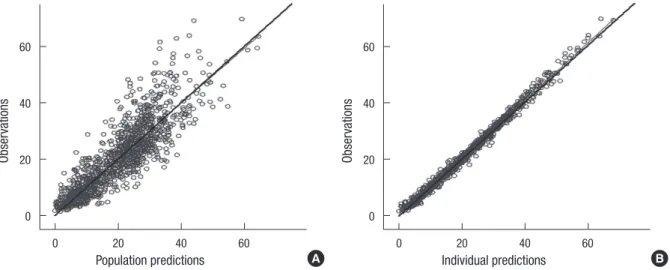
reduced from 44.4% and 28.6% to 24.7% and 25.1%, respective- ly. When only cystatin C was used as a covariate in the model, unexplained ISV of CL was reduced to 31.1%. Plots of model- predicted versus observed concentrations based on population and individual parameter estimates of the final model are shown in Fig. 1. The residual error based goodness-of-fit plots (IWRES versus individual prediction, conditional weighted residual ver- sus time, and others) were visually checked and acceptable (fig- ure not shown). The shrinkage for EBEs and residual errors were as follows: shrinkage (EBE_CL) = 5.8%, shrinkage (EBE_V) = 17.3%, and shrinkage (IWRES) = 48.3%.
Model evaluation
The robustness of the final model was evaluated by a bootstrap
analysis (1,000 replicates). The final parameter estimates and results of the bootstrap procedure are shown in Table 2. The population estimates of the final model were very close to the median of the nonparametric bootstrap replicates, and all esti- mates were included within the 95% confidence intervals. NPCs of the data exhibited good predictive performance with a slight overprediction at the upper limit of the 95th percentile predic- tion interval (Fig. 2). The population-predicted concentrations were unbiased, with an MPE of 4.6% and a precision (estimated by the MAPE) of 25.8%. Using individual predicted concentra- tions, the bias and precision were 0.1% and 5.9%, respectively.
Prediction of vancomycin concentration in various groups of patients
Predicted steady-state time-concentration profiles of vancomy- cin after 1,000 mg q 12 hr administrations were simulated using the final model in patients with normal SCr concentration (≤ 1.2 mg/dL) (Fig. 3). In patients with typical demographic character- istics (age = 57 yr, TBW = 60.8 kg, male, SCr = 0.8 mg/dL), the predicted vancomycin trough concentrations were 2.4-33.8 mg/
L (14-fold) for cystatin C concentrations ranging from 0.4 to 3.0 mg/L. The trough and peak concentrations in the representa- tive high-CL group (CL = 10.9 L/h and V = 45.7 L by age = 20 yr, TBW = 100 kg, male, cystatin C = 0.4 mg/L, and SCr = 0.6 mg/
dL) were 0.4 and 18.7 mg/L, respectively, and those of the low- CL group (CL = 1.7 L/h and V = 41.8 L by age = 90 yr, TBW = 40 kg, female, cystatin C = 3.0 mg/L, and SCr = 1.2 mg/dL) were 85.2 and 107.1 mg/L, respectively, which were 213- and 5.7-fold changes, respectively, than those in the high-CL group. Even at the same cystatin C concentration of 3.0 mg/L, the low-CL group exhibited a 250% higher trough concentration (85.2 mg/L) than the typical population group (33.8 mg/L).
Fig. 1. Goodness of fit evaluated by the plots of (A) population prediction versus observed vancomycin concentration (mg/L) and (B) individual prediction versus observed van- comycin concentration (mg/L). Solid lines are the linear regression line from the data (thick) or the line of identity (thin).
Observations
Population predictions
0 20 40 60
60
40
20
0
A
Observations
Individual predictions
0 20 40 60
60
40
20
0
B
Fig. 2. Results of the numerical predictive check. The connected black dots represent the ratio of the number of observations that are outside their own prediction intervals to the expected number (e.g., 10% of the data are expected to be outside a 90% pre- diction interval, 5% above and 5% below). The dotted lines represent the 95% confi- dence intervals for this ratio given the correct model.
Observed/Expected
1.4
1.0
0.6
1.4
1.0
0.6
Predication interval
10 30 50 70 90
Upper PI Limit
Lower PI Limit
DISCUSSION
In this study, we developed an integrated population PK model of vancomycin that quantifies the cystatin C effect as well as sig- nificant demographic data in adult patients with normal SCr concentrations. The model indicates that cystatin C has a close relationship with vancomycin CL with an inverse power of -0.78.
This reciprocal relationship has been reported previously for cystatin C and GFR (17, 18). Other continuous demographic variables centered on their populzation median values have linear relationships within the observed range. Age and SCr had negative and TBW had a positive relationship with CL. Fe- males have 15% lower clearance, which is in line with the Cock- croft and Gault equation (19).
The influence of each continuous covariate on PK parame- ters was calculated by the maximum percent difference of the parameter using the marginal or median values from the equa- tions of the final model. The order of the difference size was as follows: for CL, cystatin C (62%) > TBW (34%) > age (17%) > sex (15%) > SCr (13%); and for V, TBW (52%) > age (23%) > sex (12%).
Cystatin C is the most influential factor for vancomycin CL and has an approximately 5-fold greater effect than SCr. TBW was also an important covariate for both CL and V. As only 33 pa- tients (4.9%) were clinically obese (body mass index > 30 kg/m2), using ideal body weight or lean body weight instead of TBW in the population PK analysis did not improve the fitting signifi- cantly, which was consistent with other studies, and the actual TBW is usually recommended for dosage adjustment for van- comycin TDM (20). Simulation analysis indicated that a 14-fold difference in the trough concentrations (2.4-33.8 mg/L) of van- comycin was observed according to only cystatin C concentra- tions at the same dosage of vancomycin. Using other demo-
graphic factors together, our model could predict a wider range of trough concentrations of 0.4-85.2 (213-fold) in representative cases of high- or low-CL patients as expected.
There was good agreement between the predicted and ob- served values from a visual exploration. The predictive perfor- mance of the model, expressed as bias and precision, were less than 5 and 30%, respectively, in the population prediction. This is clinically acceptable considering the errors from assay and/or clinical procedures in routine care settings. The NPC failed only at the upper limit of the 95% interval. This means that in some cases, very high concentrations mainly consisting of peak con- centrations were not predicted well. This is possibly due to the estimation problem regarding V by a one-compartmental mod- el. ISV for V was also imprecisely estimated with a standard error of 37%. In these sparse data from routine clinical practice, V is generally not precisely estimated relative to CL estimation as reported previously (21, 22). Limited samples permit only one- compartment modeling, although two-compartment modeling is considered more realistic for vancomycin PK (23, 24). How- ever, this model can provide results representative of the popu- lation studied because a large number of patients were analyzed.
In addition, the treatment outcome of vancomycin is mainly correlated to vancomycin trough concentrations, and thus, we believe that the application of this model will be possible for routine clinical care with minor exceptions at very high concen- trations.
The extent of the shrinkage of IWRES was moderate (48%), but it is considered acceptable because the observations con- sisted of sparse routine clinical data. The most problematic situ- ation of the epsilon shrinkage is model misspecification (25).
However, the impact of model misspecification was low because there was substantial evidence of one-compartmental analysis Fig. 3. Predicted steady-state vancomycin concentration during and after the administration of 1,000 mg of vancomycin q 12 hr when only cystatin C changed in patients with typical demographic characteristics (A) and in representative patients with low (CL = 1.7 L/h and V = 41.8 L) or high (C L= 10.9 L/h and V = 45.7 L) vancomycin clearance calculated by their covariates (B).
Vancomycin concentration (mg/L)
Time (hr)
Low CL High CL
0 50 100 150
100
80
60
40
20
0
B
Vancomycin concentration (mg/L)
Time (hr)
10 30 50 70
60
40
20
0
A
Cystatin C = 0.4 mg/L Cystatin C = 0.9 mg/L Cystatin C = 2.0 mg/L Cystatin C = 3.0 mg/L
of vancomycin PK with routine TDM data, and the estimated values of PK parameters were similar to those of our model (12, 21, 26, 27). Moreover, there was similarity in the PK parameters across different ethnic groups. We believe that our results can be generalized to other ethnic groups, although confirmation is needed.
In linking the pharmacodynamics with the PK of vancomy- cin, an AUC24/MIC value of at least 400 was proposed for the treatment of invasive MRSA in vancomycin practice guidelines (20). The AUC24/MIC values of individual patients were ob- tained using the model with an estimated AUC24 (daily dose di- vided by CL) and an MIC of 1 mg/L. In total, 362 out of 678 pa- tients (53.4%) had AUC24/MIC values above the target of 400.
Trough concentrations (Ctrough) were also predicted, and the numbers of patients with Ctrough< 5, 5 - < 20, and ≥ 20 mg/L were 154 (22.7%), 465 (68.6%), and 59 (8.7%), respectively. In this post hoc analysis, when the Ctrough is higher than 10 mg/L (259 patients), the percentage of patients with AUC24/MIC ≥ 400 was 99.6% (258 out of 259). However, for patients with Ctrough of 5-10 mg/L, only 39.1% (101/265) of patients achieved the target AUC24/MIC, and thus, the possibility of treatment failure is in- creased in this concentration range. As a surrogate marker to predict the target AUC24/MIC, maintaining a Ctrough≥ 10 mg/L would be proposed in this population.
This is the first study to analyze the actual effect of cystatin C by integrated population PK modeling of vancomycin with full evaluation of covariates in a large population. Modeling was done in assumption-free conditions: no GFR estimation, no cal- culated demographic factors, and no restriction to steady-state concentrations. All covariates had a direct relationship with each PK parameter. A large pool of data rendered the estimation er- rors very small for the population PK parameters and the effects of covariates, which were consistently observed in a nonpara- metric bootstrap analysis.
Our study has some limitations. First, the model has not been evaluated by external data. Although measuring vancomycin concentration itself at peak and trough is the best validated pre- dictor of clinical response and toxicity, we believe the dosing guide using our model is applicable if it can reliably predict peak and trough concentrations and AUC24/MIC values before the initiation of therapy and thus lead to improved treatment out- comes. To accomplish this, the predictive performance of the model should be validated using an external dataset, and the treatment outcomes need to be confirmed. Second, the clinical utility of the model is limited. It is necessary to further study how well the AUC24/MIC values obtained through our model reflect the treatment outcome in patients with MRSA bacteremia us- ing the real MIC values prospectively. It is also necessary to in- vestigate the difference between the calculated AUC24 based on the conventional SCr value and our cystatin C model and clarify how these differences affect the determination of vancomycin
dosage. Third, this model is focusing on the patients with SCr
≤ 1.2 mg/dL, so its utility to renal impairment patients outside this range (about 20% in our internal data) would be limited.
In conclusion, the population PK model of vancomycin in relation to cystatin C was developed for Korean patients. There was considerable variability in vancomycin concentrations even among normal SCr concentrations. Cystatin C concentrations reflect vancomycin CL better than SCr concentrations and play a major role in explaining this variability. Measuring cystatin C concentrations is recommended for the optimal dosage selec- tion of vancomycin based upon our population PK model among patients with normal SCr concentrations. Furthermore, cystatin C would be a good marker for dose adjustment when TDM is performed for drugs that are excreted mainly by the kidneys, which needs to be confirmed clinically in a prospective study.
ACKNOWLEDGMENTS
The authors have no conflicts of interest directly relevant to the content of this study. We would like to thank the TDM Team at Gangnam Severance Hospital for assistance with data collection.
REFERENCES
1. Appelbaum PC. Microbiology of antibiotic resistance in Staphylococcus aureus. Clin Infect Dis 2007; 45 Suppl 3: S165-70.
2. Iwamoto T, Kagawa Y, Kojima M. Clinical efficacy of therapeutic drug monitoring in patients receiving vancomycin. Biol Pharm Bull 2003; 26:
876-9.
3. MacGowan AP. Pharmacodynamics, pharmacokinetics, and therapeu- tic drug monitoring of glycopeptides. Ther Drug Monit 1998; 20: 473-7.
4. Caregaro L, Menon F, Angeli P, Amodio P, Merkel C, Bortoluzzi A, Al- berino F, Gatta A. Limitations of serum creatinine level and creatinine clearance as filtration markers in cirrhosis. Arch Intern Med 1994; 154:
201-5.
5. Ross EA, Wilkinson A, Hawkins RA, Danovitch GM. The plasma creati- nine concentration is not an accurate reflection of the glomerular filtra- tion rate in stable renal transplant patients receiving cyclosporine. Am J Kidney Dis 1987; 10: 113-7.
6. Dharnidharka VR, Kwon C, Stevens G. Serum cystatin C is superior to serum creatinine as a marker of kidney function: a meta-analysis. Am J Kidney Dis 2002; 40: 221-6.
7. Filler G, Bokenkamp A, Hofmann W, Le Bricon T, Martinez-Bru C, Grubb A. Cystatin C as a marker of GFR--history, indications, and future re- search. Clin Biochem 2005; 38: 1-8.
8. Hermida J, Tutor JC. Serum cystatin C for the prediction of glomerular filtration rate with regard to the dose adjustment of amikacin, gentami- cin, tobramycin, and vancomycin. Ther Drug Monit 2006; 28: 326-31.
9. Okamoto G, Sakamoto T, Kimura M, Ukishima Y, Sonoda A, Mori N, Kato Y, Maeda T, Kagawa Y. Serum cystatin C as a better marker of van- comycin clearance than serum creatinine in elderly patients. Clin Bio- chem 2007; 40: 485-90.
10. Suzuki A, Imanishi Y, Nakano S, Niwa T, Ohmori T, Shirai K, Yoshida S,
Furuta N, Takemura M, Ito H, et al. Usefulness of serum cystatin C to de- termine the dose of vancomycin in critically ill patients. J Pharm Phar- macol 2010; 62: 901-7.
11. Jin SJ, Bae SC, Kim HW, Kim HK, Na EJ, Ahn BS, Choi JY, Kim CO, Kim JM, Song YG. Evaluation of the effect of initial dose of vancomycin using serum cystatin C as a marker in elderly patients. Infect Chemother 2009;
41: 224-9.
12. Tanaka A, Aiba T, Otsuka T, Suemaru K, Nishimiya T, Inoue T, Murase M, Kurosaki Y, Araki H. Population pharmacokinetic analysis of vancomy- cin using serum cystatin C as a marker of renal function. Antimicrob Agents Chemother 2010; 54: 778-82.
13. Jonsson EN, Karlsson MO. Xpose--an S-PLUS based population phar- macokinetic/pharmacodynamic model building aid for NONMEM.
Comput Methods Programs Biomed 1999; 58: 51-64.
14. Lindbom L, Pihlgren P, Jonsson EN. PsN-Toolkit--a collection of com- puter intensive statistical methods for non-linear mixed effect modeling using NONMEM. Comput Methods Programs Biomed 2005; 79: 241-57.
15. Parke J, Holford NHG, Charles BG. A procedure for generating bootstrap samples for the validation of nonlinear mixed-effects population mod- els. Comput Methods Programs Biomed 1999; 59: 19-29.
16. Wade JR, Beal SL, Sambol NC. Interaction between structural, statisti- cal, and covariate models in population pharmacokinetic analysis. J Pharmacokinet Biopharm 1994; 22: 165-77.
17. Nielsen EI, Sandstrom M, Honore PH, Ewald U, Friberg LE. Develop- mental pharmacokinetics of gentamicin in preterm and term neonates:
population modelling of a prospective study. Clin Pharmacokinet 2009;
48: 253-63.
18. Hoek FJ, Kemperman FA, Krediet RT. A comparison between cystatin C, plasma creatinine and the Cockcroft and Gault formula for the estima- tion of glomerular filtration rate. Nephrol Dial Transplant 2003; 18:
2024-31.
19. Cockcroft DW, Gault MH. Prediction of creatinine clearance from serum creatinine. Nephron 1976; 16: 31-41.
20. Martin JH, Norris R, Barras M, Roberts J, Morris R, Doogue M, Jones GR.
Therapeutic monitoring of vancomycin in adult patients: a consensus review of the American Society of Health-System Pharmacists, the Infec- tious Diseases Society of America, and the Society of Infectious Diseases Pharmacists. Clin Biochem Rev 2010; 31: 21-4.
21. Buelga DS, del Mar Fernandez de Gatta M, Herrera EV, Dominguez-Gil A, Garcia MJ. Population pharmacokinetic analysis of vancomycin in patients with hematological malignancies. Antimicrob Agents Chemother 2005; 49: 4934-41.
22. Llopis-Salvia P, Jimenez-Torres NV. Population pharmacokinetic pa- rameters of vancomycin in critically ill patients. J Clin Pharm Ther 2006;
31: 447-54.
23. Sanchez JL, Dominguez AR, Lane JR, Anderson PO, Capparelli EV, Cornejo-Bravo JM. Population pharmacokinetics of vancomycin in adult and geriatric patients: comparison of eleven approaches. Int J Clin Pharmacol Ther 2010; 48: 525-33.
24. Thomson AH, Staatz CE, Tobin CM, Gall M, Lovering AM. Development and evaluation of vancomycin dosage guidelines designed to achieve new target concentrations. J Antimicrob Chemother 2009; 63: 1050-7.
25. Savic RM, Karlsson MO. Importance of shrinkage in empirical bayes es- timates for diagnostics: problems and solutions. AAPS J 2009; 11: 558-69.
26. Ducharme MP, Slaughter RL, Edwards DJ. Vancomycin pharmacoki- netics in a patient population: effect of age, gender, and body weight.
Ther Drug Monit 1994; 16: 513-8.
27. Yasuhara M, Iga T, Zenda H, Okumura K, Oguma T, Yano Y, Hori R. Pop- ulation pharmacokinetics of vancomycin in Japanese adult patients.
Ther Drug Monit 1998; 20: 139-48.