2004, Vol. 48, No. 3
Printed in the Republic of Korea
액정올리고머에 있는 카보닐그룹들의 동적순서에 대한 2 차원 라만상관분광법 연구
정갑상·유수창·한건옥*
군산대학교 자연과학대학 화학과 (2004. 5. 19 접수)
Determining the Dynamic Sequence of Carbonyl Groups in a Rod-Coil Liquid Crystalline Oligomer Using Two-Dimensional Raman Correlation Spectroscopy
Kabsang Jung, Soo-Chang Yu, and Keunok Han Yu*
Department of Chemistry, Kunsan National University, Chonbuk 573-701, Korea (Received May 19, 2004)
요 약. 12-4라는 액정올리고머가 액정이 되는 과정에서 일어나는 동력학을 2차원 라만상관분광법을 이용하여 연구 하였다. 분광법의 결과로부터 에틸그룹 옆에 붙어있는 자유 카보닐 그룹이 먼저 움직이고, 수소결합을 이룬 카보닐 그룹 이 나중에 움직인다는 것을 알아내었다. 반면에 바이페닐그룹사이에 존재하는 자유 카보닐 그룹은 좀처럼 움직이지 않는 것으로 나타났다. 샘플-샘플상관분광법의 결과로부터는 액정이 되는 온도 135oC 보다 훨씬 낮은 온도인 50oC에서 이 미 카보닐 그룹의 움직임이 있음을 알 수 있었다.
주제어: 2차원 라만상관분광법, 액정올리고머, 동력학, 카보닐그룹
ABSTRACT. We investigated the order of local movement of functional groups (-C(=O)O) in a liquid crystalline (LC) oligomer (12-4) using 2D Raman correlation spectroscopy. The results suggest that the free carbonyl near the ethyl ter- minal group moved first, followed by the hydrogen-bonded group. The free carbonyl group between the biphenyl groups rarely moved. Interestingly, 2D sample-to-sample correlation spectroscopy (2D STSCS) revealed that some of the car- bonyl modes started to move at far below (50oC) the LC temperature (135oC), countering conventional beliefs.
Keywords: 2D Raman Correlation Spectroscopy, Liquid Crystalline Oligomer, Dynamics, Carbonyl Group
INTRODUCTION
Liquid crystalline polymers (LCPs) containing an ester functional group in a mesogenic unit have long been the subject of studies of intermolecular interactions. Many theoretical and experimental works have examined the planarity of the benzene rings and adjacent carbonyl groups, and the site of bond rotation near the phase transition (solid-to-liq- uid crystal) temperature.1-3 We recently character- ized an LC oligomer with a biphenyl ester moiety using Raman spectroscopy to better understand the
mechanism of the conformational change that accompanies modification of the intermolecular interactions.4,5
In order to understand the mechanism of the con- formational changes during the phase transition, we compared the spectral evolution of the combination mode of the aromatic C-C(=O)O and C(=O)O stretch- ing vibrations at 1274 cm−1 with those of analogous molecules as a function of temperature, and found that bond rotation occurs around the aromatic C and the C(=O)O near the ethyl terminal. This bond rota- tion is thought to be facilitated mainly by cleavage
of the hydrogen bond between the carbonyl oxygen near the ethyl terminal and one of the hydrogen atoms in the poly(ethylene oxide) (PEO) chain.
Analysis of the C=O stretching mode allowed us to locate the carbonyl group that participated in the hydrogen bonding. Although the mechanism of the conformational changes was revealed, the local dynamics has not been analyzed fully.
Two-dimensional (2D) correlation spectroscopy is a very useful technique for analyzing the dynam- ics of molecules under various perturbations, such as temperature, time, and concentration.6-9 In brief, there are two components in 2D spectroscopy, one of which is called synchronous v (designated Φ (v1, v2)) and the other asynchronous (designated Ψ [v1, v2]). The synchronous spectrum represents simulta- neous or coincidental changes at variables v1 and v2, while the asynchronous spectrum provides informa- tion about the order or priority of the modes of the variables. This technique simplifies complex spec- tra with many overlapping peaks and enhances the spectral resolution by spreading the peaks over a second dimension, identifying various inter- and intramolecular interactions from the selective corre- lation peaks.
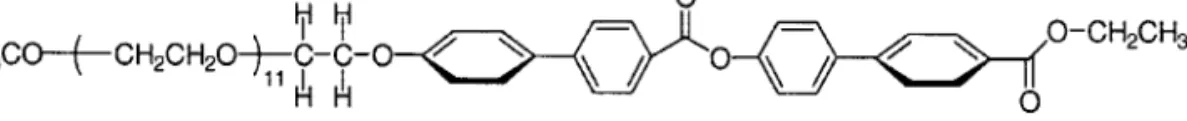
We sought insights into the dynamics of LC oli- gomer 12-4 (Fig. 1) near the transition temperature using 2D Raman correlation spectroscopy. We investigated the order of local movement of func- tional groups (-C(=O)O), which determines the LC phase transition temperature.
EXPERIMENTAL
The details of the synthesis and characterization of 12-4 were reported previously.4 The crystalline- to-LC phase transition temperature (heating at a rate of 10oC min−1) was observed at 135.2oC, using a Perkin Elmer DSC-7 differential scanning calorim- eter (DSC) equipped with a 1020 thermal analysis
controller.
The Raman spectra were obtained using a Renishaw Raman microsystem 2000 with excitation at the 632.8-nm line of a HeNe laser. The laser power at the sample was ca. 5 mW and the resolution of the spectra was ±2 cm−1. After the samples were put on glass slides, data were acquired using a Linkam heating and freezing stage (THMSE 600) with a controller (TMS 92), and then calibrated to the sili- con band at 521 cm−1.
Prof. Yukihiro Ozaki at Kwansei Gakuin Univer- sity in Japan kindly provided the analysis software for 2D correlation spectroscopy. The program was written using MATLAB 5.3 following the algo- rithm developed by I. Noda.
RESULTS AND DISCUSSION
Information on the dynamics of carbonyl groups is critical for understanding the conformational changes in a LC oligomer at the crystal-to-LC tem- perature. In order to understand this, various LC polymers have been studied.4,5,10 In 12-4, one of the carbonyl modes forms hydrogen bonds with a hydrogen in the poly(ethylene oxide) group in the neighboring molecule.4,5 When hydrogen bonding occurs, a new band appears at 1725 cm−1 giving three bands (1717, 1725, 1734 cm−1). As the tem- perature increases, the hydrogen bond breaks up gradually, giving two bands. The changes in the intermolecular interaction with increasing tempera- ture were deduced by monitoring three complemen- tary Raman modes, i.e., the C=O, C=C, and aromatic C-H vibrational modes. However, we could not obtain information on local movement of a specific functional group using one-dimensional (1D) Raman spectroscopy. Therefore, it was necessary to explore the dynamics using 2D correlation spectroscopy.
Two-dimensional Raman correlation spectra in the carbonyl region were obtained from 1D Raman
Fig. 1. The chemical structure of 12-4.
spectra5 and are shown in Fig. 2(a) and (b). They show three carbonyl modes, at 1711, 1724, and 1736 cm−1, which are assigned to the free carbonyl between biphenyl moieties, the hydrogen bonded carbonyl, and the free carbonyl next to the ethyl ter- minal group, respectively, based on the 1D Raman spectrum.5
Peaks with positive and negative signs are repre- sented by white and shaded contours, respectively.
Referring to the 2D correlation rules, a positive sign indicates that the intensities of the corresponding
bands in the one-dimensional spectra are either increasing or decreasing together, while a negative sign indicates that one is increasing and the other is decreasing. Negative cross peaks appearing at (1736, 1724) are seen in the synchronous spectrum in Fig. 2(a) and suggest that the two modes behave in opposite directions, as already observed in 1D Raman spectra. The cross peaks at (1736, 1711) and (1724, 1711) in the asynchronous spectrum are not seen in the synchronous spectrum. Referring to the 1D Raman spectra, the mode at 1724 cm−1 decreased with increasing temperature, while the intensity of the mode at 1711 cm−1 remained constant. This indicates that the intensity at 1711 cm−1 increased relatively. Likewise, the relative intensity at 1736 cm−1 increased, while the mode at 1711 cm−1 decreased.
In the asynchronous spectrum (Fig. 2(b)), we are concerned with the cross peaks at (1736, 1711), (1736, 1724), and (1724, 1711). The asynchronous correlation peak Ψ[v1, v2] provides information about the sequential order of the changes in the variables v1 and v2. A positive cross peak in an asyn- chronous spectrum indicates that v1 occurs predom- inantly before v2, while a negative cross peak indicates that v2 occurs first. This rule is reversed when the sign of the corresponding cross peak in the synchronous spectrum is negative. We used this relationship to determine the sequential order of the intensity change between the two bands in the asyn- chronous spectrum.
The positive peaks positioned at (1736, 1711) in Fig. 2(b) indicate that the mode at 1736 cm−1 changed before movement of the mode at 1711 cm−1 occurred. The negative sign at (1736, 1724) indi- cates that the mode at 1724 cm−1 moves before that at 1736 cm−1. However, the sign of the synchro- nous spectrum at (1736, 1724) is negative, indicat- ing that the movement of the mode at 1736 cm−1 occurs predominantly before that at 1724 cm−1. The negative sign of the peaks at (1724, 1711) repre- sents the priority of the movement of the mode at 1711 cm−1. However, the priority is reversed based on deductions from the 1D spectra explained above.
Therefore, the order of the movement is 1736 cm−1
> 1724 cm−1 > 1711 cm−1. The carbonyl group next Fig. 2. The 2D Raman correlation spectra in the carbonyl
region, (a) synchronous and (b) asynchronous spectrum.
to the ethyl terminal (at 1736 cm−1) moves first, fol- lowed by the hydrogen-bonded one (at 1724 cm−1).
Finally, the carbonyl group between the biphenyl groups moves (at 1711 cm−1). This makes sense, because the free carbonyl groups next to the ethyl terminal are the most flexible. Then, the movement of the free carbonyl group perturbs the hydrogen- bonded carbonyl group in turn, cleaving the hydro- gen bond. The carbonyl between the biphenyl groups is very stiff compared with the free carbo- nyl next to the ethyl terminal or the hydrogen bonded one. This suggests that the movement of the carbonyl group between the biphenyl groups needs more thermal energy than the other two. These results are in good agreement with our previous results, which found that the carbonyl group at the ethyl terminal rotates at the crystalline-to-LC phase transition temperature, whereas the carbonyl group between the biphenyl groups rarely rotates.4
Mesogenic conformational changes are mostly responsible for the differences between the adja- cent crystalline polymorphs in liquid crystalline molecules.11,12 Therefore, mesogenic Raman bands reflecting mesogenic conformational changes with environmental changes, such as temperature changes, are of particular interest. Since the LC temperature of 12-4 is ca. 135oC, the movement of the carbo- nyl modes should reflect this temperature. There- fore, we monitored the movement of the carbonyl modes with increasing temperature, because they belong to the mesogenic part, which determines the LC temperature, using 2D sample-to-sample corre- lation spectroscopy (2D STSCS), which is explained elsewhere.13
Two-dimensional STSCS is a powerful tech- nique for monitoring slight changes in the intensity of a certain mode and we applied it to our system.
For comparison, we plotted 2D STSCS for the entire spectral region (360 ~ 3150 cm−1) as well as for the carbonyl region (1697~ 1755 cm−1) by obtaining spectra at temperatures from 20 to 180oC at incre- ments of 10oC. As Fig. 3 shows, an apparent change in the spectral pattern of the entire region occurred at around 130oC, which is in relatively good agree- ment with the LC temperature. However, the spec-
tral change in the carbonyl region was quite different, indicating that the local movement of the carbonyl mode does not occur at the LC tempera- ture. A marked change was observed at 50oC, indi- cating that some of the carbonyl groups start to move at far below the LC temperature of 130oC.
Generally, the PEO chain moves freely at lower temperatures than the mesogenic moieties do because of its flexible character. Therefore, the PEO chain mainly reflects the Tg temperature. Our result is quite different from this conventional concept.
The carbonyl group in the mesogenic unit moved along with the PEO coil in a concerted way.
CONCLUSIONS
We used 2D Raman correlation spectroscopy to Fig. 3. The 2D sample-to-sample correlation spectrum (a) in the whole region (360 ~ 3150 cm−1) and (b) the carbonyl region (1697~1755 cm−1). First indicates the lowest temperature while the last represents the highest temperature.
study the dynamics of 12-4 during the LC process.
The analysis of complementary synchronous and asynchronous spectra showed that the free carbo- nyl group near the ethyl terminal moved first, fol- lowed by the hydrogen-bonded one. The free carbonyl group between the biphenyl groups rarely moved. The results obtained from 2D STSCS also revealed the interesting fact that some of the carbo- nyl modes started to move at far below (50oC) the LC temperature (135oC), countering accepted belief.
REFERENCES
1. Hummel, J. P.; Flory, P. J. Macromolecules 1996, 13, 479.
2. Birner, P.; Kugler, S.; Simon K.; Naray-Szabo. Mol.
Cryst. Liq. Cryst. 1982. 80, 11.
3. del Pino, J.; Gomez, M. A.; Marco, C.; Ellis, G.; Fatou, J. G. Macromolecules 1992, 25, 4642.
4. Yu, S.-C.; Choi, Y.; Yu, K. H.; Yu, J.; Choi, H.; Kim, D.
H.; Lee, M. Macromolecules 2000, 33, 6527.
5. Yu, K. H.; Rhee, J. M.; Lim, J.-H.; Yu, S.-C. Bull.
Korean Chem. Soc. 2002, 23, 633.
6. Ren, T.; Murakami, T.; Nishioka, K.; Noda, I.; Ozki, Y.
Macromolecules 1999. 32(19), 6307.
7. Nakano, T.; Shimada, S.; Saitoh, R.; Noda, I. Appl. Spec- trosc. 1993, 47(9), 1337.
8. Noda, I. Apple, Spectrosc, 1993, 47(9), 1329.
9. Lachenal, G.; Buchet, R.; Ren, Y.; Ozki, Y. In Two- dimensional Correlation Spectroscopy; Ozaki, Y.; Noda, I., Eds.; American Institute of Physics: Melville, New York, 1999.
10. Bahadur, B. Liquid Crystals: Applications and Uses;
World Scientific Publishing Co.: Singapore, 1990.
11. Ellis, G.; Marco, C.; del Pino, J.; Lorente, J.; Gomez, M.
A.; Fatou, J. G. Vibr. Spectrosc. 1995, 9, 49.
12. del Pino, J; Gomez, M. A; Ellis, G; Marco, C.; Fatou, J. G. Macromol. Chem. Phys. 1994, 195, 2049.
13. Šašic′, S.; Muszynski, A.; Ozaki, Y. J. Phys. Chem. A 2000, 104, 6380.