INTRODUCTION
Breast cancer is the most common malignancy in women and the second leading cause of mortality worldwide (1). In Republic of Korea, breast cancer is the second most common malignancy and fifth leading cause of mortality in women (2).
It is important to detect cancer early to reduce the mortality rate, and this requires an accurate and reliable diagnostic meth- od. In clinical practice, breast ultrasound (US) is an important modality for detecting breast cancer, along with mammography (3). Compared with mammography, breast US is an easily avail- able imaging tool that does not involve a radiation hazard. How- ever, operator dependency remains the main limitation (4).
From that perspective, computer-aided diagnosis (CAD) sys- tems in breast US have been developed for lesions and can characterize and improve the differentiation between benign and malignant lesions. Many studies have applied CAD systems to breast US to demonstrate the efficiency of CAD systems and to evaluate the usefulness of CAD systems for improving diag- nostic accuracy (4-11). There are two algorithms in breast US- CAD systems for lesion interpretations. One is the interpreta- tion according to the breast imaging reporting and data system (BI-RADS) lexicon, which is known as the knowledge-based analysis, and the other is the deep-learning algorithm, which is known as statistics-based analysis.
S-Detect is a recently developed CAD system for breast US
Breast Ultrasound Computer-Aided Diagnosis: Analysis of Types of Errors
유방 초음파 컴퓨터 진단: 오류 유형 분석
Min Kyung Jeong, MD
1, Bong Joo Kang, MD
2*, Eunjeong Kim, MD
2, Sung Hun Kim, MD
21Department of Radiology, St. Vincent’s Hospital, College of Medicine, The Catholic University of Korea, Suwon, Korea
2Department of Radiology, Seoul St. Mary’s Hospital, College of Medicine, The Catholic University of Korea, Seoul, Korea
Purpose: The aim of this study was to evaluate the diagnostic performance of breast ultrasound (US) computer-aided diagnosis (CAD) to distinguish between be- nign and malignant lesions and analyze features of lesions interpreted with errors retrospectively.
Materials and Methods: Three hundred and sixteen women with 375 breast lesions were enrolled. We assessed the accuracy, sensitivity, specificity, positive predictive value (PPV) and negative predictive value (NPV). Additionally, we evaluated the causes and patterns of the misinterpretation in the false positive and negative groups.
Results: The accuracy, sensitivity, specificity, PPV, and NPV of breast US-CAD were 80.3%, 83.3%, 79.8%, 37.7%, and 97.0%, respectively. There were 8 false negative lesions that were oval in shape and in parallel orientation. There were 66 false posi- tive lesions. The greatest number of errors entailed inappropriate demarcation due to heterogeneous echogenicity, etc. The second exhibited suspicious features with good demarcation and description but were confirmed as benign histologically. The third entailed a benign lesion with suspicious features, such as abscesses. The small- est portion with good demarcations and descriptions indicating benign status ex- hibited possible malignancy as a final conclusion.
Conclusion: Breast US-CAD is expected to be helpful in avoiding unnecessary biop- sies due to its high NPV. Therefore, operators need to know the characteristics of le- sions prone to misinterpretation.
Index terms Ultrasonography Breast Neoplasm
Diagnosis, Computer-Assisted
Received November 22, 2017 Revised May 2, 2018 Accepted May 31, 2018
*Corresponding author: Bong Joo Kang, MD Department of Radiology, Seoul St. Mary’s Hospital, College of Medicine, The Catholic University of Korea, 222 Banpo-daero, Seocho-gu, Seoul 06591, Korea.
Tel. 82-2-2258-6253 Fax. 82-2-599-6771 E-mail: [email protected]
This is an Open Access article distributed under the terms of the Creative Commons Attribution Non-Commercial License (https://creativecommons.org/licenses/by-nc/4.0) which permits unrestricted non-commercial use, distri- bution, and reproduction in any medium, provided the original work is properly cited.
J Korean Soc Radiol 2018;79(3):114-122 https://doi.org/10.3348/jksr.2018.79.3.114
that is based on a deep-learning algorithm that uses big data and provides assistance in morphological analysis based on the BI- RADS lexicon and final assessment (4, 12). S-Detect might be very useful in improving the diagnostic performance of breast US for assistance in either lesion detection or the decision- making process during practice. This system has been reported to improve the diagnostic performance of radiologists by prop- er application of these computer-aided programs (4, 11, 13).
Moreover, S-Detect is known as a clinically feasible diagnostic tool that can be used to improve the specificity, positive predic- tive value (PPV), and accuracy of breast US, regardless of the experience of the radiologist (9, 10). However, combining CAD with breast US is known to be more useful than CAD alone (10).
No study has analyzed the patterns of lesions that are wrongly interpreted by CAD.
Therefore, the purposes of this study were to evaluate the di- agnostic performance of the CAD system (S-Detect) and to ret- rospectively analyze the features of the lesions interpreted with errors.
MaTeRIalS aND MeThODS
This retrospective study received approval from the ethics committee of our institution, and agreement from all patients was obtained for this study (Seoul St. Mary’s Hospital, The Cath- olic University of Korea, IRB No. KC15DNSI0027).
Study Population and CAD System
Between October 2015 and August 2016, four radiologists (with 5–17 years of breast imaging experience) performed the grayscale US and applied the CAD system for the consecutive patients had undergone planned breast US for screening or di- agnostic purposes.
All suspicious or probable benign breast lesions were analyzed according to the BI-RADS lexicons and categories; therefore, lesions with BI-RADS categories 3, 4, or 5 were included. Known postoperative changes and typical multiple BI-RADS category 2 lesions were excluded in this study.
We used US (Samsung Ultrasound RS80A; Samsung Medi- son Co., Seoul, Korea), including the CAD system. When the radiologist identified the center of the breast lesion by touching the screen, a region-of-interest was automatically drawn along
the border of the mass. Several drawn borders were presented on the screen of the US, and the radiologist who performed the breast US selected the most appropriate border of the picture.
With respect to the lesion, the BI-RADS, which had US features according to the BI-RADS lexicon and final assessment classifi- cations, were automatically analyzed and demonstrated by the CAD system. In this CAD system, the final assessment classifi- cation was divided into ‘possibly benign’ and ‘possibly malig- nant’ (4, 10). The cutoff for differentiating benign and malig- nant lesions by the radiologist was set at category 4A and category 4B. Pathologically confirmed benign and malignant lesions, and lesions that were stable for more than 2 years were included. Stable lesions meant that the size and shape of the le- sions showed no significant changes for more than 2 years since the initial diagnosis on US.
Statistics
For these breast lesions, the accuracy, sensitivity, specificity, PPV, and negative predictive value (NPV) of the CAD were cal- culated. The interobserver agreement for the BI-RADS lexicon and final assessment between the radiologist and the CAD and the patterns of misinterpretation were obtained. The agreement between the lexicons in grayscale US and those in CAD were examined using the coefficient for inter-rater agreement (Co- hen kappa). The interpretation was based on the following five scales: poor (less than 0.2), fair (0.21 to 0.4), moderate (0.41 to 0.60), good (0.61 to 0.80), and very good (0.81 to 1.00) (14).
The statistical analysis was performed using the Statistical Pack- age for the Social Sciences (SPSS) statistics software 24.0 (IBM Corp., Armonk, NY, USA).
ReSUlTS
All 375 breast lesions in 316 patients (mean age, 48.8 ± 11.5 years) were included in the analysis. The characteristics of the breast lesions are shown in Table 1. The lesions were composed of 327 benign lesions and 48 malignant lesions (pathologically confirmed 170 benign/borderline lesions, 48 malignant lesions, and 157 lesions without changes over more than 2 years, which suggests benign lesions).
Interobserver Agreement between Radiologists and the CAD System
The interobserver agreement between the radiologists and CAD is shown in Table 2. The shape and orientation reveal the moderate degree of agreement. The margin, echogenicity, and posterior features reveal a fair degree of agreement. When the cut- off differentiating the benign and malignant lesions by the radiol- ogist was set at category 4A, the final assessment revealed a mod- erate degree of agreement, and when the cutoff was set at category 4B, the final assessment revealed a fair degree of agreement.
Diagnostic Performance of CAD System
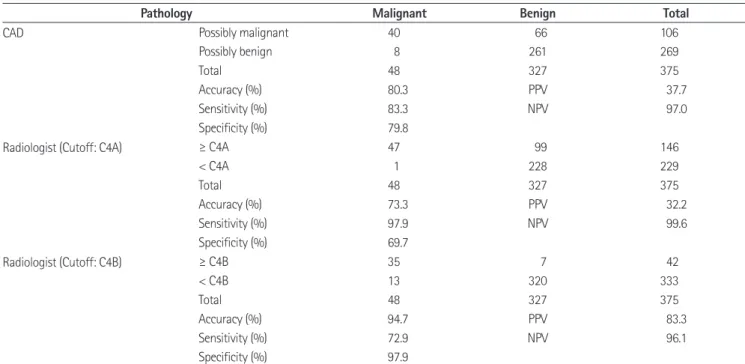
The diagnostic performance of CAD is summarized in Table
3. The accuracy, sensitivity, specificity, PPV, and NPV of breast US CAD were 80.3% (301/375), 83.3% (40/48), 79.8% (261/
327), 37.7% (40/106), and 97.0% (261/269), respectively.
False Negative Interpretation of CAD System
There were 8 false negative interpretation cases. The patterns are summarized in Table 4. Mostly, the lesions with false nega- tive interpretations were oval shaped with parallel orientations, which generally belonged to the category of ‘well-circumscribed’
breast carcinomas (Fig. 1). Four lesions of 8 false negative cases were mucinous or papillary carcinomas.
Table 1. Characteristics of 327 Benign Lesions and 48 Malignant Lesions
Pathology Number
170 benign/borderline lesions
Atypical ductal hyperplasia 2
Intraductal papilloma 13
Radial scar 2
Phyllodes tumor 2
Flat epithelial atypia 2
Columnar cell hyperplasia 3
Sclerosing adenosis 3
Abscess 1
Chronic inflammation 3
Adenosis 2
Fat necrosis 4
Fibrocystic change 51
Fibroadenoma 62
Fibroadenomatous hyperplasia 5
Parasite 1
Sclerosing fibrosis 1
Stromal fibrosis 5
Tubular adenoma 2
Usual ductal hyperplasia 1
Hamartoma 3
Florid ductal hyperplasia 1
Inflammatory lymph node 1
48 confirmed malignancy
Invasive ductal carcinoma 35
Ductal carcinoma in situ 6
Mucinous carcinoma 5
Papillary carcinoma 1
Metaplastic carcinoma 1
157 breast lesions without changes for more than 2 years 157
Total 375
Table 2. Interobserver Agreement between Radiologists and CAD System
Lexicon Kappa Value Agreement
Shape 0.526 Moderate
Oval Round Irregular
Orientation 0.590 Moderate
Parallel Not parallel
Margin 0.377 Fair
Circumscribed Indistinct Angular Microlobulated Spiculated
Echogenicity 0.381 Fair
Anechoic Hyperechoic
Complex cystic and solid Hypoechoic
Isoechoic Heterogeneous
Posterior features 0.385 Fair
No posterior features Enhancement Shadowing Combined pattern Final assessment
Possibly benign
Possibly malignancy (≥ C4A)
0.422 Moderate
Possibly benign
Possibly malignancy (≥ C4B)
0.356 Fair
C4A = category 4A, low suspicion for malignancy, C4B = category 4B, mod- erate suspicious for malignancy, CAD = computer-aided diagnosis
False Positive Interpretation of CAD System
There were 66 false positive interpretation cases. Twenty-three cases were misinterpreted with inappropriate demarcation of the lesions due to heterogeneous echogenicity, large lesion sizes, adjacent parenchyma or posterior acoustic shadowing (first type error) (Fig. 2). Twenty-one cases exhibited suspicious features with proper demarcations and descriptions with benign patho- logical results (second type error) (Fig. 3). Known benign lesions with suspicious features such as abscesses accounted for 15 cas- es (third type error). Seven cases were interpreted with proper demarcations with benign nature descriptions with ‘possibly malignancy’ conclusions and represented the smallest number of the false positive cases (fourth type error) (Fig. 4). The first and
third type errors could be corrected with clinical background and imaging provided by CAD. The second type error was inev- itable. The fourth type error was suggested to be a real error of the CAD system. Of the 66 false positive cases, the radiologist determined 37 cases as malignancy (C4A: 36, C4B: 1), agreeing with the CAD. The remaining 29 cases were judged as benign (C3) by radiologists, showing a difference with the CAD.
DISCUSSION
US BI-RADS has substantially contributed to improving communication between physicians and radiologists, but ob- server variability remains a major limitation of US, which is Table 3. Diagnostic Performance of CAD System and Radiologists
Pathology Malignant Benign Total
CAD Possibly malignant 40 66 106
Possibly benign 8 261 269
Total 48 327 375
Accuracy (%) 80.3 PPV 37.7
Sensitivity (%) 83.3 NPV 97.0
Specificity (%) 79.8
Radiologist (Cutoff: C4A) ≥ C4A 47 99 146
< C4A 1 228 229
Total 48 327 375
Accuracy (%) 73.3 PPV 32.2
Sensitivity (%) 97.9 NPV 99.6
Specificity (%) 69.7
Radiologist (Cutoff: C4B) ≥ C4B 35 7 42
< C4B 13 320 333
Total 48 327 375
Accuracy (%) 94.7 PPV 83.3
Sensitivity (%) 72.9 NPV 96.1
Specificity (%) 97.9
C4A = category 4A, low suspicion for malignancy, C4B = category 4B, moderate suspicious for malignancy, CAD = computer-aided diagnosis, NPV = nega- tive predictive value, PPV = positive predictive value
Table 4. Patterns of False Negative Interpretations of CAD System
No Shape Orientation Margin Echogenicity Pathology Size (cm) Radiologists’ Category
1 Irregular Parallel Microlobulated Isoechoic Mucinous carcinoma 1.1 C3
2 Oval Parallel Circumscribed Hypoechoic Invasive ducal carcinoma 1.4 C4B
3 Oval Parallel Circumscribed Complex cystic and solid Ductal carcinoma in situ 1.8 C4A
4 Oval Parallel Microlobulated Hypoechoic Mucinous carcinoma 1.3 C4A
5 Oval Parallel Circumscribed Hypoechoic Mucinous carcinoma 0.3 C4A
6 Oval Not parallel Circumscribed Isoechoic Invasive ducal carcinoma 2.2 C4A
7 Oval Parallel Circumscribed Isoechoic Papillary carcinoma 0.3 C4A
8 Oval Parallel Microlobulated Complex cystic and solid Invasive ducal carcinoma 1.2 C4B
C3 = category 3, probable benign finding, C4A = category 4A, low suspicion for malignancy, C4B = category 4B, moderate suspicious for malignancy, CAD
= computer-aided diagnosis
considered problematic, considering the wide application of breast US (4). As technology has evolved, various imaging meth- ods have been developed that differentiate breast masses as seen
on grayscale US to aid image interpretation and decision-mak- ing based on this interpretation, such as elastography and US- CAD (4, 6, 9, 11, 13, 15, 16). In this study, we evaluated the di-
Fig. 1. Imaging findings from a 56-year-old woman who had ductal carcinoma in situ, an example of a false negative interpretation of CAD. CAD interpretation of this lesion as possibly benign with oval parallel, circumscribed hypoechoic features. CAD misinterpretation of ‘well-circum- scribed’ breast carcinomas as benign lesions.
CAD = computer-aided diagnosis
Fig. 2. Imaging findings from a 60-year-old woman who had an involuting fibroadenoma, an example of first type error of a false positive inter- pretation of CAD. This breast lesion was known as an involuting fibroadenoma. Heterogeneous echogenicity of this mass is applied to CAD, and due to its heterogeneity, the lesion shape is read as an irregular shape with a microlobulated margin, and the final assessment is possibly malig- nancy.
CAD = computer-aided diagnosis
agnostic performance of US-CAD in the differential diagnosis of breast masses seen on US. This is the first study to retrospec- tively analyze the features of lesions interpreted with errors based
on the diagnostic performances of US-CAD, because the ma- jority of earlier studies focused only on the results of diagnostic performance or the comparison to radiologists (4, 9, 11, 17).
Fig. 3. Imaging findings from a 41-year-old woman who had fibrocystic change, an example of second type error of false positive interpretation of CAD. An irregular-shaped not parallel hypoechoic lesion is found on US. CAD reveals proper demarcation with irregular, not parallel, spiculated hypoechoic description with possible malignant conclusion. Due to its suspicious features, US-guided biopsy is found on US performed, and fi- brocystic change is found on US confirmed. It is found on US an inevitable false positive case in the clinical setting.
CAD = computer-aided diagnosis, US = ultrasound
Fig. 4. Imaging findings from a 61-year-old woman who had fibrocystic change, which is an example of fourth type error of false positive inter- pretation on CAD. US reveals an oval parallel circumscribed hypoechoic mass. CAD also describes this lesion as an oval parallel circumscribed hy- poechoic mass without posterior features. However, the final assessment was possible malignancy. A US-guided biopsy was performed and fibro- cystic change was confirmed. This was a real error in the interpretation of CAD.
CAD = computer-aided diagnosis, US = ultrasound
In this study, CAD had high sensitivity, specificity, NPV, and accuracy; the significantly high value of the NPV was 97.0%.
Additionally, the interobserver agreement between the radiolo- gists and CADs had moderate to fair degrees. There was even a moderate degree of agreement in the final assessment catego- ries between the radiologists and the CADs when the cutoff differentiating the benign and malignant lesions by the radiolo- gist was set at category 4A. When the cutoff differentiating the benign and malignant lesions by the radiologist was set at cate- gory 4B, the final assessment revealed a fair degree of agreement.
We evaluated the patterns of lesions that were wrongly inter- preted by CAD as false negative patterns and false positive pat- terns. First, the lesions of the false negative interpretations in- cluded 8 cases. Mostly, the lesions were oval shaped with parallel orientations and generally belonged to the category of ‘well-cir- cumscribed’ breast carcinomas. Most circumscribed breast masses are known to be benign lesions. However, 10–20% of breast malignancies are circumscribed masses, and these ma- lignancies include papillary, mucinous, medullary, and meta- plastic carcinomas, as well as malignant phyllodes tumors (6, 18). In this study, 4 lesions of the 8 false negative cases were mucinous or papillary carcinomas. Importantly, it is not easy to differentiate these circumscribed breast malignancies from be- nign breast lesions with conventional imaging modalities such as mammography and grayscale US. US-CAD also exhibited limitations for these ‘well-circumscribed’ breast carcinomas be- cause US-CAD uses computer-based analyses that are based on the morphologic features found on grayscale US.
Second, the lesions that led to false positive interpretations included 66 cases. These cases were categorized into four types.
First type errors comprised the greatest portion (34.8%) and in- cluded misinterpreted lesions with inappropriate demarcations due to heterogeneous echogenicity, large lesion size, adjacent parenchyma, or posterior acoustic shadowing. Second type er- rors also comprised a large portion (31.8%) and were malig- nant-looking lesions with suspicious features, proper demarca- tions and descriptions but with benign pathological results.
These second type errors are inevitable in the clinical setting.
Third type errors, accounting for 22.7%, were known as benign lesions with suspicious features, such as abscesses. Both first and third type errors, which accounted for more than half of all of the false positive lesions, could be corrected with clinical
background and imaging provided by CAD. The last or fourth type error comprised the smallest portion (10.6%) and was misinterpreted lesions with proper demarcations and benign nature descriptions with ‘possibly malignancy’ conclusions. This fourth type error was a real error of the CAD system. However, this real error was rare, and the CAD system is based on the deep-learning algorithm with big data, so improvements with more cases can improve these types of errors.
This study has some limitations. First, all of the evaluations were performed by 4 radiologists, and the variability between the operators was not considered. When the CAD analysis was applied to any lesion, the radiologist had to identify the center of the breast lesion that he or she scanned, which could differ depending on the radiologist. Second, this study did not con- tain the radiologists’ performance analysis in detail; it contained only the interobserver agreement between the radiologists and CAD. We intended to focus on the evaluation of the diagnostic performance of the CAD system and the analysis of the lesions interpreted with the errors in the CAD system in this study.
In clinical practice, the CAD system might be used as a diag- nostic tool to improve the NPV of breast US and as a guide in decision-making for breast masses that are detected on gray- scale US. This system is expected to be helpful in avoiding un- necessary biopsies due to its high NPV and could reduce medi- cal costs for patients. Therefore, operators need to know the characteristics of lesions that are prone to misinterpretations from the CAD system and should consider the clinical history and findings of other imaging modalities.
Acknowledgments
This research was supported by a grant of the Korean Health Technology R&D Project through the Korea Health Industry Development Institute (KHIDI), funded by the Ministry of Health
& Welfare, Republic of Korea (grant number: HI15C0833).
RefeReNCeS
1. Wang X, Guo Y, Wang Y. Automatic detection of regions of interest in breast ultrasound images based on local phase information. Biomed Mater Eng 2015;26 Suppl 1:S1265- S1273
2. Jung KW, Won YJ, Oh CM, Kong HJ, Lee DH, Lee KH. Cancer
statistics in Korea: incidence, mortality, survival, and prev- alence in 2014. Cancer Res Treat 2017;49:292-305 3. Chabi ML, Borget I, Ardiles R, Aboud G, Boussouar S, Vilar V,
et al. Evaluation of the accuracy of a computer-aided diag- nosis (CAD) system in breast ultrasound according to the radiologist's experience. Acad Radiol 2012;19:311-319 4. Kim K, Song MK, Kim EK, Yoon JH. Clinical application of S-
Detect to breast masses on ultrasonography: a study eval- uating the diagnostic performance and agreement with a dedicated breast radiologist. Ultrasonography 2017;36:3-9 5. Chen DR, Chien CL, Kuo YF. Computer-aided assessment of
tumor grade for breast cancer in ultrasound images. Com- put Math Methods Med 2015;2015:914091
6. Moon WK, Huang YS, Lo CM, Huang CS, Bae MS, Kim WH, et al. Computer-aided diagnosis for distinguishing between triple-negative breast cancer and fibroadenomas based on ultrasound texture features. Med Phys 2015;42:3024-3035 7. Song SE, Seo BK, Cho KR, Woo OH, Son GS, Kim C, et al.
Computer-aided detection (CAD) system for breast MRI in assessment of local tumor extent, nodal status, and multifo- cality of invasive breast cancers: preliminary study. Cancer Imaging 2015;15:1
8. Shan J, Alam SK, Garra B, Zhang Y, Ahmed T. Computer-aid- ed diagnosis for breast ultrasound using computerized BI- RADS features and machine learning methods. Ultrasound Med Biol 2016;42:980-988
9. Cho E, Kim EK, Song MK, Yoon JH. Application of computer- aided diagnosis on breast ultrasonography: evaluation of diagnostic performances and agreement of radiologists ac- cording to different levels of experience. J Ultrasound Med 2018;37:209-216
10. Choi JH, Kang BJ, Baek JE, Lee HS, Kim SH. Application of computer-aided diagnosis in breast ultrasound interpreta-
tion: improvements in diagnostic performance according to reader experience. Ultrasonography 2017;37:217-225 11. Lee SE, Moon JE, Rho YH, Kim EK, Yoon JH. Which supple-
mentary imaging modality should be used for breast ultra- sonography? Comparison of the diagnostic performance of elastography and computer-aided diagnosis. Ultrasonog- raphy 2017;36:153-159
12. Wang Y, Jiang S, Wang H, Guo YH, Liu B, Hou Y, et al. CAD algorithms for solid breast masses discrimination: evaluation of the accuracy and interobserver variability. Ultrasound Med Biol 2010;36:1273-1281
13. Dromain C, Boyer B, Ferré R, Canale S, Delaloge S, Balleygui- er C. Computed-aided diagnosis (CAD) in the detection of breast cancer. Eur J Radiol 2013;82:417-423
14. Landis JR, Koch GG. The measurement of observer agree- ment for categorical data. Biometrics 1977:33;159-174 15. Tan T, Platel B, Twellmann T, van Schie G, Mus R, Grivegnée
A, et al. Evaluation of the effect of computer-aided classi- fication of benign and malignant lesions on reader perfor- mance in automated three-dimensional breast ultrasound.
Acad Radiol 2013;20:1381-1388
16. Lehman CD, Wellman RD, Buist DS, Kerlikowske K, Tosteson AN, Miglioretti DL. Diagnostic accuracy of digital screening mammography with and without computer-aided detec- tion. JAMA Intern Med 2015;175:1828-1837
17. Sahiner B, Chan HP, Roubidoux MA, Hadjiiski LM, Helvie MA, Paramagul C, et al. Malignant and benign breast masses on 3D US volumetric images: effect of computer-aided di- agnosis on radiologist accuracy. Radiology 2007;242:716- 724
18. Yoo JL, Woo OH, Kim YK, Cho KR, Yong HS, Seo BK, et al. Can MR imaging contribute in characterizing well-circumscribed breast carcinomas? Radiographics 2010;30:1689-1702
유방 초음파 컴퓨터 진단: 오류 유형 분석
정민경
1· 강봉주
2* · 김은정
2· 김성헌
2목적: 이 연구의 목적은 유방 초음파 컴퓨터 진단(computer-aided diagnosis; 이하 CAD)의 양성과 악성을 구별하는 진 단능을 알아보고 이 때 발생한 오류 유형을 후향적으로 분석하는데 있다.
대상 및 방법: 316명의 여성에게서 발견된 375개의 병변을 대상으로 정확도, 민감도, 특이도, 양성예측치, 음성예측치를 계산하였다. 위양성 및 위음성 그룹에서 진단 오류의 원인과 유형을 분석하였다.
결과: 유방 초음파 CAD의 정확도, 민감도, 특이도, 양성예측치, 음성예측치는 각각 80.3%, 83.3%, 79.8%, 37.7%, 97.0%였다. 8개의 위음성 병변은 모두 타원형과 피부 평형 방향이었다. 위양성 병변은 66개였고 4가지 유형으로 분류되 었다. 가장 많은 수의 첫 번째 유형은 불균인한 에코발생도 등으로 인해 병변의 경계를 틀리게 그려져서 발생하였다. 두 번 째 유형은 병변의 경계를 맞게 그리고 악성을 시사하는 적절한 기술을 했지만 병리에서 양성이 나왔다. 세 번째 유형은 농 양 등 양성 병변이 악성처럼 보였다. 가장 적은 수의 마지막 네 번째 유형은 병변의 경계를 맞게 그리고 양성을 시사하는 적절한 기술을 했지만 CAD가 최종 진단을 악성으로 내렸다.
결론: 유방 초음파 CAD의 높은 음성예측치는 불필요한 조직검사를 감소시킬 것으로 기대된다. 따라서, 유방 초음파를 시행하는 의사는 CAD의 진단 오류 특징에 대해서 이해할 필요가 있다.
1가톨릭대학교 의과대학 성빈센트병원 영상의학과, 2가톨릭대학교 의과대학 서울성모병원 영상의학과