D I A B E T E S & M E T A B O L I S M J O U R N A L
This is an Open Access article distributed under the terms of the Creative Commons At- tribution Non-Commercial License (http://creativecommons.org/licenses/by-nc/3.0/) which permits unrestricted non-commercial use, distribution, and reproduction in any medium, provided the original work is properly cited.
Role of HbA1c in the Screening of Diabetes Mellitus in a Korean Rural Community
Jae Hyun Kim1, Gun Woo Kim1, Mi Young Lee1, Jang Yel Shin1, Young Goo Shin1, Sang Baek Koh2, Choon Hee Chung1,3
Departments of 1Internal Medicine, 2Preventive Medicine, 3Institute of Lifestyle Medicine, Yonsei University Wonju College of Medicine, Wonju, Korea
Background: Recently, the measurement of glycated hemoglobin (HbA1c) was recommended as an alternative to fasting plas- ma glucose or oral glucose tolerance tests for diagnosing diabetes mellitus (DM). In this study, we analyzed HbA1c levels for dia- betes mellitus screening in a Korean rural population.
Methods: We analyzed data from 10,111 subjects from a Korean Rural Genomic Cohort study and generated a receiver operat- ing characteristic curve to determine an appropriate HbA1c cutoff value for diabetes.
Results: The mean age of the subjects was 56.3±8.1 years. Fasting plasma glucose and 2-hour plasma glucose after 75 g oral glu- cose tolerance tests were 97.5±25.6 and 138.3±67.1 mg/dL, respectively. The mean HbA1c level of the subjects was 5.7±0.9%.
There were 8,809 non-DM patients (87.1%) and 1,302 DM patients (12.9%). A positive relationship between HbA1c and plasma glucose levels and between HbA1c and 2-hour plasma glucose levels after oral glucose tolerance tests was found in a scatter plot of the data. Using Youden’s index, the proper cutoff level of HbA1c for diabetes mellitus screening was 5.95% (sensitivity, 77%;
specificity, 89.4%).
Conclusion: Our results suggest that the optimal HbA1c level for DM screening is 5.95%.
Keywords: Diabetes mellitus; Diagnosis; Hemoglobin A, glycosylated; Screening
Corresponding author: Choon Hee Chung
Department of Internal Medicine, Yonsei University Wonju College of Medicine, 162 Ilsan-dong, Wonju 220-701, Korea
E-mail: cchung@yonsei.ac.kr
INTRODUCTION
The prevalence of diabetes is increasing worldwide. In many cases, chronic complications in the advanced stage are found during diagnosis [1]. In addition, cases of microvascular and macrovascular complications have been found in pre-diabetes such as impaired fasting glucose or impaired glucose tolerance [2]. Early detection and active treatment can help in prevent- ing the progression of complications and are therefore consid- ered to be very important for controlling diabetes mellitus.
Until now, oral glucose tolerance tests have been used to measure fasting or postprandial blood glucose in the diagnosis of diabetes. However, short-term blood glucose observations require fasting prior to blood sampling which can be uncom- fortable for patients. In addition, since blood sugar levels can be affected by exercise, diet, and illness, the patient’s condition,
and also the temperature at which blood samples are stored at, can make the interpretation of results difficult. Therefore, many studies have investigated the diagnosis of diabetes using gly- cated hemoglobin (HbA1c) because more accurate tests and simple diagnostic criteria are required for screening of diabe- tes. The glycated hemoglobin test measures how much glucose is bound to hemoglobin in red blood cells. The test reflects the level of glucose control over the previous 2 to 3 months and is used as an indicator for the risk of complications in patients diagnosed with diabetes [3]. In addition, this method is not af- fected by diet and can be performed at any time; thus, the level of glycated hemoglobin in patients who have diabetes can be used to determine blood glucose levels more accurately than existing tests for the diagnosis of diabetes. Despite its accuracy, however, the glycated hemoglobin test has not been consid- ered reliable due to a lack of standardization. Therefore, it has pISSN 2233-6079 · eISSN 2233-6087
not been included in the diagnostic criteria for diabetes [4].
However, in many recent studies, when glycated hemoglobin is compared with fasting blood glucose, it does not fall behind the other diabetes screening methods and is considered a use- ful part of the diagnostic criteria [5]. In addition, as the mea- suring process for glycated hemoglobin has become more ac- curate and standardized, the American Diabetes Association (ADA) in 2010 adopted glycated hemoglobin level over 6.5%
as a new diagnostic criteria for diabetes [6]. However, there is still controversy over whether this glycated hemoglobin level is applicable to Korean adults suitably. Therefore, in this study, the glycated hemoglobin levels of patients who received 75 g oral glucose tolerance tests were comparatively analyzed in or- der to determine the appropriate glycated hemoglobin levels for screening or diagnosis of diabetes in Korean adults.
METHODS
Between January 2005 and January 2007, this study was per- formed on 10,111 patients who belonged to the Korean Ge- nomic Research Cohort. Data on age, gender, blood pressure, and body mass index (BMI), calculated by dividing body weight (kg) by height squared (m2), were collected for the all patients.
Cholesterol, triglycerides, high density lipoprotein cholesterol (HDL-C) and low density lipoprotein cholesterol (LDL-C), liver enzymes, fasting blood glucose, 75 g oral glucose toler- ance tests, 2-hour blood glucose samples, and glycated hemo- globin were investigated. Glycated hemoglobin was measured using a high-performance liquid chromatography (HPLC) Variant II Turbo (Bio-Rad, Hercules, CA, USA). Using a spe- cific standardized measurement set established through the National Glycohemoglobin Standardization Program (NGSP), calibrations were made and the coefficient of variation was be- tween 1.3% (normal) and 0.8% (abnormal).
Using Youden’s index, the distribution curve and the rela- tive character curve for the levels of glycated hemoglobin of patients diagnosed with diabetes were generated and used to obtain glycated hemoglobin values showing the appropriate sensitivity and specificity were investigated. Diabetes was de- fined as an 8-hour fasting blood glucose over 126 mg/dL and a 75 g oral glucose tolerance test over 200 mg/dL after 2 hours based on criteria set by the Korean Diabetes Association [7].
Statistical analysis was performed using SPSS program ver- sion 12.0 for Windows (SPSS Inc., Chicago, IL, USA). Statisti- cal values were expressed as mean±standard deviation. Thresh-
old values for glycated hemoglobin obtained from the analysis of relative characteristic curves were used to predict diabetes.
RESULTS
Clinical characteristics of study participants
The mean age of the patients in this study was 56.3±8.1 years, and the gender distribution was 4,091 (40.5%) males and 6,020 (59.5%) females. The mean fasting level of blood glucose was 97.5±25.6 mg/dL, and the mean blood glucose level measured by 75 g oral glucose tolerance test after 2 hours was 138.3±67.1 mg/dL. The mean glycated hemoglobin value for all the pa- tients was 5.7±0.9% (Table 1). The mean glycated hemoglobin for males and females were 5.7±0.9% and 5.7±0.8%, respec- tively, a statistically significant result (P=0.017).
Evaluation of cutoff value (threshold)
According to the results from fasting plasma glucose and 75 g oral glucose tolerance tests, 8,809 (87.1%) of the patients be- longed to the non-diabetes group. Among them, 1,850 (18.3%) Table 1. Clinical characteristics of the subjects
Characteristic Mean±SD
(n=10,111) IQR
Age, yr 56.3±8.1
Waist circumference, cm 83.5±8.7 78.0-89.5
BMI, kg/m2 24.6±3.6 22.4-26.4
SBP, mm Hg 131±18 120-142
DBP, mm Hg 83±13 75-90
Total cholesterol, mg/dL 203.2±39.0 176.0-226.3 Triglyceride, mg/dL 154.5±108.6 88.0-186.0
HDL-C, mg/dL 46.0±11.2 38.0-52.0
LDL-C, mg/dL 119.1±33.3 96.0-140.0
ALT, IU/L 25.9±19.4 17.0-29.0
AST, IU/L 28.8±24.5 21.0-30.0
GGT, IU/L 37.7±79.2 13.0-46.0
Fasting plasma glucose, mg/dL 97.5±25.6 86.0-100.0 2-hr plasma glucose, mg/dL 138.3±67.1 81.0-147.0
Fasting insulin, mU/L 8.7±5.5 5.9-9.8
HbA1c, % 5.7±0.9 5.2-5.8
SD, standard deviation; IQR, inter quartile range; BMI, body mass index; SBP, systolic blood pressure; DBP, diastolic blood pressure;
HDL-C, high density lipoprotein cholesterol; LDL-C, low density li- poprotein cholesterol; ALT, alanine aminotransferase; AST, aspartate aminotransferase; GGT, gamma-glutamyl transferase.
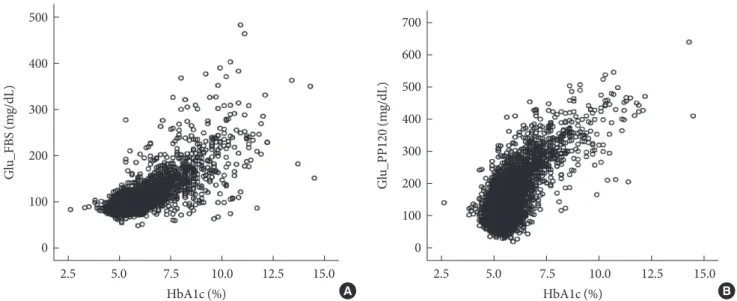
had impaired fasting glucose and 1,951 (19.3%) had impaired glucose tolerance. 1,302 (12.9%) of the patients belonged to the diabetes group. The distribution of fasting plasma glucose and glycated hemoglobin, and the distribution of glycated he- moglobin measured from blood glucose after 2-hour 75 g oral glucose tolerance tests all showed a positive correlation (Fig. 1).
When glycated hemoglobin levels used to predict diabetes were analyzed using a relative characteristic curve, the sensi- tivity and specificity were 77.0% and 89.4%, respectively, and appropriate levels for selection criteria were observed (Fig. 2).
This study was a cross-sectional analysis. We did not inves- tigate diabetic microvascular complications, and providing suggestions for diagnostic criteria was difficult. However, with results that showed a specificity of 97.5% and a corresponding glycated hemoglobin value of 6.4% (Table 2), both of which are appropriate values, we believe that this study can be used as an indicator for predicting diabetes.
DISCUSSION
The glycated hemoglobin value reflects glycemic control over the previous 2 to 3 months, and there is a positive correlation Fig. 2. Receiver operating characteristic curves for HbA1c
corresponding diabetes mellitus defined by Korean Diabetes Association (use Youden’s index).
0.0 0.2 0.4 0.6 0.8 1.0
1.0
0.8
0.6
0.4
0.2
0.0
Sensitivity
1-Specificity 5.95%
Fig. 1. (A) Scatter plot of individuals according to HbA1c and fasting plasma glucose level (correlation coefficient, 0.51; P=0.00) (B) Scatter plot of individuals according to HbA1c and 2-hour plasma glucose level after oral glucose tolerance tests (correlation coefficient, 0.33; P=0.00). Glu_FBS, fasting blood glucose; Glu_PP120, postprandial blood glucose after 120 minutes.
2.5 5.0 7.5 10.0 12.5 15.0 500
400
300
200
100
0
Glu_FBS (mg/dL)
HbA1c (%) A
2.5 5.0 7.5 10.0 12.5 15.0
700 600 500 400 300 200 100 0
Glu_PP120 (mg/dL)
HbA1c (%) B
Table 2. Comparison of sensitivity and specificity at various levels of HbA1c
HbA1c, % Sensitivity, % Specificity, %
5.75 84.1 78.6
5.85 80.1 84.8
5.95 77.0 89.4
6.05 73.9 92.4
6.15 70.7 94.5
6.25 66.6 96.1
6.35 63.4 97.1
6.45 59.4 97.8
6.55 55.5 98.3
6.65 51.8 98.6
between fasting plasma glucose and blood glucose after 2 hours in 75 g oral glucose tolerance test. In addition, glycated hemo- globin measurements are more reproducible than fasting blood glucose, and the coefficient of variation within the population is 1.7% compared to 5.7% for fasting blood glucose [8,9]. Fur- thermore, in the study results from the Diabetes Control and Complication Trial (DCCT) and the United Kingdom Pro- spective Diabetes Study (UKPDS), the authors noted that measuring glycated hemoglobin was a useful indicator in pre- dicting the occurrence of complications with diabetes [10,11].
Thus, glycated hemoglobin measurements are measurements are receiving spotlights in screening and diagnosing diabetes recently. Studies that compare the existing tests to glycated he- moglobin measurement are being developed and being as- sessed for their usefulness. In a study of 4,935 participants in the U.S. National Health and Nutrition Examination Survey (NHANES) for 6 years (1999 to 2004), fasting blood glucose was used for the diagnosis of diabetes. On the basis of this study, the suggested ranges for glycated hemoglobin are as fol- lows: over 5.8% indicates impaired glucose metabolism, 6.1%
to 6.9% is considered to be pre-diabetes, and over 7% is con- sidered to be diabetes [12]. In addition, several studies have reported a relationship between glycated hemoglobin and dia- betic retinopathy [13,14], and in 2010, through NGSP stan- dardization [15], the ADA proposed that glycated hemoglobin levels greater than 6.5% should be diagnosed as diabetes [6].
In the 2002 Japan National Diabetes survey based on impaired glucose metabolism, glycated hemoglobin greater than 6.1% is classified as probable DM, 5.6% to 6.0% as possible DM, and less than 5.6% as normal [16].
There have been many recent studies in Korea regarding the use of glycated hemoglobin levels for the diagnosis of diabetes.
Kim et al. [17] performed a study on 205 patients with normal fasting blood glucose who had never been diagnosed with glu- cose metabolism impairments. Among those patients, the mean glycated hemoglobin value between the diabetes group and the non-diabetes group was 6.1±0.7% and 5.7±0.5%, respectively, a statistically significant difference. In addition, this study re- ported that diabetes could be predicted through glycated he- moglobin measurements. In a study based on fasting blood glucose performed by Ku et al. [18] on 19,178 patients who did not have diabetes, the threshold glycated hemoglobin value for predicting diabetes was 5.9%. In addition, using a 2-hour oral glucose tolerance test with the threshold value set at 6.1% for glycated hemoglobin, sensitivities and specificities were
84.6%/85.9% and 86.5%/85.8%, respectively. In a study by Bae et al. [19] performed on 1,482 patients who had not previously been diagnosed with diabetes, the glycated hemoglobin thresh- old value for predicting diabetes was set at 5.95%, and the sen- sitivity and specificity were reported to be 60.8% and 85.6%, respectively. In a retrospective study by Jung et al. [20] per- formed on 1,474 diabetes patients, a glycated hemoglobin threshold value of 6.75% and a specificity of 85% were sug- gested for the diagnosis of diabetes. In our study results, the glycated hemoglobin threshold was 5.95%. However, the spec- ificity must be higher in order for glycated hemoglobin to be used as a diagnostic criteria [21]; therefore, the baseline for predicting diabetes was set at 6.4%, which corresponds to the specificity of 97.5%. This baseline prediction value is used in many studies, and when used for the diagnosis of diabetes, the specificity value is considered to be high [22-26].
However, there are several problems when glycated hemo- globin is used for the prediction of diabetes in Korean adults, primarily because the measurement of glycated hemoglobin has not yet been standardized in Korea. As a result, the differ- ences between compared measurements cause many difficul- ties in the analysis of the results. Standards must be preceded by selection criteria or by diagnostic criteria.
In addition, Korean diets are different from Western diets, and this can result in a difference in blood glucose after meals which can also influence glycated hemoglobin. According to the 2008 National Health Statistics [27], the daily consumption of carbohydrates for Koreans is 293.3 g. According to the 2006 U.S.
National Health and Nutrition Examination Survey [28], Amer- icans consume an average of 265 g of carbohydrates per day.
Thus, Koreans may have higher blood glucose levels after meals compared to Americans. In addition, Korean diabetics have fewer beta cells compared to American diabetics, and there are studies regarding the amount of insulin secreted after meals [29]. Other factors that may cause differences between Korean and American diabetics include culture and socio-economic differences, susceptibility to diabetes, enzymatic activity, and in- tracellular accumulations of glycated hemoglobin resulting from varying degrees of non-enzymatic glycosylation [30,31].
The threshold value of 5.95% for glycated hemoglobin set by the authors of this study was not significantly different from previous studies. However, African Americans consistently showed higher glycated hemoglobin than other races in stud- ies performed by Saudek et al. [2] and Selvin et al. [32], and this was also true in the normal fasting blood glucose state.
Such racial difference is caused by the use of glycated hemo- globin as a diagnostic criterion; therefore, the use of this meth- od for the diagnosis of diabetes may be problematic. Also, be- cause glycated hemoglobin is measured directly from red blood cells, factors affecting the survival of red blood cells such as hemolytic anemia, aplastic anemia, hemorrhage, and splenec- tomy may disrupt the normal relationship between blood glu- cose and glycated hemoglobin. Hemolytic anemia and acute hemorrhaging may cause glycated hemoglobin to drop, and patients with aplastic anemia or who have received splenecto- my have older red blood cells; therefore, regardless of blood glucose concentrations, glycated hemoglobin concentrations may increase [2]. Additionally, high doses of salicylate or vita- min C, and deficiencies of vitamin E or iron may also affect glycated hemoglobin [2].
Because of these problems, appropriate glycated hemoglo- bin values have not been established for the diagnostic criteria of diabetes in Koreans; however, this topic is still considered controversial. Despite the problems associated with using gly- cated hemoglobin, there are many benefits of using it for the diagnosis and prediction of diabetes and its complications compared to the existing tests. Therefore, we believe glycated hemoglobin will play a large role in the diagnosis of diabetes in the future. However, more research regarding the effects of racial differences and other factors on glycated hemoglobin is needed in order for it to become more widely used in the diag- nosis of diabetes.
This study has the following limitations. First, the cohort data was collected from individuals living in rural communi- ties, so regional lifestyle differences may have influenced the results. Second, the greater number of females than males in this study may have also influenced the results. Because of the limitations of the glycated hemoglobin test, large-scale prospec- tive studies using supplemental varied data will be required in the future. Furthermore, additional studies on threshold for increased occurrence of diabetes-associated microvascular complications will be needed to obtain a more precise diabetes diagnostic criterion.
In this study, the appropriate levels of glycated hemoglobin were evaluated for the screening and diagnosis of diabetes. Us- ing a relativity curve, the threshold value for glycated hemo- globin was 5.95%, and the sensitivity and specificity for the se- lection criteria were 77% and 89.4%, respectively. Also, the corresponding specificity of 97.5% for a glycated hemoglobin value of 6.4% was considered appropriate for diagnostic pre-
dictions. On the basis of this study, glycated hemoglobin should be considered as a method that can replace or complement ex- isting screening methods for the diagnosis of diabetes.
CONFLICTS OF INTEREST
No potential conflict of interest relevant to this article was re- ported.
REFERENCES
1. King H, Aubert RE, Herman WH. Global burden of diabetes, 1995-2025: prevalence, numerical estimates, and projections.
Diabetes Care 1998;21:1414-31.
2. Saudek CD, Herman WH, Sacks DB, Bergenstal RM, Edelman D, Davidson MB. A new look at screening and diagnosing dia- betes mellitus. J Clin Endocrinol Metab 2008;93:2447-53.
3. Sung KC, Rhee EJ. Glycated haemoglobin as a predictor for metabolic syndrome in non-diabetic Korean adults. Diabet Med 2007;24:848-54.
4. Report of the Expert Committee on the Diagnosis and Classi- fication of Diabetes Mellitus. Diabetes Care 1997;20:1183-97.
5. Bennett CM, Guo M, Dharmage SC. HbA(1c) as a screening tool for detection of type 2 diabetes: a systematic review. Dia- bet Med 2007;24:333-43.
6. American Diabetes Association. Diagnosis and classification of diabetes mellitus. Diabetes Care 2010;33 Suppl 1:S62-9.
7. Korean Diabetes Association. Diagnosis and classification of diabetes. Clin Diabetes 2005;6:132-40.
8. Petersen PH, Jorgensen LG, Brandslund I, De Fine Olivarius N, Stahl M. Consequences of bias and imprecision in measure- ments of glucose and HbA1c for the diagnosis and prognosis of diabetes mellitus. Scand J Clin Lab Invest Suppl 2005;240:
51-60.
9. Sacks DB, Bruns DE, Goldstein DE, Maclaren NK, McDonald JM, Parrott M. Guidelines and recommendations for laborato- ry analysis in the diagnosis and management of diabetes melli- tus. Clin Chem 2002;48:436-72.
10. The Diabetes Control and Complications Trial Research Group.
The effect of intensive treatment of diabetes on the develop- ment and progression of long-term complications in insulin- dependent diabetes mellitus. N Engl J Med 1993;329:977-86.
11. UK Prospective Diabetes Study (UKPDS) Group. Intensive blood-glucose control with sulphonylureas or insulin com- pared with conventional treatment and risk of complications
in patients with type 2 diabetes (UKPDS 33). Lancet 1998;352:
837-53.
12. Buell C, Kermah D, Davidson MB. Utility of A1C for diabetes screening in the 1999 2004 NHANES population. Diabetes Care 2007;30:2233-5.
13. van Leiden HA, Dekker JM, Moll AC, Nijpels G, Heine RJ, Bouter LM, Stehouwer CD, Polak BC. Risk factors for incident retinopathy in a diabetic and nondiabetic population: the Hoo- rn study. Arch Ophthalmol 2003;121:245-51.
14. Tapp RJ, Tikellis G, Wong TY, Harper CA, Zimmet PZ, Shaw JE; Australian Diabetes Obesity and Lifestyle Study Group.
Longitudinal association of glucose metabolism with retinopa- thy: results from the Australian Diabetes Obesity and Lifestyle (AusDiab) study. Diabetes Care 2008;31:1349-54.
15. Little RR, Rohlfing CL, Wiedmeyer HM, Myers GL, Sacks DB, Goldstein DE; NGSP Steering Committee. The national glyco- hemoglobin standardization program: a five-year progress re- port. Clin Chem 2001;47:1985-92.
16. Nakagami T, Tominaga M, Nishimura R, Yoshiike N, Daimon M, Oizumi T, Tajima N. Is the measurement of glycated hemo- globin A1c alone an efficient screening test for undiagnosed diabetes? Japan National Diabetes Survey. Diabetes Res Clin Pract 2007;76:251-6.
17. Kim SY, Park JH, Kang SM, Jin HY, Baek HS, Park TS. Value of HbA1c for diabetic screening in subject with normal fasting glucose. Korean Diabetes J 2008;32 Suppl 2:S218.
18. Ku YH, Yoo SH, Jung HS, Lim S, Moon MK, Choi SH, Jang HC, Park KS, Kim SY, Lee HK, Cho YM. Diagnostic value of HbA1c different clinical setting with different prevelence of diabetes mellitus. Korean Diabetes J 2008;32 Suppl 8:S311.
19. Bae JC, Rhee EJ, Choi ES, Kim JH, Kim WJ, Yoo SH, Park SE, Park CY, Lee WY, Oh KW, Park SW, Kim SW. The cutoff value of HbA1c in predicting diabetes in Korean adults in a univer- sity hospital in Seoul. Korean Diabetes J 2009;33:503-10.
20. Jung JH, Kim ST, Cho YZ, Lee HN, Kim JY, Kim JH, Lim DM, Lee KW, Kim BJ, Park KY. Acceptability of HbA1c values as a diagnostic tool for diabetes mellitus in Korea. Korean J Med 2010;79:673-80.
21. Engelgau MM, Narayan KM, Herman WH. Screening for type 2 diabetes. Diabetes Care 2000;23:1563-80.
22. Rohlfing CL, Little RR, Wiedmeyer HM, England JD, Madsen R, Harris MI, Flegal KM, Eberhardt MS, Goldstein DE. Use of GHb (HbA1c) in screening for undiagnosed diabetes in the
U.S. population. Diabetes Care 2000;23:187-91.
23. Eid WE, Pottala JV. Value of hemoglobin A1c in diagnosing diabetes mellitus within a chronic disease management system illustrated by the receiver operating characteristic curve. En- docr Pract 2010;16:14-20.
24. Larsen ML. The utility of glycated hemoglobin in identification of impaired glucose tolerance. Diabetes Res 1989;12:67-70.
25. Verrillo A, de Teresa A, Golia R, Nunziata V. The relationship between glycosylated haemoglobin levels and various degrees of glucose intolerance. Diabetologia 1983;24:391-3.
26. Weykamp CW, Penders TJ, Miedema K, Muskiet FA, van der Slik W. Standardization of glycohemoglobin results and refer- ence values in whole blood studied in 103 laboratories using 20 methods. Clin Chem 1995;41:82-6.
27. Ministry of Health and Welfare; Korea Centers for Disease Control and Prevention: Korean National Health and Nutri- tion Examination Survey: the 4th report (2008). Available from: http://www.bokjiro.go.kr/data/statusView.do?board_
sid=297&data_sid=209708&searchSort=REG_DESC&pageIn dex=1&searchWrd=%EA%B5%AD%EB%AF%BC%EA%B1
%B4%EA%B0%95%ED%86%B5%EA%B3%84&searchCont=
&pageUnit=10 (updated 2009 Dec 12).
28. Centers for Disease Control and Prevention: National Health and Nutrition Examination Survey (NHANES) 2005-2006.
Available from: http://www.cdc.gov/nchs/nhanes/nhanes 2005-2006/nhanes05_06.htm (updated 2011 Apr 29).
29. Yoon KH, Ko SH, Cho JH, Lee JM, Ahn YB, Song KH, Yoo SJ, Kang MI, Cha BY, Lee KW, Son HY, Kang SK, Kim HS, Lee IK, Bonner-Weir S. Selective beta-cell loss and alpha-cell expan- sion in patients with type 2 diabetes mellitus in Korea. J Clin Endocrinol Metab 2003;88:2300-8.
30. McCarter RJ, Hempe JM, Chalew SA. Mean blood glucose and biological variation have greater influence on HbA1c levels than glucose instability: an analysis of data from the Diabetes Control and Complications Trial. Diabetes Care 2006;29:352-5.
31. Herman WH, Ma Y, Uwaifo G, Haffner S, Kahn SE, Horton ES, Lachin JM, Montez MG, Brenneman T, Barrett-Connor E;
Diabetes Prevention Program Research Group. Differences in A1C by race and ethnicity among patients with impaired glu- cose tolerance in the Diabetes Prevention Program. Diabetes Care 2007;30:2453-7.
32. Selvin E, Zhu H, Brancati FL. Elevated A1C in adults without a history of diabetes in the U.S. Diabetes Care 2009;32:828-33.