D I A B E T E S & M E T A B O L I S M J O U R N A L
This is an Open Access article distributed under the terms of the Creative Commons Attribution Non-Commercial License (https://creativecommons.org/licenses/by-nc/4.0/) which permits unrestricted non-commercial use, distribution, and reproduction in any medium, provided the original work is properly cited.
Clinical Significance of Body Fat Distribution in
Coronary Artery Calcification Progression in Korean Population
Heesun Lee1,2, Hyo Eun Park1,2, Ji Won Yoon2,3, Su-Yeon Choi1,2
1Division of Cardiology, Seoul National University Hospital Healthcare System Gangnam Center, Seoul,
2Department of Internal Medicine, Seoul National University College of Medicine, Seoul,
3Division of Endocrinology, Seoul National University Hospital Healthcare System Gangnam Center, Seoul, Korea
Background: Although obesity differs according to ethnicity, it is globally established as a solid risk factor for cardiovascular dis- ease. However, it is not fully understood how obesity parameters affect the progression of coronary artery calcification (CAC) in Korean population. We sought to evaluate the association of obesity-related parameters including visceral adipose tissue (VAT) measurement and CAC progression.
Methods: This retrospective observational cohort study investigated 1,015 asymptomatic Korean subjects who underwent serial CAC scoring by computed tomography (CT) with at least 1-year interval and adipose tissue measurement using non-contrast CT at baseline for a routine checkup between 2003 and 2015. CAC progression, the main outcome, was defined as a difference of
≥2.5 between the square roots of the baseline and follow-up CAC scores using Agatston units.
Results: During follow-up (median 39 months), 37.5% of subjects showed CAC progression of a total population (56.4 years, 80.6% male). Body mass index (BMI) ≥25 kg/m2, increasing waist circumferences (WC), and higher VAT/subcutaneous adipose tissue (SAT) area ratio were independently associated with CAC progression. Particularly, predominance of VAT over SAT at
≥30% showed the strongest prediction for CAC progression (adjusted hazard ratio, 2.20; P<0.001) and remained of prognostic value regardless of BMI or WC status. Further, it provided improved risk stratification of CAC progression beyond known prog- nosticators.
Conclusion: Predominant VAT area on CT is the strongest predictor of CAC progression regardless of BMI or WC in apparently healthy Korean population. Assessment of body fat distribution may be helpful to identify subjects at higher risk.
Keywords: Body fat distribution; Coronary artery disease; Multidetector computed tomography; Obesity, abdominal
Corresponding author: Su-Yeon Choi https://orcid.org/0000-0001-9977-4740 Department of Internal Medicine, Seoul National University Hospital Healthcare System Gangnam Center, 152 Teheran-ro, Gangnam-gu, Seoul 06236, Korea
E-mail: [email protected]
INTRODUCTION
Coronary artery disease (CAD) is the leading cause of death worldwide, leading to a high medical and socioeconomic bur- den [1]. Recently, efforts have been focused more on disease prevention to identify subjects at a higher risk and to manage the related risk factors to prevent development and progres- sion of atherosclerosis. Assessment of coronary artery calcifi-
cation (CAC) using coronary artery calcium scores (CACS) has been established as a screening tool for CAD, with a rela- tively low amount of radiation, cost, and time [2]. In particular, CAC progression assessed by repeated measurements of CACS is a strong predictor of cardiovascular events and superior to baseline CACS even in asymptomatic cohort studies [3,4].
Obesity is one of the most contributing factors to CAD de- velopment and progression, and causes other traditional risk https://doi.org/10.4093/dmj.2019.0161
pISSN 2233-6079 · eISSN 2233-6087
factors [5]. Especially, visceral adiposity as a sick fat plays an important role in the deterioration of cardiometabolic profile.
It is well known that cytokines from visceral fat induce inflam- mation and endothelial dysfunction, followed by atherosclero- sis, and lead to CAD [6,7]. Previous large-scale studies have demonstrated that visceral adiposity is significantly associated with various cardiovascular diseases from incident CAD to myocardial infarction and cardiac death [8-10]. Although sim- ple anthropometric measurements such as body mass index (BMI) and waist circumferences (WC) have been suggested as surrogate markers of visceral adiposity, they have some limits to explain the cardiometabolic heterogeneity, to selectively dis- tinguish visceral fat, and to understand the mechanism by which body fat distribution could affect cardiovascular risk [11]. Furthermore, considering that obesity weighs on CAD differently according to ethnicity and most studies have been conducted in Caucasians, an in-depth study on the Asian pop- ulation is required [12,13]. Thus, we sought to investigate the clinical significance of different body fat compositions on CAC progression in apparently healthy Korean population.
METHODS
Study population
We retrospectively reviewed the medical records and imaging studies of 46,637 consecutive adult subjects who underwent adipose tissue measurement using non-contrast abdominal computed tomography (CT) for general health checkup at Seoul National University Hospital Healthcare System Gang- nam Center, between January 2003 and February 2015. Among the initial fat cohort, 6,049 Korean subjects who underwent CAC scoring on the same day of abdomen CT were enrolled.
These subjects chose to take the exams on their own will be- cause they had one or more cardiovascular risk factors or atypi- cal chest pain. Among 6,049 subjects, 4,973 subjects without a follow-up CAC scoring, 18 subjects with a history of coronary revascularization, 39 subjects without clinical information available, and four subjects with uninterpretable imaging data were excluded from the analysis. Finally, 1,015 subjects were analyzed for this study.
The study protocol conforms to the ethical guidelines in the Declaration of Helsinki and was approved by the Institutional Review Board of Seoul National University Hospital (H-0907- 045-286). The requirement for written informed consent was waived by the board due to the retrospective nature of the study.
Clinical and laboratory evaluation
The methods used for this study have been previously described [14]. Anthropometric information including height, weight, WC, and blood pressure (BP) were collected by a trained nurse on the day of baseline CT. BMI was calculated as weight divid- ed by height in meters (kg/m2), and WC was measured at the midpoint between the lower costal margin and the iliac crest.
BP was taken as an average after measuring twice using an au- tomated BP monitor with at least 5-minute interval in a seated resting position. A self-reported questionnaire was utilized to assess smoking, defined as a consumption of at least 1 cigarette a day for the previous 12 months, and prior medication history including antiplatelet agent and statin. Laboratory evaluations included serum total cholesterol, triglycerides, high-density li- poprotein cholesterol (HDL-C), low-density lipoprotein cho- lesterol (LDL-C), fasting glucose, fasting insulin, glycated he- moglobin (HbA1c), high-sensitivity C-reactive protein (hs- CRP), and homocysteine levels. An automatic analyzer at the Department of Laboratory Medicine at Seoul National Univer- sity Hospital (Toshiba 200 FR autoanalyzer; Toshiba, Tokyo, Japan) was used for the analysis of all biochemical tests. A pre- vious medical history was defined as follows: hypertension as a systolic BP ≥140 mm Hg or diastolic BP ≥90 mm Hg or the use of anti-hypertensive medication; diabetes mellitus (DM) as a fasting glucose ≥126 mg/dL or HbA1c ≥6.5%, and/or treat- ment by an oral hypoglycemic agent or insulin; dyslipidemia as total cholesterol ≥240 mg/dL, LDL-C ≥160 mg/dL, triglycer- ide ≥200 mg/dL, HDL-C <40 mg/dL, or the use of statin; and chronic kidney disease as Modification of Diet in Renal Dis- ease glomerular filtration rate <60 mL/min/1.73 m2 or sus- tained albuminuria for 3 months.
Measurement of CAC and its progression
All subjects underwent unenhanced calcium scan for CAC scoring using 16- (SOMATOM Sensation 16; Siemens Medical Solutions, Forchheim, Germany) or 256-detector row CT scan- ner (Brilliance iCT 256; Philips Medical Systems Inc., Cleve- land, OH, USA). A standard protocol was applied, with a pro- spective electrocardiography triggering and image acquisition initiated at 70% of the cardiac cycle for motion-free images of the coronary arteries (3 mm thick slice, 200 mm field of view, 120 kV tube voltage, 110 mA tube current). Scanned images were reconstructed retrospectively with a non-overlapping slice thickness of 2.5 mm. CACS was automatically calculated using the Agatston scoring system (in units) with dedicated
software (Rapidia 2.8; INFINITT, Seoul, Korea) and graded as follows: 0, 1 to 99, 100 to 399, and ≥400 [15]. CAC progression was the main outcome measure of this study, which was de- fined as a difference of ≥2.5 between the square roots (√) of the baseline and follow-up CACS (∆√transformed CAC) to minimize the effect of interscan variability [16].
Measurement of adipose tissue area using CT
On the same day, all participants underwent abdominal fat CT to evaluate the fat distribution including visceral adipose tissue (VAT), subcutaneous adipose tissue (SAT), and total adipose tis- sue (TAT) areas, as described previously [17-19]. In brief, the adipose tissue areas were measured at the transverse section of the umbilicus level using a 16-detector row CT scanner (SO- MATOM Sensation 16) with a thickness of 5 mm (120 kV tube voltage, 260 mA tube current). Settings for the attenuation val- ues specific for adipose tissue, which ranged from −250 to −50 Hounsfield units [17-19], were applied to electronically calculate the fat areas and distribution, using Rapidia 2.8 CT software.
Statistical analysis
All analyses were performed using SPSS version 22.0 (IBM Co., Armonk, NY, USA) and MedCalc for Windows version 13.1.2.0 (MedCalc Software, Ostend, Belgium). Continuous variables were presented as mean±standard deviation or me- dian and interquartile range (IQR), and categorical variables were expressed as numbers and percentages. Intergroup differ- ences of continuous variables were compared using Student’s t- test for independent samples or the Mann-Whitney test, while those of categorical variables were compared using the chi- square test or Fisher’s exact test, as appropriate. The Cox pro- portional hazard model with a forward selection method was used to estimate the risk of CAC progression, according to clin- ical, laboratory, and obesity-related parameters. The risk of CAC progression was expressed as a hazard ratio (HR) and cor- responding 95% confidence interval from univariable and multivariable analyses in order. Receiver-operating character- istic (ROC) curves were plotted to determine VAT/SAT ratio for the prediction of CAC progression, and the optimal cutoff was determined by the maximum sum of sensitivity and speci- ficity. To show the independent and stronger impact of body fat distribution on CAC progression, the relationship of VAT/
SAT ratio with CAC progression was analyzed according to BMI and WC subgroups. In addition, a sequential Cox analysis using three incremental models was performed to evaluate the
additive value of body fat distribution over clinical risk factors and conventional obesity surrogate markers in predicting CAC progression. Model 1 consisted of clinical risk factors repre- sented by the Framingham risk score (FRS)+obesity defined by BMI; Model 2 of FRS+obesity defined by BMI+increased WC; and Model 3 of FRS+obesity defined by BMI+increased WC+increased VAT/SAT ratio. The change in overall log-like- lihood ratio chi-square was used to assess increases in predic- tive power with subsequent parameters. A value of P<0.05 was considered statistically significant.
RESULTS
Baseline characteristics of the study population
The baseline characteristics of the 1,015 study participants (mean age, 56.4 years; men 80.6%) are summarized in Table 1.
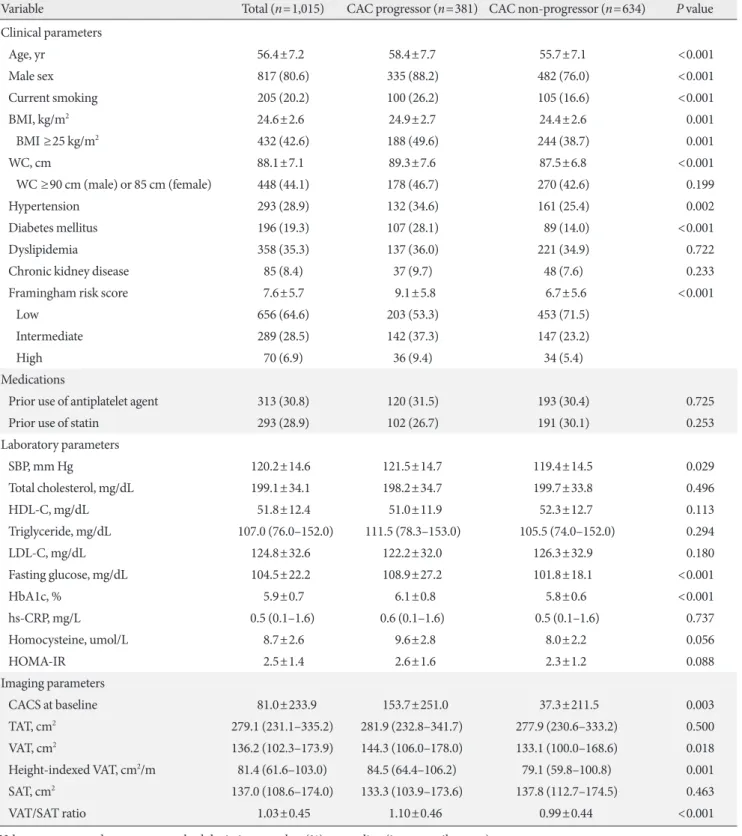
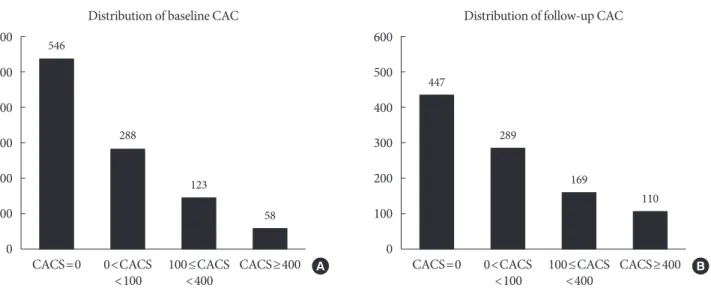
On the basis of the FRS, 64.6% of the studied patients were classified as low risk (10-year risk <10%), 28.5% as intermedi- ate risk (10% to 20%), and 6.9% as high risk (>20%), and their mean homeostatic model assessment for insulin resistance (HOMA-IR) was 2.5, indicating low insulin resistance. Both suggest that the study population is mainly composed of sub- jects with low risk. Pre-existing hypertension, DM, and dyslip- idemia were found in 28.9%, 19.3%, and 35.3% of the total subjects, respectively. One-third of the study participants were on antiplatelet agent or statin treatment. The mean BMI and WC were 24.6 kg/m2 and 88.1 cm, respectively, and approxi- mately 40% of the study population was considered obese ac- cording to the criteria from the World Health Organization (WHO)’s Asia-Pacific guideline [20]. TAT, SAT, and VAT areas from CT were 279.1, 136.2, and 137.0 cm2, respectively. The mean CACS at baseline calcium scan was 81.0 and that at fol- low-up scan was 149.9. Among the study participants, 546 sub- jects (53.8%) did not have detectable CAC (CACS 0) and 181 (17.8%) had CACS ≥100 at baseline. From 546 with an initial score of zero, 103 subjects exhibited coronary calcification at follow-up. The median interval between baseline and follow- up calcium scans was 39 months (IQR, 25 to 54 months), and the distributions of CACS of baseline and follow-up calcium scans were displayed in Fig. 1.
Progression of CAC
CAC progression was found in 381 subjects (37.5%). The me- dian interval between baseline and follow-up calcium scans was significantly shorter in CAC progressors than that in CAC
Table 1. Baseline and imaging characteristics according to status of CAC progression
Variable Total (n=1,015) CAC progressor (n=381) CAC non-progressor (n=634) P value
Clinical parameters
Age, yr 56.4±7.2 58.4±7.7 55.7±7.1 <0.001
Male sex 817 (80.6) 335 (88.2) 482 (76.0) <0.001
Current smoking 205 (20.2) 100 (26.2) 105 (16.6) <0.001
BMI, kg/m2 24.6±2.6 24.9±2.7 24.4±2.6 0.001
BMI ≥25 kg/m2 432 (42.6) 188 (49.6) 244 (38.7) 0.001
WC, cm 88.1±7.1 89.3±7.6 87.5±6.8 <0.001
WC ≥90 cm (male) or 85 cm (female) 448 (44.1) 178 (46.7) 270 (42.6) 0.199
Hypertension 293 (28.9) 132 (34.6) 161 (25.4) 0.002
Diabetes mellitus 196 (19.3) 107 (28.1) 89 (14.0) <0.001
Dyslipidemia 358 (35.3) 137 (36.0) 221 (34.9) 0.722
Chronic kidney disease 85 (8.4) 37 (9.7) 48 (7.6) 0.233
Framingham risk score 7.6±5.7 9.1±5.8 6.7±5.6 <0.001
Low 656 (64.6) 203 (53.3) 453 (71.5)
Intermediate 289 (28.5) 142 (37.3) 147 (23.2)
High 70 (6.9) 36 (9.4) 34 (5.4)
Medications
Prior use of antiplatelet agent 313 (30.8) 120 (31.5) 193 (30.4) 0.725
Prior use of statin 293 (28.9) 102 (26.7) 191 (30.1) 0.253
Laboratory parameters
SBP, mm Hg 120.2±14.6 121.5±14.7 119.4±14.5 0.029
Total cholesterol, mg/dL 199.1±34.1 198.2±34.7 199.7±33.8 0.496
HDL-C, mg/dL 51.8±12.4 51.0±11.9 52.3±12.7 0.113
Triglyceride, mg/dL 107.0 (76.0–152.0) 111.5 (78.3–153.0) 105.5 (74.0–152.0) 0.294
LDL-C, mg/dL 124.8±32.6 122.2±32.0 126.3±32.9 0.180
Fasting glucose, mg/dL 104.5±22.2 108.9±27.2 101.8±18.1 <0.001
HbA1c, % 5.9±0.7 6.1±0.8 5.8±0.6 <0.001
hs-CRP, mg/L 0.5 (0.1–1.6) 0.6 (0.1–1.6) 0.5 (0.1–1.6) 0.737
Homocysteine, umol/L 8.7±2.6 9.6±2.8 8.0±2.2 0.056
HOMA-IR 2.5±1.4 2.6±1.6 2.3±1.2 0.088
Imaging parameters
CACS at baseline 81.0±233.9 153.7±251.0 37.3±211.5 0.003
TAT, cm2 279.1 (231.1–335.2) 281.9 (232.8–341.7) 277.9 (230.6–333.2) 0.500
VAT, cm2 136.2 (102.3–173.9) 144.3 (106.0–178.0) 133.1 (100.0–168.6) 0.018
Height-indexed VAT, cm2/m 81.4 (61.6–103.0) 84.5 (64.4–106.2) 79.1 (59.8–100.8) 0.001
SAT, cm2 137.0 (108.6–174.0) 133.3 (103.9–173.6) 137.8 (112.7–174.5) 0.463
VAT/SAT ratio 1.03±0.45 1.10±0.46 0.99±0.44 <0.001
Values are presented as mean±standard deviation, number (%), or median (interquartile range).
CAC, coronary artery calcification; BMI, body mass index; WC, waist circumference; SBP, systolic blood pressure; HDL-C, high-density lipo- protein cholesterol; LDL-C, low-density lipoprotein cholesterol; HbA1c, glycosylated hemoglobin; hs-CRP, high-sensitivity C-reactive protein;
HOMA-IR, homeostatic model assessment for insulin resistance; CACS, coronary artery calcium scores; TAT, total adipose tissue; VAT, visceral adipose tissue; SAT, subcutaneous adipose tissue.
non-progressors (median, 37 months [IQR, 25 to 50] vs. 40 months [IQR, 27 to 60], P<0.001). Compared with non-pro- gressors, CAC progressors were older, with male predomi- nance, and smokers. Comorbidities such as hypertension and DM were more frequent, and FRS was higher in CAC progres- sors. The adipose tissue area quantified by CT was significantly higher in CAC progressors than in non-progressors. On aver- age, CAC progressors had VAT of 10% more than SAT, while
CAC non-progressors had VAT and SAT at a similar propor- tion (VAT/SAT ratio of 1.10 in CAC progressors vs. 0.99 in non- progressors, P<0.001).
Predictors of CAC progression
To evaluate the significant predictors of CAC progression, the Cox regression analyses of the clinical and imaging character- istics were performed (Table 2). Among the clinical parame- Table 2. Univariable and multivariable analysis of factors associated with CAC progression
Variable Univariable analysis Multivariable analysisa
Unadjusted HR (95% CI) P value Adjusted HR (95% CI) P value Clinical and laboratory parameters
Age (per 10 years increment) 1.54 (1.31–1.81) <0.001
Male sex 2.35 (1.64–3.37) <0.001
Current smoking 1.79 (1.32–2.44) <0.001
Hypertension 1.59 (1.15–2.79) <0.001
Diabetes mellitus 2.64 (1.23–4.23) <0.001
Dyslipidemia 1.64 (1.09–3.52) <0.001
Chronic kidney disease 1.31 (0.94–2.06) 0.234
High FRS 1.77 (1.44–2.18) <0.001
Prior use of antiplatelet agent 0.91 (0.67–1.01) 0.069
Prior use of statin 0.88 (0.55–1.25) 0.102
SBP ≥140 mm Hg 1.72 (1.12–2.63) 0.012
Triglyceride ≥200 mg/dL 1.17 (0.79–1.74) 0.433
HDL-C <40 mg/dL 1.00 (0.69–1.45) 0.989
LDL-C ≥160 mg/dL 0.92 (0.55–1.55) 0.764
Fasting glucose ≥100 mg/dL 1.45 (1.12–1.87) 0.004
hs-CRP ≥2.0 mg/L 1.28 (1.04–1.67) 0.034
HOMA-IR ≥3.0 0.92 (0.69–1.24) 0.598
Obesity-related parameters
BMI ≥25 kg/m2 1.56 (1.21–2.02) 0.001 1.42 (1.09–1.86) 0.009
WC ≥90 cm (male) or 85 cm (female) 1.18 (1.02–1.53) 0.029 1.10 (1.01–1.43) 0.042
TATb 1.00 (0.99–1.01) 0.869 - -
VATb 1.03 (1.01–1.06) 0.007 1.01 (0.99–1.04) 0.399
Highest quartile of VAT (Q4) 1.78 (1.34–2.36) <0.001 1.43 (1.05–2.15) 0.016
Height-indexed VATc 1.05 (1.02–1.09) 0.007 1.00 (1.00–1.01) 0.098
SATb 0.99 (0.99 –1.00) 0.079 - -
VAT/SAT ratio 2.87 (1.79–4.38) <0.001 1.69 (1.27–2.24) <0.001
VAT/SAT ratio ≥1.30 3.01 (2.25–4.03) <0.001 2.20 (1.74–2.78) <0.001
CAC, coronary artery calcification; HR, hazard ratio; CI, confidence interval; FRS, Framingham risk score; SBP, systolic blood pressure; HDL-C, high- density lipoprotein cholesterol; LDL-C, low-density lipoprotein cholesterol; hs-CRP, high-sensitivity C-reactive protein; HOMA-IR, homeostatic model assessment for insulin resistance; BMI, body mass index; WC, waist circumference; TAT, total adipose tissue; VAT, visceral adipose tissue; SAT, subcuta- neous adipose tissue.
aMultivariable analysis was performed by adjusting for FRS, a history of diabetes mellitus, and hs-CRP >2.0 mg/L, bTotal, visceral, and subcutaneous fat area were assessed per 1 cm2 increment, cHeight-indexed visceral fat area was assessed per 1 cm2/m increment.
ters, age, male sex, current smoking, a history of hypertension, DM, or dyslipidemia, higher FRS, elevated BP, serum fasting glucose, and hs-CRP were significantly associated with CAC progression. Among obesity-related parameters, BMI ≥25 kg/
m2 (unadjusted HR, 1.56; P=0.001) and increased WC (unad- justed HR, 1.18; P=0.029) significantly advanced coronary calcification. Moreover, the absolute visceral fat area was a sol- id predictor of CAC progression (unadjusted HR, 1.03, P=
0.007 for every 1 cm2 increase of VAT; unadjusted HR, 1.05, P=0.007 for height-indexed VAT). When stratified by VAT quartiles, the risk of CAC progression tended to increase grad- ually with increasing VAT areas (Fig. 2). Particularly, VAT/SAT ratio showed the strongest association with CAC progression (unadjusted HR, 2.87; P<0.001). In the ROC analysis, the opti- mal cutoff for VAT/SAT ratio to predict CAC progression was determined as 1.30 (area under the curve 0.691, sensitivity 75.6%, specificity 55.7%, P<0.001). Overall, subjects with VAT/SAT ratio ≥1.30 tended to have more traditional cardio- vascular risk factors than those with VAT/SAT ratio <1.30 (Supplementary Table 1). It is noteworthy that higher triglycer- ide, hs-CRP, and HOMA-IR were evident in subjects with VAT/SAT ratio ≥1.30, recalling attention to the close relation- ship of visceral obesity with these parameters. VAT/SAT ratio
≥1.30 demonstrated a greater than 3-fold hazard increment of CAC progression (unadjusted HR, 3.01; P<0.001). In particu- lar, the risk of CAC progression by VAT/SAT ratio ≥1.30 was considerably higher in subjects with CACS 0 at baseline (unad- justed HR, 3.28; P<0.001) than those with CACS >0 at baseline
Fig. 1. The distribution of coronary artery calcium scores (CACS) at (A) baseline and (B) follow-up calcium scans. CAC, coro- nary artery calcification.
Fig. 2. Kaplan-Meier curve for the risk of coronary artery cal- cification (CAC) progression according to visceral adipose tis- sue (VAT) on computed tomography. When stratified by VAT quartiles, the risk of CAC progression tended to increase grad- ually with increasing VAT areas. CI, confidence interval; HR, hazard ratio; Q, quartile. aThe multivariable model was adjust- ed for Framingham risk score, a history of diabetes mellitus, and higher high-sensitivity C-reactive protein.
600 500 400 300 200 100 0
4 3 2 1 0 600 500 400 300 200 100 0
Cumulative hazard for CAC progression
CACS=0
2 4 6 8 10 Follow-up (yr)
VAT quartiles Unadjusted HR (95% CI) P Adjusted HR (95% CI)a P
Q1 Reference - Reference -
Q2 1.13 (0.83−1.53) 0.433 1.05 (0.77−1.44) 0.734 Q3 1.36 (1.02−1.82) 0.032 1.27 (1.00−1.72) 0.047 Q4 1.78 (1.34−2.36) <0.001 1.53 (1.13−2.07) 0.006
CACS=0 546
447
288 289
123 169
58
110
0<CACS
<100 0<CACS
<100 100≤CACS
<400 100≤CACS
<400
CACS≥400 CACS≥400
Distribution of baseline CAC
Overall log-rank P<0.001
Distribution of follow-up CAC
A B
(unadjusted HR, 1.85; P=0.001). To adjust for the significant clinical variables and to avoid overfitting, we included FRS, a history of DM, and higher hs-CRP in the multivariate analysis.
Obesity-related parameters which were significant in the uni- variable analysis remained as independent predictors of wors- ening coronary calcification, except VAT area per se and height- indexed VAT area. Notably, VAT/SAT ratio ≥1.30 was a robust predictor of CAC progression (adjusted HR, 2.20; P<0.001).
The results emphasizing the strong impact of VAT/SAT ratio
≥1.30 did not changed even after adjusting for age, male sex, current smoking, a history of hypertension, DM, and dyslipid- emia, systolic BP ≥140 mm Hg, fasting glucose ≥100 mg/dL, and hs-CRP >2.0 mg/L, instead of FRS (Supplementary Table 2). The sex-specific analysis displayed results similar to those of the total cohort, even though there was an interaction be- tween sex (P for interaction 0.010) (Supplementary Table 3).
Furthermore, it is worthy to mention that the impact of VAT/
SAT ≥1.30 on the risk of CAC progression was stronger in women than in men. Thus, it is conceivable that effects of obe- sity can be different according to sex. Kaplan-Meier curves il- lustrated the increased risk of CAC progression in subjects with VAT/SAT ratio ≥1.30, compared with those with VAT/
SAT <1.30 (log-rank P value<0.001). After 5 years of follow- up, the risk of CAC progression between those with VAT/SAT
≥1.30 and with VAT/SAT <1.30 was approximately twice apart (Fig. 3).
Importance of body fat distribution beyond traditional obesity surrogate markers
Consistent with prior results [21-23], our study demonstrated that various obesity-related parameters were predictive of CAC progression. However, each component did not show a strong correlation (BMI and VAT/SAT ratio, r=0.139, P<0.001; WC and VAT/SAT ratio, r=0.173, P<0.001). To verify the clinical implication of CT-derived VAT/SAT ratio as a new indicator of obesity and a powerful predictor of CAC progression, we com- pared the risk to worsen coronary calcification by VAT/SAT ratio according to the BMI and WC status. VAT/SAT ratio and VAT/SAT ratio ≥1.30 were consistently able to stratify the risk of CAC progression in all subgroups, independent of BMI and WC status (Table 3). This shows us the importance of body fat distribution beyond the traditional parameters to define obesi- ty, by an increase in the HR for CAC progression when VAT is
≥30% greater than SAT (adjusted HR, 4.42, P<0.001 for nor- mal BMI; adjusted HR 6.34, P<0.001 for overweight BMI; ad-
justed HR 3.98, P<0.001 for normal WC). When we also eval- uated additional predictive value of VAT/SAT ratio ≥1.30 on top of a model with conventional risk factors, VAT/SAT ratio
≥1.30 provided further information on progressing CAC (Supplementary Table 4, Supplementary Fig. 1).
DISCUSSION
The main findings of the present study are as follows: (1) vari- ous parameters representing obesity significantly affected CAC progression in apparently healthy Korean population; (2) the distribution of body fat demonstrated better the impact on CAC progression than the excess adiposity per se; and (3) spe- cifically, predominance of VAT over SAT at ≥30% was the in- dependent strongest predictor of CAC progression and pro- vided further risk stratification beyond clinical risk factors and traditional obesity surrogate markers. Altogether, this study evaluated the clinical implication of regional body fat distribu- tion assessed using CT by redeeming the limitations of tradi- tional obesity surrogate markers in apparently healthy Korean Fig. 3. Kaplan-Meier curve for the risk of coronary artery cal- cification (CAC) progression according to visceral adipose tis- sue (VAT)/subcutaneous adipose tissue (SAT) ratio on com- puted tomography. VAT/SAT ratio ≥1.30 (dark blue solid line) showed a significant increase in the risk of CAC progression.
After 5 years of follow-up, the risk of CAC progression in sub- ject with VAT/SAT ratio ≥1.30 was approximately twice as high as those with VAT/SAT <1.30.
4 3 2 1
Cumulative hazard for CAC progression 0
2 4 6 8 10 Follow-up (yr)
Number at risk
VAT/SAT <1.30 427 336 136 39 3 0
VAT/SAT ≥1.30 588 459 198 48 8 0
VAT/SAT <1.30 VAT/SAT ≥1.30 Overall log-rank P<0.001
subjects and suggested that body fat distribution may be po- tentially helpful for clinical decision making regarding the pre- vention and management of future cardiovascular disease.
Obesity is one of the biggest health concerns across the country, and its prevalence is steadily increasing in Korea [24].
As traditional obesity surrogate markers, simple anthropomet- ric indices, such as BMI and WC, have been widely used to es- timate cardiovascular risk in previous studies and clinical prac- tice [11]. However, these parameters are insufficient to distin- guish where body fat is mainly located and whether an indi- vidual is metabolically healthy or not, since different body compositions matters in metabolic outcomes [11,25]. Hence, recent large studies have focused on the regional distribution of body fat by means of the advance of imaging modalities, and at present, body fat assessment by CT is considered the gold standard for body fat distribution and quantification [11,26].
In many prior researches using CT, excessive intra-abdominal fat deposition is significantly associated with CAC, in the de- velopment of atherosclerosis and subclinical CAD in the gen-
eral population [18,21,27]. Our group has also previously re- ported convincing evidence that increased visceral fat on CT was tightly associated with moderate to severe coronary calci- fication in 1,336 healthy Korean men [18]. However, studies evaluating the temporal relationship between visceral adiposi- ty and CAC progression are scarce. The present study is one of the largest cohort studies that investigated the impact of body fat distribution on subclinical CAD based on CAC progres- sion. Obviously, CAC progressors were more of obesity than non-progressors, despite under different definitions. After ad- justing for confounding factors, VAT/SAT ratio showed an in- dependent prognostic value for CAC progression, whereas VAT area per se lost the statistical significance. In addition, when dividing the study population in accordance with BMI or WC, predominance of visceral fat and VAT/SAT ratio ≥1.30 were consistently predictive of CAC progression even in sub- jects with normal BMI or normal WC. These call attention to body fat composition rather than the absolute amount itself, and warn individuals who are assumed “normal” by BMI or Table 3. The predictive values of visceral to subcutaneous fat ratio for CAC progression
Variable Adjusted HR (95% CI)a P value
According to BMI
Normal BMI (BMI <23 kg/m2)
VAT/SAT ratio 2.33 (1.89–4.84) <0.001
VAT/SAT ratio ≥1.30 4.42 (2.32–8.45) <0.001
Overweight (BMI 23–25 kg/m2)
VAT/SAT ratio 4.34 (1.38–9.89) 0.001
VAT/SAT ratio ≥1.30 6.34 (3.26–12.34) <0.001
Obese (BMI ≥25 kg/m2)
VAT/SAT ratio 1.71 (1.16–2.92) 0.030
VAT/SAT ratio ≥1.30 2.74 (1.78–4.22) <0.001
According to WC
Normal WC (WC <90 cm male or 85 cm female)
VAT/SAT ratio 3.16 (2.33–4.29) <0.001
VAT/SAT ratio ≥1.30 3.98 (2.83–5.57) <0.001
Increased WC (WC ≥90 cm male or 85 cm female)
VAT/SAT ratio 3.50 (2.12–5.32) <0.001
VAT/SAT ratio ≥1.30 5.73 (3.63–9.16) <0.001
CAC, coronary artery calcification; HR, hazard ratio; CI, confidence interval; BMI, body mass index; VAT, visceral adipose tissue; SAT, subcuta- neous adipose tissue; WC, waist circumference.
aMultivariable analysis was performed by adjusting for Framingham risk score, a history of diabetes mellitus, and high-sensitivity C-reactive protein >2.0 mg/L.
WC but possess VAT-dominant body fat pattern. In addition, VAT/SAT ratio ≥1.30 added the incremental prognostic value over clinical risk factors and traditional obesity surrogate markers. Consequentially, our findings emphasize the clinical implication of visceral adiposity on promoting the calcification in the coronary artery and suggest that CT-assessed body fat distribution may perform better in identifying high-risk sub- jects who might benefit from meticulous surveillance and ag- gressive preventive strategy for CAD.
Obesity, in particular, visceral obesity, is a well-known risk factor of cardiovascular disease. However, considering that obesity differs by ethnicity and most studies were done on Caucasian in multi-ethnic cohorts of Western countries [28- 30], the main issues regarding obesity should be addressed in Asian population. As presented in our baseline characteristics, Koreans have relatively lower BMI and WC than those from other Western studies, showing only 22 subjects (2.2%) with BMI ≥30 kg/m2, who would be regarded as “obese” by general definition in the Western countries. On the contrary, the amount of body fat composition calculated on CT was comparable with that in other Western studies [31,32]. Additionally, hyper- triglyceridemia, increased HOMA-IR, and WC, which typify hypertriglyceridemic obesity, were reported to be less frequent in our study population, compared with studies on Caucasian [33,34]. These findings in the present study coincide with prior reports that Asians have lower BMI but higher body fat per- centage than Caucasians [35,36] and support the legitimacy of the WHO’s Asia-Pacific region-specific classification of obesity [20]. Recent shift from anthropometry to imaging to define obesity is derived from the considerable variation in visceral adiposity at a given body weight, BMI, or WC [11,37,38]. Nev- ertheless, the ease in measurement and good correlation with visceral adiposity allow anthropometric indices to be used still in routine clinical practice [11,39]. However, this study re- vealed weaker correlations between VAT area and BMI or WC than other Western studies, implying the tricky interpretation of simple anthropometry and greater necessity of CT-assessed body fat distribution in Asians. Accordingly, the direct assess- ment of body fat composition using CT is expected to explain well the influence on CAC progression and to lead to an appro- priate risk management better than BMI or WC in Asians.
The current study has several limitations. First, this is a ret- rospective observational study; thus, the subsequent manage- ment of risk factors and disease, such as medications, were not guided or followed by a specific protocol and might have been
influenced by the initial health examination results, including VAT quantification. However, such effects are inevitable in studies observing the diagnostic and therapeutic pathways in clinical practice, and the prognostic value of visceral adiposity on CT remains significance after adjusting for the conventional cardiovascular risk factors. In addition, male subjects were predominant in the study population (80.6%), which was dif- ferent from the general composition of the society. It might re- strict the generalizability of the results. However, since the sex- specific analysis consistently provided a strong association be- tween body fat distribution and CAC progression across sex (Supplementary Table 3), our findings can be applied on both sexes. Second, CAC progression, representing of subclinical CAD, was evaluated by CACS. Because CACS can reflect over- all coronary atherosclerotic plaque burden only, the correlation with the severity of stenosis or the probability of rupture-prone plaque, considered the major cause of cardiovascular adverse events, are unknown [40]. However, many previous studies have proved that CACS can predict clinical events from cardiac death to subclinical CAD in asymptomatic population cohorts, as we described above [3,4]. Moreover, given that our study population is comprised of self-referred subjects with a rela- tively low risk, comprehensive evaluation using coronary CT angiography for primary screening is not recommended.
Third, radiation hazard regarding CT should be considered, even though the study participants agreed to perform non- contrast abdomen CT after being informed. Finally, the specif- ic VAT/SAT ratio is expected to help guide physicians in car- diovascular risk management, but should be interpreted with caution. Further multi-ethnic prospective studies are required to validate our results.
In conclusions, body fat distribution is important in CAC progression. Predominance of VAT over SAT at ≥30% is the strongest predictor of CAC progression, even with normal BMI or WC in apparently healthy Korean population. Assess- ment of body fat distribution may provide further risk stratifi- cation over known clinical risk factors and traditional obesity surrogate markers.
SUPPLEMENTARY MATERIALS
Supplementary materials related to this article can be found online at https://doi.org/10.4093/dmj.2019.0161.
CONFLICTS OF INTEREST
No potential conflict of interest relevant to this article was re- ported.
AUTHOR CONTRIBUTIONS
Conception or design: H.L., H.E.P., S.Y.C.
Acquisition, analysis, or interpretation of data: H.L., H.E.P., J.W.Y., S.Y.C.
Drafting the work or revising: H.L., H.E.P.
Final approval of the manuscript: H.E.P., J.W.Y., S.Y.C.
ORCID
Heesun Lee https://orcid.org/0000-0003-4037-3955 Su-Yeon Choi https://orcid.org/0000-0001-9977-4740
FUNDING
None
ACKNOWLEDGMENTS
None
REFERENCES
1. Jemal A, Ward E, Hao Y, Thun M. Trends in the leading causes of death in the United States, 1970-2002. JAMA 2005;294:
1255-9.
2. Tay SY, Chang PY, Lao WT, Lin YC, Chung YH, Chan WP. The proper use of coronary calcium score and coronary computed tomography angiography for screening asymptomatic patients with cardiovascular risk factors. Sci Rep 2017;7:17653.
3. Budoff MJ, Hokanson JE, Nasir K, Shaw LJ, Kinney GL, Chow D, et al. Progression of coronary artery calcium predicts all- cause mortality. JACC Cardiovasc Imaging 2010;3:1229-36.
4. Lehmann N, Erbel R, Mahabadi AA, Rauwolf M, Mohlen- kamp S, Moebus S, et al. Value of progression of coronary ar- tery calcification for risk prediction of coronary and cardiovas- cular events: result of the HNR study (Heinz Nixdorf Recall).
Circulation 2018;137:665-79.
5. Poirier P, Giles TD, Bray GA, Hong Y, Stern JS, Pi-Sunyer FX, et al. Obesity and cardiovascular disease: pathophysiology,
evaluation, and effect of weight loss: an update of the 1997 American Heart Association Scientific Statement on Obesity and Heart Disease from the Obesity Committee of the Council on Nutrition, Physical Activity, and Metabolism. Circulation 2006;113: 898-918.
6. Van Gaal LF, Mertens IL, De Block CE. Mechanisms linking obesity with cardiovascular disease. Nature 2006;444:875-80.
7. Hansson GK. Inflammation, atherosclerosis, and coronary ar- tery disease. N Engl J Med 2005;352:1685-95.
8. Britton KA, Massaro JM, Murabito JM, Kreger BE, Hoffmann U, Fox CS. Body fat distribution, incident cardiovascular dis- ease, cancer, and all-cause mortality. J Am Coll Cardiol 2013;
62:921-5.
9. Mahabadi AA, Massaro JM, Rosito GA, Levy D, Murabito JM, Wolf PA, et al. Association of pericardial fat, intrathoracic fat, and visceral abdominal fat with cardiovascular disease burden:
the Framingham Heart Study. Eur Heart J 2009;30:850-6.
10. Lewis CE, McTigue KM, Burke LE, Poirier P, Eckel RH, How- ard BV, et al. Mortality, health outcomes, and body mass index in the overweight range: a science advisory from the American Heart Association. Circulation 2009;119:3263-71.
11. Despres JP. Body fat distribution and risk of cardiovascular dis- ease: an update. Circulation 2012;126:1301-13.
12. Hill JO, Sidney S, Lewis CE, Tolan K, Scherzinger AL, Stamm ER. Racial differences in amounts of visceral adipose tissue in young adults: the CARDIA (Coronary Artery Risk Develop- ment in Young Adults) study. Am J Clin Nutr 1999;69:381-7.
13. Burke GL, Bertoni AG, Shea S, Tracy R, Watson KE, Blumen- thal RS, et al. The impact of obesity on cardiovascular disease risk factors and subclinical vascular disease: the Multi-Ethnic Study of Atherosclerosis. Arch Intern Med 2008;168:928-35.
14. Kim LK, Yoon JW, Lee DH, Kim KM, Choi SH, Park KS, et al.
Impact of metabolic syndrome on the progression of coronary calcium and of coronary artery disease assessed by repeated cardiac computed tomography scans. Cardiovasc Diabetol 2016;15:92.
15. Agatston AS, Janowitz WR, Hildner FJ, Zusmer NR, Viamonte M Jr, Detrano R. Quantification of coronary artery calcium us- ing ultrafast computed tomography. J Am Coll Cardiol 1990;
15:827-32.
16. Hokanson JE, MacKenzie T, Kinney G, Snell-Bergeon JK, Da- belea D, Ehrlich J, et al. Evaluating changes in coronary artery calcium: an analytic method that accounts for interscan vari- ability. AJR Am J Roentgenol 2004;182:1327-32.
17. Kim D, Choi SY, Park EH, Lee W, Kang JH, Kim W, et al. Non-
alcoholic fatty liver disease is associated with coronary artery calcification. Hepatology 2012;56:605-13.
18. Choi SY, Kim D, Oh BH, Kim M, Park HE, Lee CH, et al. Gen- eral and abdominal obesity and abdominal visceral fat accu- mulation associated with coronary artery calcification in Kore- an men. Atherosclerosis 2010;213:273-8.
19. Schwartz RS, Shuman WP, Larson V, Cain KC, Fellingham GW, Beard JC, et al. The effect of intensive endurance exercise training on body fat distribution in young and older men. Me- tabolism 1991;40:545-51.
20. World Health Organization. The Asia-Pacific perspective: re- defining obesity and its treatment. Sydney: Health Communi- cations Australia; 2000 [cited 2020 Jul 14]. Available from:
https://apps.who.int/iris/handle/10665/206936.
21. McGill HC Jr, McMahan CA, Herderick EE, Zieske AW, Mal- com GT, Tracy RE, et al. Obesity accelerates the progression of coronary atherosclerosis in young men. Circulation 2002;105:
2712-8.
22. Lee CD, Jacobs DR Jr, Schreiner PJ, Iribarren C, Hankinson A.
Abdominal obesity and coronary artery calcification in young adults: the Coronary Artery Risk Development in Young Adults (CARDIA) Study. Am J Clin Nutr 2007;86:48-54.
23. Reis JP, Loria CM, Lewis CE, Powell-Wiley TM, Wei GS, Carr JJ, et al. Association between duration of overall and abdomi- nal obesity beginning in young adulthood and coronary artery calcification in middle age. JAMA 2013;310:280-8.
24. Kang HT, Shim JY, Lee HR, Park BJ, Linton JA, Lee YJ. Trends in prevalence of overweight and obesity in Korean adults, 1998-2009: the Korean National Health and Nutrition Exami- nation Survey. J Epidemiol 2014;24:109-16.
25. Phillips CM. Metabolically healthy obesity: definitions, deter- minants and clinical implications. Rev Endocr Metab Disord 2013;14:219-27.
26. Ohashi N, Yamamoto H, Horiguchi J, Kitagawa T, Hirai N, Ito K, et al. Visceral fat accumulation as a predictor of coronary ar- tery calcium as assessed by multislice computed tomography in Japanese patients. Atherosclerosis 2009;202:192-9.
27. Rosito GA, Massaro JM, Hoffmann U, Ruberg FL, Mahabadi AA, Vasan RS, et al. Pericardial fat, visceral abdominal fat, car- diovascular disease risk factors, and vascular calcification in a community-based sample: the Framingham Heart Study. Cir- culation 2008;117:605-13.
28. Ding J, Kritchevsky SB, Hsu FC, Harris TB, Burke GL, Detrano RC, et al. Association between non-subcutaneous adiposity and calcified coronary plaque: a substudy of the Multi-Ethnic
Study of Atherosclerosis. Am J Clin Nutr 2008;88:645-50.
29. Rahman M, Temple JR, Breitkopf CR, Berenson AB. Racial dif- ferences in body fat distribution among reproductive-aged women. Metabolism 2009;58:1329-37.
30. Carroll JF, Chiapa AL, Rodriquez M, Phelps DR, Cardarelli KM, Vishwanatha JK, et al. Visceral fat, waist circumference, and BMI: impact of race/ethnicity. Obesity (Silver Spring) 2008;16:600-7.
31. Marques MD, Santos RD, Parga JR, Rocha-Filho JA, Quaglia LA, Miname MH, et al. Relation between visceral fat and coro- nary artery disease evaluated by multidetector computed to- mography. Atherosclerosis 2010;209:481-6.
32. Fox CS, Massaro JM, Hoffmann U, Pou KM, Maurovich-Hor- vat P, Liu CY, et al. Abdominal visceral and subcutaneous adi- pose tissue compartments: association with metabolic risk fac- tors in the Framingham Heart Study. Circulation 2007;116:39- 48.
33. Lemieux I, Pascot A, Couillard C, Lamarche B, Tchernof A, Almeras N, et al. Hypertriglyceridemic waist: a marker of the atherogenic metabolic triad (hyperinsulinemia; hyperapolipo- protein B; small, dense LDL) in men? Circulation 2000;102:
179-84.
34. Qasim A, Mehta NN, Tadesse MG, Wolfe ML, Rhodes T, Gir- man C, et al. Adipokines, insulin resistance, and coronary ar- tery calcification. J Am Coll Cardiol 2008;52:231-6.
35. Wang J, Thornton JC, Russell M, Burastero S, Heymsfield S, Pierson RN Jr. Asians have lower body mass index (BMI) but higher percent body fat than do Whites: comparisons of an- thropometric measurements. Am J Clin Nutr 1994;60:23-8.
36. Deurenberg P, Deurenberg-Yap M, Guricci S. Asians are differ- ent from Caucasians and from each other in their body mass index/body fat percent relationship. Obes Rev 2002;3:141-6.
37. Balkau B, Deanfield JE, Despres JP, Bassand JP, Fox KA, Smith SC Jr, et al. International Day for the Evaluation of Abdominal Obesity (IDEA): a study of waist circumference, cardiovascular disease, and diabetes mellitus in 168,000 primary care patients in 63 countries. Circulation 2007;116:1942-51.
38. Despres JP. Excess visceral adipose tissue/ectopic fat the miss- ing link in the obesity paradox? J Am Coll Cardiol 2011;57:
1887-9.
39. Shah RV, Murthy VL, Abbasi SA, Blankstein R, Kwong RY, Goldfine AB, et al. Visceral adiposity and the risk of metabolic syndrome across body mass index: the MESA Study. JACC Cardiovasc Imaging 2014;7:1221-35.
40. Budoff MJ, Achenbach S, Blumenthal RS, Carr JJ, Goldin JG,
Greenland P, et al. Association Committee on Cardiovascular Imaging and Intervention; American Heart Assessment of cor- onary artery disease by cardiac computed tomography: a sci- entific statement from the American Heart Association Com-
mittee on Cardiovascular Imaging and Intervention, Council on Cardiovascular Radiology and Intervention, and Commit- tee on Cardiac Imaging, Council on Clinical Cardiology. Cir- culation 2006;114:1761-91.
Supplementary Table 1. Baseline characteristics according to body fat distribution
Variable Total (n=1,015) VAT/SAT ≥1.30 (n=588) VAT/SAT <1.30 (n=427) P value
Clinical parameters
Age, yr 56.4±7.2 57.1±7.6 56.2±7.3 0.734
Male sex 817 (80.6) 562 (95.7) 255 (59.7) <0.001
Current smoking 205 (20.2) 155 (26.4) 50 (11.7) <0.001
BMI, kg/m2 24.6±2.6 24.8±2.3 24.3±3.0 <0.001
BMI ≥25 kg/m2 432 (42.6) 265 (45.1) 167 (39.1) 0.062
WC, cm 88.1±7.1 88.9±6.3 87.1±8.0 <0.001
WC ≥90 cm (male) or 85 cm (female) 448 (44.1) 270 (45.9) 178 (41.7) 0.180
Hypertension 293 (28.9) 198 (33.7) 95 (22.2) <0.001
Diabetes mellitus 196 (19.3) 135 (23.0) 61 (14.3) 0.001
Dyslipidemia 358 (35.3) 242 (41.2) 116 (27.2) <0.001
Chronic kidney disease 85 (8.4) 49 (8.3) 36 (8.4) 0.956
Framingham risk score 7.6±5.7 8.2±5.8 7.0±3.2 <0.001
Low 656 (64.6) 362 (61.6) 294 (68.9) <0.001
Intermediate 289 (28.5) 180 (30.6) 109 (25.5)
High 70 (6.9) 46 (7.8) 24 (5.6)
Medications
Prior use of antiplatelet agent 313 (30.8) 187 (31.8) 126 (29.5) 0.435
Prior use of statin 293 (28.9) 172 (29.3) 121 (28.3) 0.751
Laboratory parameters
Systolic blood pressure, mmHg 120.2±14.6 121.8±14.3 118.1±14.7 0.542
Total cholesterol, mg/dL 199.1±34.1 199.3±34.3 198.9±33.9 0.611
HDL-C, mg/dL 51.8±12.4 50.4±11.5 53.8±13.3 0.003
Triglyceride, mg/dL 107.0 (76.0–152.0) 119.0 (87.0–165.0) 94.0 (66.0–133.0) 0.001
LDL-C, mg/dL 124.8±32.6 125.1±33.8 124.5±30.8 0.073
Fasting glucose, mg/dL 104.5±22.2 107.5±23.8 100.3±19.1 <0.001
HbA1c, % 5.9±0.7 6.1±0.8 5.9±0.6 <0.001
hs-CRP, mg/L 0.5 (0.1–1.6) 0.6 (0.1–1.6) 0.4 (0.1–1.4) 0.019
Homocysteine, umol/L 8.7±2.6 9.0±2.9 8.1±1.6 0.205
HOMA-IR 2.5±1.4 2.6±1.5 2.2±1.2 0.002
CACS at baseline 81.0±233.9 96.5±226.7 59.6±242.1 0.003
Values are presented as mean±standard deviation, number (%), or median (interquartile range).
VAT, visceral adipose tissue; SAT, subcutaneous adipose tissue; BMI, body mass index; WC, waist circumference; SBP, systolic blood pressure;
HDL-C, high-density lipoprotein cholesterol; LDL-C, low-density lipoprotein cholesterol; HbA1c, glycosylated hemoglobin; hs-CRP, high-sen- sitivity C-reactive protein; HOMA-IR, homeostatic model assessment for insulin resistance; CACS, coronary artery calcium scores.
Supplementary Table 2. Univariable and multivariable analysis of factors associated with CAC progression
Variable Univariable analysis Multivariable analysisa
Unadjusted HR (95% CI) P value Adjusted HR (95% CI) P value Clinical and laboratory parameters
Age (per 10 years increment) 1.54 (1.31–1.81) <0.001
Male sex 2.35 (1.64–3.37) <0.001
Current smoking 1.79 (1.32–2.44) <0.001
Hypertension 1.59 (1.15–2.79) <0.001
Diabetes mellitus 2.64 (1.23–4.23) <0.001
Dyslipidemia 1.64 (1.09–3.52) <0.001
Chronic kidney disease 1.31 (0.94–2.06) 0.234
High FRS 1.77 (1.44–2.18) <0.001
Prior use of antiplatelet agent 0.91 (0.67–1.01) 0.069
Prior use of statin 0.88 (0.55–1.25) 0.102
SBP ≥140 mm Hg 1.72 (1.12–2.63) 0.012
Triglyceride ≥200 mg/dL 1.17 (0.79–1.74) 0.433
HDL-C <40 mg/dL 1.00 (0.69–1.45) 0.989
LDL-C ≥160 mg/dL 0.92 (0.55–1.55) 0.764
Fasting glucose ≥100 mg/dL 1.45 (1.12–1.87) 0.004
hs-CRP ≥2.0 mg/L 1.28 (1.04–1.67) 0.034
HOMA-IR ≥3.0 0.92 (0.69–1.24) 0.598
Obesity-related parameters
BMI ≥25 kg/m2 1.56 (1.21–2.02) 0.001 1.14 (0.90–1.44) 0.293
WC ≥90 cm (male) or 85 cm (female) 1.18 (1.02–1.53) 0.029 1.03 (0.85–1.31) 0.429
TATb 1.00 (0.99–1.01) 0.869 - -
VATb 1.03 (1.01–1.06) 0.007 1.02 (1.00–1.05) 0.061
Highest quartile of VAT (Q4) 1.78 (1.34–2.36) <0.001 1.21 (0.99–1.62) 0.064
Height-indexed VATc 1.05 (1.02–1.09) 0.007 1.00 (1.00–1.00) 0.496
SATb 0.99 (0.99 –1.00) 0.079 - -
VAT/SAT ratio 2.87 (1.79–4.38) <0.001 1.57 (1.28–1.95) 0.009
VAT/SAT ratio ≥1.30 3.01 (2.25–4.03) <0.001 1.95 (1.39–2.83) 0.021
CAC, coronary artery calcification; HR, hazard ratio; CI, confidence interval; FRS, Framingham risk score; SBP, systolic blood pressure; HDL-C, high-density lipoprotein cholesterol; LDL-C, low-density lipoprotein cholesterol; hs-CRP, high-sensitivity C-reactive protein; HOMA-IR, ho- meostatic model assessment for insulin resistance; BMI, body mass index; WC, waist circumference; TAT, total adipose tissue; VAT, visceral adi- pose tissue; SAT, subcutaneous adipose tissue.
aMultivariable analysis was performed by adjusting for age, male sex, current smoking, a history of hypertension, diabetes mellitus, and dyslip- idemia, SBP ≥140 mm Hg, glucose ≥100 mg/dL, and hs-CRP >2.0 mg/L, bTotal, visceral, and subcutaneous fat area were assessed per 1 cm2 in- crement, cHeight-indexed visceral fat area was assessed per 1 cm2/m increment.
Supplementary Table 3. Risk of CAC progression according to sex (817 male and 198 female)
Variable Unadjusted HR
(95% CI) P value Male
Clinical and laboratory parameters
Age (per 10 years increment) 1.22 (1.07–1.42) 0.004 Current smoking 1.57 (1.47–1.73) <0.001
Hypertension 1.56 (1.08–2.77) 0.004
Diabetes mellitus 2.50 (2.18–2.91) 0.001
Dyslipidemia 1.38 (1.10–1.73) 0.005
Chronic kidney disease 1.10 (0.85–1.61) 0.622
High FRS 1.75 (1.40–2.23) 0.007
Prior use of antiplatelet agent 0.92 (0.68–1.05) 0.073 Prior use of statin 0.87 (0.56–1.35) 0.537 SBP ≥140 mm Hg 1.71 (1.04 –2.27) 0.016 Triglyceride ≥200 mg/dL 1.35 (0.83–2.33) 0.683 HDL-C <40 mg/dL 0.87 (0.65–1.17) 0.350 LDL-C ≥160 mg/dL 0.85 (0.40–2.45) 0.859 Fasting glucose ≥100 mg/dL 1.23 (1.04–1.50) 0.006 hs-CRP ≥2.0 mg/L 1.18 (1.01–1.63) 0.039
HOMA-IR ≥3.0 0.92 (0.67–1.25) 0.584
Obesity-related parameters
BMI ≥25 kg/m2 1.41 (1.14–1.75) 0.002 WC ≥90 cm (male) or 85 cm (female) 1.17 (1.05–1.54) 0.008
TATa 1.00 (1.00–1.01) 0.309
VATa 1.02 (1.01–1.05) 0.028
Highest quartile of VAT (Q4) 1.80 (1.33–2.04) <0.001 Height-indexed VATb 1.02 (1.00–1.09) 0.064
SATa 0.99 (0.99 –1.00) 0.202
VAT/SAT ratio 2.63 (2.24–3.28) <0.001 VAT/SAT ratio ≥1.30 2.81 (2.38–3.39) <0.001
Variable Unadjusted HR
(95% CI) P value Female
Clinical and laboratory parameters
Age (per 10 years increment) 1.99 (1.31–3.04) 0.001 Current smoking 2.14 (0.29–15.72) 0.454
Hypertension 1.17 (0.62–1.63) 0.591
Diabetes mellitus 2.17 (1.14–4.11) 0.018
Dyslipidemia 1.65 (0.84–3.22) 0.143
Chronic kidney disease 1.48 (0.70–3.63) 0.392
High FRS 1.05 (0.95–1.16) 0.376
Prior use of antiplatelet agent 0.95 (0.91–1.37) 0.091 Prior use of statin 2.10 (1.15–3.83) 0.016 SBP ≥140 mm Hg 1.42 (0.97–1.78) 0.237 Triglyceride ≥200 mg/dL 0.68 (0.18–1.22) 0.119 HDL-C <40 mg/dL 0.98 (0.50–1.92) 0.941 LDL-C ≥160 mg/dL 1.56 (1.05–8.16) 0.003 Fasting glucose ≥100 mg/dL 1.59 (0.87–2.91) 0.133 hs-CRP ≥2.0 mg/L 0.73 (0.28–1.90) 0.524
HOMA-IR ≥3.0 0.76 (0.14–1.62) 0.234
Obesity-related parameters
BMI ≥25 kg/m2 1.13 (0.61–1.82) 0.708 WC ≥90 cm (male) or 85 cm (female) 0.86 (0.53–1.70) 0.658
TATa 1.00 (0.99–1.00) 0.997
VATa 1.01 (0.94–1.08) 0.789
Highest quartile of VAT (Q4) 1.44 (1.13–2.32) 0.022 Height-indexed VATb 1.00 (0.99–1.01) 0.715
SATa 0.99 (0.99 –1.00) 0.022
VAT/SAT ratio 3.22 (2.48–6.42) <0.001 VAT/SAT ratio ≥1.30 3.52 (1.86–6.67) <0.001 CAC, coronary artery calcification; HR, hazard ratio; CI, confidence interval; FRS, Framingham risk score; SBP, systolic blood pressure; HDL-C, high-density lipoprotein cholesterol; LDL-C, low-density lipoprotein cholesterol; hs-CRP, high-sensitivity C-reactive protein; HOMA-IR, ho- meostatic model assessment for insulin resistance; BMI, body mass index; WC, waist circumference; TAT, total adipose tissue; VAT, visceral adi- pose tissue; SAT, subcutaneous adipose tissue.
aTotal, visceral, and subcutaneous fat area were assessed per 1 cm2 increment, bHeight-indexed visceral fat area was assessed per 1 cm2/m incre- ment.
Supplementary Table 4. The multivariable Cox models for CAC progression
Variable Adjusted HR (95% CI)a P value
Model 1
FRS 1.13 (1.08–1.17) <0.001
BMI ≥25 kg/m2 1.42 (1.08–1.85) 0.011
Model 2
FRS 1.13 (1.08–1.18) <0.001
BMI ≥25 kg/m2 1.49 (1.08–2.04) 0.015
WC ≥90 cm (male) or 85 cm (female) 1.02 (0.97–1.26) 0.062 Model 3
FRS 1.11 (1.06–1.16) <0.001
BMI ≥25 kg/m2 1.49 (1.09–2.06) 0.013
WC ≥90 cm (male) or 85 cm (female) 1.01 (0.96–1.25) 0.055
VAT/SAT ratio ≥1.30 3.25 (2.20–4.81) <0.001
CAC, coronary artery calcification; HR, hazard ratio; CI, confidence interval; FRS, Framingham risk score; BMI, body mass index; WC, waist circumference; VAT, vis- ceral adipose tissue; SAT, subcutaneous adipose tissue.
aMultivariable analysis was performed by adjusting for FRS, a history of diabetes mel- litus, and high-sensitivity C-reactive protein >2.0 mg/L.
Supplementary Fig. 1. Receiver-operating characteristic analysis with 3 sequen- tial Cox models including Framingham risk score (FRS), body mass index (BMI), waist circumference (WC), and visceral adipose tissue (VAT)/subcutaneous adi- pose tissue (SAT) ratio ≥1.30. VAT/SAT ratio ≥1.30 showed incremental prog- nostic value over known prognosticators of CAC progression including higher FRS, BMI ≥25 kg/m2, and increased WC.
Model c-index P for
comparison
1: FRS+BMI ≥25 kg/m2 0.605 (0.574−0.635) -
2: FRS+BMI ≥25 kg/m2+WC ≥90 cm (M) or 85 cm (F) 0.614 (0.583−0.644) 0.019 3: FRS+BMI ≥25 kg/m2+WC ≥90 cm (M) or 85 cm (F)
+VAT/SAT ratio ≥1.30 0.692 (0.662−0.720) <0.001
100 80 60 40 20 0
Sensitivity (%)
20 40 60 80 100 100-Specificity (%)
Model 1 Model 2 Model 3