a These authors contributed equally to this work.
This study was supported by National Natural Science Foundation of China (81970927), by the National Science Foundation of Jiangsu Province of China (BK20191348), and the Priority Academic Program Development of Jiangsu Higher Education Institutions (PAPD, 2018-87).
Shear bond strength of zirconia to resin:
The effects of specimen preparation and loading procedure
Bingzhuo Chen1a, Lu Yang1a, Zhicen Lu1, Hongliang Meng1, Xinyi Wu2, Chen Chen2, Haifeng Xie1*
1Jiangsu Key Laboratory of Oral Diseases, Nanjing Medical University; Department of Prosthodontics, Affiliated Hospital of Stomatology, Nanjing Medical University, Nanjing, China
2Jiangsu Key Laboratory of Oral Diseases, Nanjing Medical University; Department of Endodontics, Affiliated Hospital of Stomatology, Nanjing Medical University, Nanjing, China
PURPOSE. Shear bond strength (SBS) test is the most commonly used method for evaluating resin bond strength of zirconia, but SBS results vary among different studies even when evaluating the same bonding strategy. The purpose of this study was to promote standardization of the SBS test in evaluating zirconia ceramic bonding and to investigate factors that may affect the SBS value of a zirconia/resin cement/composite resin bonding specimen.
MATERIALS AND METHODS. The zirconia/resin cement/composite resin bonding specimens were used to simulate loading with a shear force by the three-dimensional finite element (3D FE) modeling, in which stress distribution under uniform/non-uniform load, and different resin cement thickness and different elastic modulus of resin composite were analyzed. In vitro SBS test was also performed to validate the results of 3D FE analysis.
RESULTS. The loading flat width was an important affecting factor. 3D FE analysis also showed that differences in resin cement layer thickness and resin composite would lead to the variations of stress accumulation area. The SBS test result showed that the load for preparing a SBS specimen is negatively correlated with the resin cement thickness and positively correlated with SBS values. CONCLUSION. When preparing a SBS specimen for evaluating bond performance, the load flat width, the load applied during cementation, and the different composite resins used affect the SBS results and therefore should be standardized. [J Adv Prosthodont 2019;11:
313-23]
KEYWORDS: Three-dimensional finite element; Shear bond strength; Stress; Elastic modulus; Thickness
Corresponding author:
Haifeng Xie
Department of Prosthodontics, Affiliated Hospital of Stomatology, Nanjing Medical University, Han Zhong Road 136th, Stomatological Hospital of Jiangsu Province, Nanjing 210029, China
Tel. +862585031831: e-mail, [email protected]
Received March 2, 2019 / Last Revision June 16, 2019 / Accepted December 11, 2019
© 2019 The Korean Academy of Prosthodontics
This is an Open Access article distributed under the terms of the Creative Commons Attribution Non-Commercial License (http://creativecommons.
org/licenses/by-nc/4.0) which permits unrestricted non-commercial use, distribution, and reproduction in any medium, provided the original work is properly cited.
INTRODUCTION
The bonding of zirconia has been the subject of increasing attention over the last decade for the definitive approach, but optimal resin bonding to zirconia has yet to be realized. In order to evaluate new bonding strategy developments, bond strength tests are needed.1 Available bond strength tests include the macro/micro tensile bond strength test, macro/
micro shear bond strength (SBS) test, push-out test, and four point bending test,2-4 of which SBS test is the most common- ly used one for the evaluation of resin bond strength of zir- conia. However, SBS results vary among many studies even when evaluating the same bonding strategy. Shortcomings of the SBS test have been recognized, and it is difficult to draw reliable conclusions from comparing the results of different SBS experiments. A large number of the same or similar experiments have to be performed in order to accurately evaluate newly developed bonding strategy, which leads to
wasteful repetition.
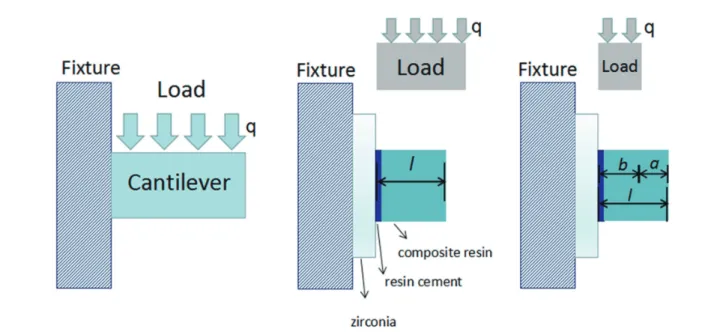
To clarify the key factors that affect the SBS results, the structure of the bonding specimens used for SBS test should be known first. The most commonly used SBS test speci- mens for the evaluation of bonding between zirconia and composite resin exhibit a sandwich-type structure, with a pretreated zirconia end that is cemented under constant load on the other end (usually be composite resin, or ceramic glass, or the same pretreated zirconia) by a layer of resin cement.5 This kind of structure resembles the cantilever beam when an end of the bonding specimen is loaded with a shear force during the SBS test process. Based on the theory of cantilever beam bending moment,6 the bending moment of the cantilever beam is positively correlated with the load and the length of the cantilever beam, when it is under a ver- tical uniform load. If the load distribution is not uniform, the bending moment of unloaded unit is 0. During the load- ing process, with the increase of internal bending moment of the cantilever beam, the structure will fracture when its mechanical strength is not strong enough to resist the bend- ing moment.7 This principle is expected to be helpful for explaining the main reason for the variation of shear bond test results.
In the structure of SBS bonding specimen, the thickness of the resin cement layer and the load bearing end can be considered as the length of the cantilever beam. It has been reported previously that an increase in resin cement thick- ness led to decreased flexural strength between the glass- based ceramics and resin.8 Another study found that a resin cement layer thickness of 50 - 150 μm did not affect the SBS of dentine, while 200 μm cement layer thickness led to decreased SBS.9 Therefore, the resin cement layer thickness would affect SBS values. In addition, a previous study adopt- ed three stress models to evaluate failure behavior of shear bond strength specimens when bonded to dentin, and found that failures of specimens originated from loaded cylinder surface and were unrelated to the bonded surface area.6 Both the conclusions of these in vitro studies matched the cantile- ver theory.
As the most commonly used material to build the load bearing end of a SBS bonding specimen,7,10 the composite resin has been recommend by ISO that should have a flexur- al modulus greater than 9 GPa to reduce its deformation during the SBS test.11-13 However, unfortunately, there is not much detail. According to Hooke’s law, stress is equal to the product of elastic modulus and shape variable; therefore, for same deformation, the higher the elastic modulus, the great- er the stress is.14 Chiba et al.15 demonstrated through 3D FE analysis that the shear stress on the cervical surface of resin core decreased as the elastic modulus of resin composites increased.
The resin core materials with higher elastic moduli could restrain the elastic deformation and hold larger stress inter- nally. Another study found that von Mises stresses for com- posites with lower elastic moduli spread over a large area, and high elastic modulus composite material accumulated stresses at the bonded interface.16 These above studies sug-
gested that composite resin of different elastic moduli may be another key factor that affects the SBS values.
In this study, zirconia/resin cement/composite resin structure bonding specimens were built with three-dimen- sional finite element (3D FE) molds, and SBS test simulation was performed for stress distribution analysis. In vitro SBS test was also performed to validate the results of 3D FE analysis. We inferred based on cantilevered beam theory that the load flat width, the resin cement thickness, and different composite resins mechanical properties would affect the SBS results.
MATERIALS AND METHODS
Finite element modeling was carried out and analyzed using Abaqus software (Dassault Systemes S.A, boulevard de Verdun, Courbevoie, France). The mechanical parameters used in the bond strength test models followed the manufac- turers’ recommendation (Table 1). The model was composed of 22857-33477 hexahedral elements that represented the isotropic materials for the model. All the materials were assumed to be homogeneous and isotropic. In order to sim- ulate the SBS test, the boundary nodes of the zirconia cuboid were fixed with no movement in any direction.
Forces were loaded at the top of the cylinder using a rectan- gular rigid rod of 2 mm × 3 mm to mimic the practical situa- tions. The von Mises stress (VMS) distribution was analyzed in each specimen and the von Mises strain distribution of the cement layer, and calculated the peak values of the princi- pal shear stress in the different portions of the cement layer.
To evaluate the different stress distribution under uni- form and non-uniform load, the resin-composite Filtek Z250 was chosen as the resin-composite cylinder and its thick- ness was set to typical 1 mm,15 2 mm,17 3 mm,18 and 4 mm19 according to the previous literature. The load flat width was set to 1 mm, 2 mm, 3 mm, 4 mm and 5 mm in order to sim- ulate the SBS test under uniform or non-uniform load. The thickness of the cement layer was set to typical 50 μm.20 Stress forced was 50 N.21
To evaluate the different stress distribution with different resin cement thickness, the models were designed as 3 mm width of load flat and 3 mm thickness of Filtek Z250 resin- composite cylinder according to the dimensions of the spec- imens used in the SBS tests. The thickness of the cement layer were set to typical 50 μm,20 80 μm,22 100 μm23,24 and 180 μm24 reported in the previous literatures. Stresses forced were 50 N and 300 N.21
To evaluate the different stress distribution with different elastic modulus of resin composite, the models were designed as 3 mm width of load flat and 3 mm thickness of three kinds of resin-composite cylinder, including Filtek Z100, Filtek Z250, and Filtek Z350, according to the dimen- sions of the specimens used in the SBS tests. The thickness of the cement layer was set to 50 μm.20 Stresses forced were 50 N and 300 N.21
Shear bond strength (SBS) test was then performed to verify the results of 3D FE simulation. Industrially manufac-
tured Y-TZP (yttrium-stabilized tetragonal zirconia) plates (94% ZrO2, 6% Y2O3, Shenzhen Santo Industry Technology Development Company Limited, ShenZhen, China), with dimensions of 10 × 10 × 0.9 mm3, were subjected to air par- ticle abrasion with 50 μm alumina particles from a distance of 10 mm for 20 s at 0.25 MPa. The 375 Y-TZP plates were randomly assigned to five groups (n = 75 per group) accord- ing to the conditioning methods applied (Table 2). A total of 375 prepolymerized resin composite cylinders (6 mm inner diameter; 3 mm height) were made from a light-cured com- posite resin (Filtek Z250, 3M ESPE, St. Paul, MN, USA).
The above 375 pretreated Y-TZP plates was then further divided into five subgroups (n = 15) according to the load applied (0.49, 1.96, 4.90, 9.80, or 19.60 N) during cementa- tion of zirconia to the resin cement. Prepolymerized resin composite cylinders were cemented on pretreated Y-TZP plates by a layer of conventional MDP-free resin cement (RelyX Veneer, 3M ESPE, St. Paul, MN, USA) or MDP- containing resin cement (Clearfil SA Luting, Panavia SA Luting Plus) under a corresponding constant load for 5 minutes.
Another 180 air-abraded Y-TZP plates were prepared and assigned to three groups (n = 60 per group) according to three kinds of resin composites used. The resin compos- ites chosen were Filtek Z100, Filtek Z250 and Filtek Z350, produced by the same manufacturer, to avoid the interfer-
ence of mechanical properties except Young’s modulus. The 180 pretreated Y-TZP plates were then further divided into three subgroups (n = 20) according to the primers applied, Z-Prime Plus and Clearfil Ceramic Primer, and group with- out any further treatment (Ctr) as control. The conditioning methods applied were same as described in Table 2. The load applied was 9.80 N when preparing SBS specimens.
After removal of excess resin cement with a probe, the resin composite cylinders were light-cured at 6 different loca- tions for 40 s each using a LED lamp (1000 mW/cm2, Elipar FreeLight 2, 3M ESPE, St. Paul, MN, USA). All the speci- mens were submitted to SBS test after 24 h water storage at 37°C by a universal testing machine (Instron Model 3365, Electropuls, Norwood, MA, USA). During the SBS test, a load was applied with a crosshead speed of 1 mm/min per- pendicularly to the adhesive interface using a metal flat rod until failure. The maximum load was recorded and the SBS values were calculated according to the following formula:
SBS (MPa) = the maximum load (N) / area (mm2).
After testing, all debonded specimens were examined under a stereomicroscope (C-DSS230, Nikon, Tokyo, Japan).
Fracture modes were classified as: adhesive failures, fracture sites entirely located between the resin/cement and zirconia surface; cohesive failures, fractures occurring exclusively within the resin/cement; or mixed failures, partial resin/resin
Table 1. Mechanical properties and dimensions of the components of SBS specimens models
Material Young’s modulus (GPa) Poisson’s ratio Thickness (mm)
Zirconia 210 0.3 1
Resin cement Relyx Veneer 7.2 0.27 0.05/ 0.08/ 0.10/ 0.18
Resin-composite Filtek Z100 14.5 0.3 3
Resin-composite Filtek Z250 11 0.3 1/ 2/ 3/ 4
Resin-composite Filtek Z350 11.3 0.45 3
*The data were from manufactures and Refs.15,17-24
Table 2. Conditioning methods for groups under five different cementation loads in shear bond strength test
Groups Primers Resin cements
Ctr / RelyX Veneer (3M ESPE, USA) was applied to the ceramic surface to cement
the pre-polymerized resin cylinders.
ZP
A coat of Z-Prime Plus (Bisco, USA) was applied to the ceramic surface according to the manufacturer’s instructions.
RelyX Veneer (3M ESPE, USA) was used as mentioned earlier.
CCP
A coat of Clearfil Ceramic Primer (Kuraray Noritake Medical Inc., Japan) was applied according to the manufacturer’s instructions.
RelyX Veneer (3M ESPE, USA) was used as mentioned earlier.
CSL / A coat of Clearfil SA Luting (Kuraray Noritake Medical Inc., Japan) was applied
to the ceramic surface to cement the pre-polymerized resin cylinders.
PSLP / A coat of Panavia SA Luting Plus (Kuraray Noritake Medical Inc., Japan) was
applied to the ceramic surface to cement the pre-polymerized resin cylinders.
cement fractures and partial Y-TZP surface exposure.
Another batch of air-abraded Y-TZP plates were pre- pared (size error less than 0.02 mm) and assigned to three groups (n = 25 per group), similar to SBS test, to receive sur- face treatments. These pretreated Y-TZP plates was then divided into five subgroups (n = 5) to build bi-layered speci- mens according to the load applied during cementation.
Bi-layered specimens in each group were built through bonding two identically pretreated Y-TZP plates to each oth- er with a layer of resin cement (RelyX Veneer, Clearfil SA Luting, Panavia SA Luting Plus) under constant loads of 0.49, 1.96, 4.90, 9.80, or 19.60 N. After light-curing for 80 s from two sides, four lateral sides of the bi-layered specimens were wet-polished with silicon carbide papers of increasing fineness (800, 1000, 1200 grit) using a metallographic polish- er (PG-1, BiaoYu instrument, ShangHai, China). Thickness of the cement layer was then measured at 40× magnification under a stereomicroscope (C-DSS230, Nikon, Tokyo, Japan).
After satisfying the normality and homogeneity of the data sets, two-way ANOVA and post hoc tests (Tukey HSD test) were performed to statistically examine the influences of the bonding strategies and loads on SBS values, and examine the influences of resin cement types and loads on the thickness of resin cement. Statistical significance was set at α = 0.05. The relationships between thickness and differ- ent loading conditions, and between SBS values and different load conditions were assessed by Pearson correlation analysis.
RESULTS
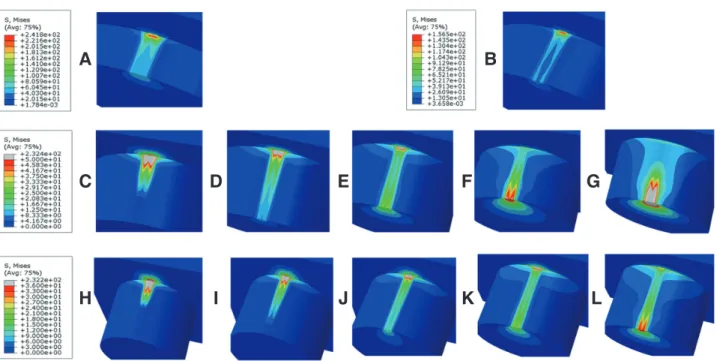
3D FE analysis of ceramic-composite combinations showing stress accumulation areas is presented in Fig. 1. When the thickness of resin-composite cylinder was set to be 1 or 2 mm, the load flat width that range from 1 mm to 5 mm had no effect on the peak value of maximum principal stress and the area of stress distribution. When the composite resin thickness was up to 3 and 4 mm, the area of stress distribu- tion increased along with the increasing of the load flat width. When the load flat width was not beyond the cylinder thickness, the maximum principal stress appeared at the top of the interface between the cylinder and the cement layer, and along with the increase of the load flat width, the peak value of the maximum principal stress and the distribution area decreased. When the load flat width was beyond the cyl- inder thickness, the location of the maximum principal stress changed to the top of the cylinder free-end, and with the increase of the load flat width, the peak value of the maxi- mum principal stress and the distribution area increased.
When the cylinder thickness was 3 mm, the value of the maximum principal stress was the minimum when load flat width was 4 mm; when the cylinder thickness was 4 mm, the value of the maximum principal stress was the minimum when load flat width was 5 mm.
The load flat width and the resin-composite cylinder thickness of 3D FE models were designed to be 3 mm. The
Fig. 1. Sectional views of von Mises stress of the finite element model simulating the shear bond test. Thickness of the resin composite was 1 mm (A), 2 mm (B), 3 mm (C - G) and 4 mm (D - H). The load flat applied on the cylinder was 1 mm (C, H), 2 mm (D, I), 3 mm (E, J), 4 mm (F, K) and 5 mm (G, H). The sectional views were derived from the entire view. When cylinder thickness was 1 mm or 2 mm, different loading area resulted in same maximum principal stress.
A B
C D E F G
H I J K L
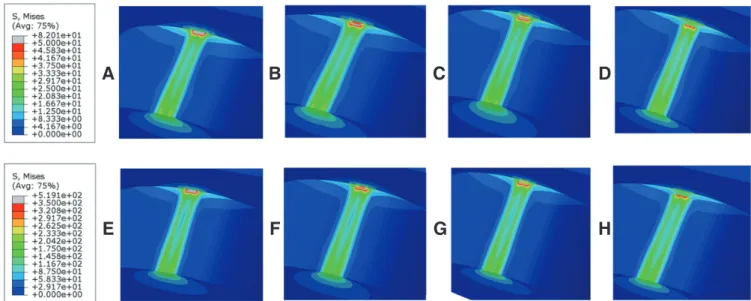
thickness of resin cement, the elastic modulus, and Poisson’s ratio of resin-composite cylinder were changed respectively for simulation and analysis. For these models (Fig. 2 and Fig.
3), the 3D FE simulation indicated that the maximum princi- pal stress was located at the interface between the resin com- posite and the resin cement, which decreased quickly in the
resin cement and slowly in the resin composite. The princi- pal stress was larger and more widely distributed in the resin composite cylinder than in the cement layer and Y-TZP plate. Independent and enlarged sectional views of von Mises stress (VMS) of the finite element model were shown in supplementary information. The distribution areas under
Fig. 3. Sectional views of von Mises stress of the finite element model simulating the shear bond test. The resin compos- ite was Filtek Z100 (A, D), Filtek Z250 (B, E) and Filtek Z350 (C, F). The force applied on the cylinder was 50 N (A, B, C) and 300 N (D, E, F). The sectional views were derived from the entire view. Among the modeled resin composites, the peak value of maximum principal stress was found in the Filtek Z250 simulation, followed by Filtek Z350 and Filtek Z100, which occurred at the top of the resin cement/resin composite interface in all cases. The stress distribution areas for either the 50 or 300 N loads were similar, with the exception of the principal stress values.
A B C
D E F
Fig. 2. Sectional views of von Mises stress of the finite element model simulating the shear bond test. Thickness of the resin cement was 50 μm (A, E), 80 μm (B, F), 100 μm (C, G) and 180 μm (D, H). The force applied on the cylinder was 50 N (A, B, C, D) and 300 N (E, F, G, H). The sectional views were derived from the entire view. Among the modeled thicknesses, the peak value of maximum principal stress was found in the 50 μm thick cement simulation, followed by 80, 100, and 180 μm, which occurred at the top of the resin cement/resin composite interface in all cases. The stress distribution areas for either the 50 or 300 N loads were similar, with the exception of the principal stress values.
A B C D
E F G H
50 N and 300 N load conditions were similar, while the max- imum principal stress values were different.
When the thickness of the cement layer was set to be 50 μm, 80 μm, 100 μm and 180 μm, as shown in Fig. 2, the peak value of the principal stress decreased as the thickness of the cement layer increased, and occurred at the top of the interface between resin cement and resin composite in each thickness. For models consisting of different resin compos- ites, as shown in Fig. 3, the peak value of the principal stress decreased as the elastic modulus of the cylinder increased, and the maximum appears in Filtek Z250, followed by Filtek Z350 and Filtek Z100.
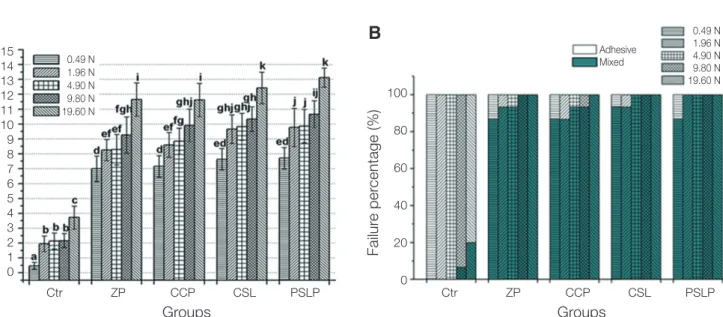
For specimens prepared under five different loads, the SBS values were significantly affected by the bonding strate- gy (F = 21.78, P < .05) and loads (F = 141.78, P < .05) dur- ing preparing the SBS bonding specimens, but there were no significant interactions between these two factors (F = 1.13, P > .05). Means and standard deviations of the SBS values of all the groups were shown in Fig. 4A. Regardless of the bonding strategies used, the SBS values of the 0.49 N groups were the lowest, and those of 19.60 N groups were the highest (P < .05). Moreover, 1.96, 4.90, and 9.80 N groups showed product dependent significance. In the ZP and CCP groups, the differences in the SBS values after preparation in 4.90 N and 9.80 N conditions were insignifi- cant, and were less than those prepared in 9.80 N conditions (P < .05). In the Ctr, CSL, and PSLP groups, no significant differences were found among specimens prepared under 1.96, 4.90, or 9.80 N conditions.
The failure mode results of all the groups were shown in Fig. 4B. For the Ctr group, 0.49, 1.96, and 4.90 N loads all resulted in adhesive failures, and 9.80 and 19.60 N loads mainly resulted in adhesive failures and a small number of mixed failure modes. For the 9.80 N groups, adhesive fail- ures accounted for 94.33% of the total, with only one mixed failure, which accounted for 6.67% of the total failures. In the 19.60 N groups, adhesive failures accounted for 80% and mixed failures accounted for 20% of the total. The other groups except Ctr presented mixed failure modes or mainly mixed failure modes, with small amounts of adhesive dam- age under 0.49, 1.96, 4.90 N load conditions (P > .05).
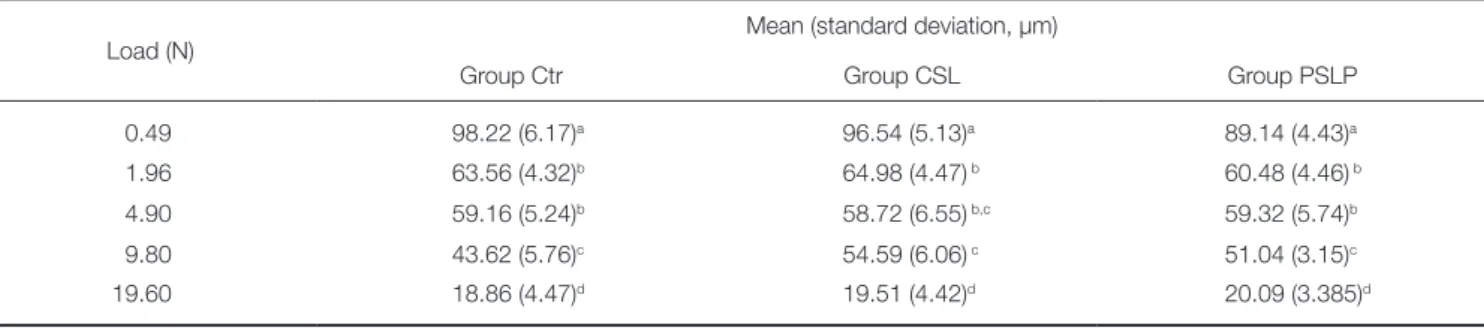
Two-way ANOVA showed that loads applied for cement- ing during preparing the SBS bonding specimens affected the resin cement thickness (F = 106.78, P < .05), while resin cement types did not (F = 2.14, P = .126), and there was interaction between the two factors (F = 2.29, P = .032) (Table 3). Regardless of the type of resin cement used, the thickness of the resin cement layer was maximum under 0.49 N load and minimum under 19.60 N load (P < .05). There was no significant difference in resin cement thickness under 1.96 and 4.90 N loading conditions (P > .05). Under 4.90 and 9.80 N load, a significant difference in thickness between Panavia SA Luting Plus and Relyx Veneer resin cements was observed (P < .05).
Correlation analysis results revealed that there was a strong correlation between load and resin cement layer thick- ness and between load and SBS values (Fig. 5). With increas- es in load, SBS values gradually increased and the resin
Fig. 4. (A) Means and standard deviations of the SBS values of all the groups in result 2.1. Different superscript letters represent group means that were significantly different (P < .05). Regardless of the loads factor, the SBS values of the control group were the lowest. (B) Failure modes observed in groups of SBS test in result 2.1. Adhesive, failure at the ceramic surface; mixed, combination of adhesive failure at ceramic surface and cohesive failure in luting resin or com- posite cylinder.
A B
SBS values (MPa)
15 14 13 12 11 10 9 8 7 6 5 4 3 2 1 0
Ctr ZP CCP CSL PSLP
Groups
0.49 N 1.96 N 4.90 N 9.80 N 19.60 N
Ctr ZP CCP CSL PSLP
Groups
Failure percentage (%)
100
80
60
40
20
0
0.49 N 1.96 N 4.90 N 9.80 N 19.60 N Adhesive
Mixed
Table 3. Mean (standard deviation) of thickness of three kinds of resin cement in bi-layered Y-TZP bonded specimens
Load (N) Mean (standard deviation, μm)
Group Ctr Group CSL Group PSLP
0.49 98.22 (6.17)a 96.54 (5.13)a 89.14 (4.43)a
1.96 63.56 (4.32)b 64.98 (4.47)b 60.48 (4.46)b
4.90 59.16 (5.24)b 58.72 (6.55)b,c 59.32 (5.74)b
9.80 43.62 (5.76)c 54.59 (6.06)c 51.04 (3.15)c
19.60 18.86 (4.47)d 19.51 (4.42)d 20.09 (3.385)d
Different superscript letters mean that there were significantly different in same resin cement group (P < .05).
cement layer thickness decreased.
For specimens made of three different resin composites, two-way ANOVA and Post-Hoc test of the SBS data revealed that SBS values were significantly affected by the bonding strategies and different composite resins used (P <
.01) for preparing SBS bonding specimens, while there were no significant interactions between bonding strategies and different composite resins (P = 0.892). Means and standard deviations of the SBS values were shown in Fig. 6A.
Regardless of the composite resin factor, the SBS values of the control group were lower than that of the primers applied groups. Regardless of the bonding strategies, the SBS values of the Z100 group were the lowest. Z350 group showed slightly higher SBS date than Z250 in group ZP, but
Z350 group showed slightly lower SBS date than Z250 when applied with CCP. No statistical difference in SBS was found between group ZP and CCP (P = .596) nor between group Z250 and Z350 (P = .961).
According to results of failure mode analysis, for the control groups, Z100 and Z350 group presented pure adhe- sive failures, and Z250 group presented mainly adhesive fail- ures and a small number mixed failure modes. For group ZP and CCP, Z100 group presented pure mixed failures. For Z250 group, adhesive failures accounted for 10% in group ZP. 5% adhesive failures were found in group CCP. In group ZP of Z350, adhesive failures also accounted for 5%. No cohesive failure was found in all the groups. The fracture mode details were presented in Fig. 6B.
Fig. 5. (A) Correlation results between thickness and different load conditions, (B) Correlation results between SBS val- ues and different load conditions.
A B
Thickness (µm)
120 100 80 60 40 20
0 0 5 10 15 20
Load (N)
SBS values (MPa)
20
15
10
5
0
0 5 10 15 20
Load (N)
Load-CSL R=-0.905 Load-Ctr R=-0.904 Load-PSLP R=-0.916
Load-CCP R=0.826 Load-CSL R=0.853 Load-Ctr R=0.800 Load-PSLP R=0.711 Load-ZP R=0.813
DISCUSSION
There was no available standard to specify the loading area, shape, and size of the load bearing end for SBS test in evalu- ating bond strength of zirconia. The widely used shape of load bearing end in SBS test is cylinder, and the thickness is usually within 1 - 4 mm.15,17-19 3D FE models were estab- lished of 1 - 4 mm thickness cylinder with 1 mm interval in the present study to analyze the influence of uniform load and non-uniform load on the test results under 1 - 5 mm loading area. According to the 3D FE simulation, for 3 mm and 4 mm thickness cylinders, when the loading area was less than the cylinder thickness, the load applied was non-uni- form, the stress appeared mainly at the loading area, and the maximum principal stress was concentrated at the interface between composite and resin cement, as well as the interface between zirconia and resin cement. The cantilever theory explains it well; when the load is not uniform, the bending moment of the unloaded unit is 0, the bending moment of the segment under load is 1/2qb2. During the loading pro- cess, the cylinder will fracture when its mechanical strength cannot resist the increasing internal bending moment. This premature failure cannot reflect true bonding effect, which would lead to a larger variation for SBS values. When the load flat width is no less than the cylinder thickness, the loading force is uniform theoretically, and the bending moment of the cantilever beam can be calculated by the for- mula of 1/2ql2, where q is the load and l is the length of the
cantilever beam. However, the load beyond bearing area was on the free ends of cylinder, making the location of the maximum principal stress changed from the top of the inter- face between the cylinder and the cement layer to the top of the cylinder free-end. It increased the area of stress distribu- tion, which makes the true SBS values unable to be mea- sured because of the cohesive fracture within the resin com- posite. Stress distribution can be uniform only when the load area is equal to the cylinder thickness, in which case the max- imum principal stress occurs at the bonding interface and more accurate results can be obtained. When the composite resin thickness is 1 or 2 mm, uniform load and non-uniform load show the same stress results, which may be related to the cylinder thickness; the thickness may not be enough to fully reflect the stress distribution results. However, this does not prevent us to draw a conclusion based on the above results that it is necessary to select an appropriate resin cylin- der thickness and corresponding loading area in order to obtain more accurate data in SBS test.
Based on the cantilever beam structure shown in Fig. 7, loading area and cylinder thickness are not the only affecting factor. The cantilever beam of a SBS bonding specimen con- sisted of the resin cement layer and the loading bear materi- al. It has been reported previously that an increase in resin cement thickness led to decreased flexural strength between the glass-based ceramics and resin.8 Another study found that a resin cement layer thickness of between 50 - 150 μm did not affect the SBS of dentine, while 200 μm cement lay- Fig. 6. (A) Means and standard deviations of the SBS values of the groups in result 3.1. Different superscript letters rep- resent group means that were significantly different (P < .05). Regardless of the composite resins factor, the SBS values of the control group were the lowest. (B) Failure modes observed in groups of SBS test in result 3.2.
A B
SBS values (MPa)
13 12 11 10 9 8 7 6 5 4 3 2 1 0
Ctr ZP CCP
Groups
Ctr ZP CCP
Groups
Failure percentage (%)
100
80
60
40
20
0
Z100 Z250 Z350 Adhesive
Mixed Z100
Z250 Z350
Fig. 7. Schematic diagram of a zirconia/resin cement/composite resin structure shear bond strength bonding specimen in a cantilever beam structure. When the load flat width is not less than the length of l, the loading force is uniform, and the bending moment (M) of the cantilever beam is 1/2ql2, where q is the load and l is the length of the cantilever beam;
when the loading force is not uniform, the load flat width is less than the length of l, the bending moment of the a seg- ment (without load) is 0, and the bending moment of the b segment (the length under load) is 1/2qb2.
er thickness led to a decline in SBS.9 In order to pursue con- sistency and standardization of resin cement thickness and to provide a criterion for the loads applied for preparing SBS bonding specimen, we prepared SBS bonding specimens under different pressure that led to the different resin cement thickness. Moreover, in order to make our study close to clinical situation as much as possible, the well- accepted bonding strategy for luting zirconia-based ceramic restorations in clinic, alumina air abrasion followed by condi- tioning with MDP-containing products, was adopted in the in vitro SBS test.25
The load applied for cementing the zirconia end varies from 4 N,26 6 N,27 7.35 N,28,29 9.8 N,30-32 to 20 N18 in previous studies. The present study revealed a negative correlation between loading conditions and the resin cement layer thick- ness, and it can be deducted that the cement thickness ranged within 60 - 20 μm accompanied by the load between 5 - 20 N. The thickness of the cement layer reported in pre- vious literature were 50 μm,20 80 μm,22 100 μm,23,24 and 180 μm24 values. Basing on 3D FE analysis, the models were designed according to the dimensions of the specimens used in the SBS tests. The 3D FE analysis results show that it is easier for thinner resin cement layer to concentrate the inter- nal stress, since the principal stress increases as the thickness of the cement layer decreases. This result is consistent with a previous report,16 which indicates that a thinner resin cement layer would reach the threshold of “load to failure” faster than a thicker one. This result can also explain why the
mixed failure modes began to appear in the 9.8 N load group but failed to be detected in the 1.96 and 4.90 N load groups.
Although the SBS values presented no statistical difference among these three groups, the proportion of the mixed fail- ure mode increased when the load reached 19.60 N.
The thickness of the resin cement layer was maximum under the load of 0.49 N, while the 19.6 N load resulted in the highest dispersion, which in turn resulted in the thinnest resin cement layer. Obviously, the thinner the cement thick- ness is, the better the marginal fitness for restoration.22 However, it should be noted that constant load applied on restorations by fingers cannot reach 20 N when bonded to the abutments in clinic because it will make fingers pain.
Such a higher load should be achieved by bite force.33,34 Another result was found in the 3D FE analysis of models with different cement thickness. The distribution areas resulted from 50 N and 300 N showed similar values of the maximum principal and the maximum principal stress was located at the interface between the resin composite and the resin cement, which decreased quickly in the resin cement and slowly in the resin composite. The principal stress was larger and more widely distributed in the resin composite cylinder than in the cement layer. This result suggested that we should focus on whether composite resin itself affects stress distribution since it is the indispensable part of bond- ing specimen.
A previous study found that von Mises stresses for com- posites with lower elastic moduli spread over a large area,
while composite materials with high elastic moduli accumu- lated stresses at the bonded interface.15 The present study gave a similar result that for the three kinds of composites, the values of the maximum principal increased as composite elastic modulus decreased under 50 N or 300 N load. Chiba et al..15 showed through 3D FE analysis that the cervical sur- face shear stress of the resin core decreased as its elastic modulus increased.
There were also several studies adopting glass-based ceramic or zirconia as the load bearing end to build the sand- wich structured SBS bonding specimen for evaluating the bond strength of zirconia.35 Obviously, the elastic modulus of either glass-based ceramic or zirconia is much higher than that of composite resins. Based on the present results, it can be inferred that the SBS values of bonding specimens con- taining glass-based ceramic or zirconia as the load bearing end would be lower. The present SBS results are in corre- spondence with the 3D FE analysis. The lowest bond strength was found in the group with the highest elastic modulus resin composite Filtek Z100. Although bond strength showed no significant difference between group of Filtek Z350 and Filtek Z250, this may be due not enough precision of SBS test to detect the small difference in these two elastic modulus values.
The present 3D FE analysis also suggested that the maxi- mum principal stress occurs at the bonding interface. This result can explain the residual resin or cement composition in the mixed failure bonded specimens. The control group without the use of primer presented mainly adhesive failures while groups conditioned with primers showed mainly mixed failure modes. This result was due to MDP contained in the primers, which chemically bond with zirconia, improve the bond strength and change the failure modes. However, the chemical bond formation between MDP and zirconia cannot be reflected in the models of finite element simulation.
Nevertheless, only a small number of adhesive failures appeared in the specimens conditioned with primers in Filtek Z250 and Filtek Z350 groups, which can be explained by 3D FE analysis that showed the quick decrease of the maximum principal stress in the resin cement and the slow decrease in the resin composite. Most bending moment con- centrated on composites resulted in mixed failures. The stress existed at the resin cement layer that made the resin cement layer separated, which was more typical in the con- trol group without chemical bonding, showing an adhesive failure mode.
CONCLUSION
Although SBS test is the most commonly used method for evaluation of resin bond strength of zirconia, it is still a challenge to ensure its objectivity and repeatability because of its absence of standardization. In the present study, SBS bonding specimen with a structure of zirconia/resin cement/composite resin was considered as a cantilever beam, which revealed that the load flat width, the resin cement thickness, and different composite resins mechanical
properties influenced the SBS values. During SBS test, the thickness of the composite resin should be consistent with the width load flat to obtain the appropriate stress distribu- tion. When thickness of resin-composite cylinder was 1 mm or 2 mm, the change of the loading flat width ranging from 1 mm to 5 mm had no effect on the stress distribution.
When the composite resin thickness was 3 mm and 4 mm, an equal load flat width was recommended. When preparing SBS specimens, a higher load is recommended during cementation of resin composite cylinder to zirconia to obtain a thicker resin cement layer, and 20 N load would be preferred. Besides, choosing resin composite with lower elas- tic modulus would create higher SBS value than the one with higher elastic modulus.
ACKNOWLEDgEMENTS
The authors thank Mr. Taoran Ma (Kuraray Company Limited, Shang Hai, China) for providing Clearfil SA Luting and Panavia SA Luting Plus.
ORCID
Bingzhuo Chen https://orcid.org/0000-0001-9630-5412 Lu Yang https://orcid.org/0000-0002-5622-2409 Zhicen Lu https://orcid.org/0000-0001-8652-8313 Hongliang Meng https://orcid.org/0000-0003-1173-1610 Xinyi Wu https://orcid.org/0000-0002-0747-7464 Chen Chen https://orcid.org/0000-0002-2989-180X Haifeng Xie https://orcid.org/0000-0003-2008-3846 REFERENCES
1. Blatz MB, Sadan A, Kern M. Resin-ceramic bonding: a review of the literature. J Prosthet Dent 2003;89:268-74.
2. Özcan M, Bernasconi M. Adhesion to zirconia used for den- tal restorations: a systematic review and meta-analysis. J Adhes Dent 2015;17:7-26.
3. Thompson JY, Stoner BR, Piascik JR, Smith R. Adhesion/ce- mentation to zirconia and other non-silicate ceramics: where are we now? Dent Mater 2011;27:71-82.
4. Wong ACH, Tian T, Tsoi JKH, Burrow MF, Matinlinna JP.
Aspects of adhesion tests on resin-glass ceramic bonding.
Dent Mater 2017;33:1045-55.
5. Papia E, Larsson C, du Toit M, Vult von Steyern P. Bonding between oxide ceramics and adhesive cement systems: a sys- tematic review. J Biomed Mater Res B Appl Biomater 2014;102:395-413.
6. Sultan H, Kelly JR, Kazemi RB. Investigating failure behavior and origins under supposed “shear bond” loading. Dent Mater 2015;31:807-13.
7. Braga RR, Meira JB, Boaro LC, Xavier TA. Adhesion to tooth structure: a critical review of “macro” test methods. Dent Mater 2010;26:e38-49.
8. Scherrer SS, de Rijk WG, Belser UC, Meyer JM. Effect of ce- ment film thickness on the fracture resistance of a machin- able glass-ceramic. Dent Mater 1994;10:172-7.
9. Urapepon S. Effect of cement film thickness on shear bond strengths of two resin cements. J Dent 2014;34:122-8.
10. Van Noort R, Noroozi S, Howard IC, Cardew G. A critique of bond strength measurements. J Dent 1989;17:61-7.
11. ISO/TR 11405. Dental materials - Guidance on testing of adhesion to tooth structure. International Standards Organization (ISO); Geneva; Switzerland, 1994. Available at:
https://www.iso.org/standard/19347.html
12. ISO/TS 11405. Dental materials - Testing of adhesion to tooth structure. International Standards Organization (ISO);
Geneva; Switzerland, 2003. Available at: https://www.iso.org/
standard/31486.html
13. ISO 29022. Dentistry - Adhesion - Notched-edge shear bond strength test. International Standards Organization (ISO);
Geneva; Switzerland, 2013. Available at: https://www.iso.org/
standard/45285.html
14. Feilzer AJ, de Gee AJ, Davidson CL. Relaxation of polymer- ization contraction shear stress by hygroscopic expansion. J Dent Res 1990;69:36-9.
15. Chiba A, Hatayama T, Kainose K, Nakajima M, Pashley DH, Wakabayashi N, Tagami J. The influence of elastic moduli of core materials on shear stress distributions at the adhesive in- terface in resin built-up teeth. Dent Mater J 2017;36:95-102.
16. Kanat B, Cömlekoğlu ME, Cömlekoğlu MD, Culha O, Ozcan M, Güngör MA. Microshear bond strength and finite element analysis of resin composite adhesion to press-on-metal ce- ramic for repair actions after various conditioning methods. J Adhes Dent 2014;16:63-70.
17. Ayar M, Yesilyurt C, Yildirim T. Effect of different composite placement molds on resin-enamel/dentin shear bond strength.
J Res Med Dent Sci 2016;4:141-5.
18. Chen Y, Lu Z, Qian M, Zhang H, Chen C, Xie H, Tay FR.
Chemical affinity of 10-methacryloyloxydecyl dihydrogen phosphate to dental zirconia: Effects of molecular structure and solvents. Dent Mater 2017;33:e415-27.
19. Attia A. Bond strength of three luting agents to zirconia ce- ramic - influence of surface treatment and thermocycling. J Appl Oral Sci 2011;19:388-95.
20. Gressler May L, Kelly JR, Bottino MA, Hill T. Influence of the resin cement thickness on the fatigue failure loads of CAD/CAM feldspathic crowns. Dent Mater 2015;31:895-900.
21. Jin XZ, Homaei E, Matinlinna JP, Tsoi JKH. A new concept and finite-element study on dental bond strength tests. Dent Mater 2016;32:e238-50.
22. Rezende CE, Borges AF, Gonzaga CC, Duan Y, Rubo JH, Griggs JA. Effect of cement space on stress distribution in Y-TZP based crowns. Dent Mater 2017;33:144-51.
23. Ha SR, Kim SH, Lee JB, Han JS, Yeo IS, Yoo SH, Kim HK.
Biomechanical three-dimensional finite element analysis of monolithic zirconia crown with different cement thickness.
Ceram Int 2016;42:14928-36.
24. Liu HL, Lin CL, Sun MT, Chang YH. Numerical investigation of macro- and micro-mechanics of a ceramic veneer bonded with various cement thicknesses using the typical and sub- modeling finite element approaches. J Dent 2009;37:141-8.
25. Turp V, Sen D, Tuncelli B, Ozcan M. Adhesion of 10-MDP containing resin cements to dentin with and without the etch-
and-rinse technique. J Adv Prosthodont 2013;5:226-33.
26. Lüthy H, Loeffel O, Hammerle CH. Effect of thermocycling on bond strength of luting cements to zirconia ceramic. Dent Mater 2006;22:195-200.
27. de Souza G, Hennig D, Aggarwal A, Tam LE. The use of MDP-based materials for bonding to zirconia. J Prosthet Dent 2014;112:895-902.
28. Wolfart M, Lehmann F, Wolfart S, Kern M. Durability of the resin bond strength to zirconia ceramic after using different surface conditioning methods. Dent Mater 2007;23:45-50.
29. Yang B, Lange-Jansen HC, Scharnberg M, Wolfart S, Ludwig K, Adelung R, Kern M. Influence of saliva contamination on zirconia ceramic bonding. Dent Mater 2008;24:508-13.
30. Chai H, Kaizer M, Chughtai A, Tong H, Tanaka C, Zhang Y.
On the interfacial fracture resistance of resin-bonded zirconia and glass-infiltrated graded zirconia. Dent Mater 2015;31:1304- 11.
31. Phark JH, Duarte S Jr, Kahn H, Blatz MB, Sadan A.
Influence of contamination and cleaning on bond strength to modified zirconia. Dent Mater 2009;25:1541-50.
32. Vechiato-Filho AJ, Matos AO, Landers R, Goiato MC, Rangel EC, De Souza GM, Barão VAR, Dos Santos DM. Surface analysis and shear bond strength of zirconia on resin cements after non-thermal plasma treatment and/or primer applica- tion for metallic alloys. Mater Sci Eng C Mater Biol Appl 2017;72:284-92.
33. Wilson PR. Crown behaviour during cementation. J Dent 1992;20:156-62.
34. Wassell RW, Barker D, Steele JG. Crowns and other extra-cor- onal restorations: try-in and cementation of crowns. Br Dent J 2002;193:17-20, 23-8.
35. Kim SH, Park CJ, Cho LR, Huh YH. Evaluation of the ce- ramic liner bonding effect between zirconia and lithium disili- cate. J Prosthet Dent 2018;120:282-9.