ABSTRACT
Background and Objectives: This study aimed to investigate the right-left arm difference in detection of hypertension in the general Korean population.
Methods: This study analyzed data from the Cardiovascular and Metabolic Disease Etiology Research Center cohort. Study population was 2,103 people who were aged 30 to 64 years old, without history of major cardiovascular diseases, and did not use antihypertensive medication. Brachial blood pressures (BPs) were measured for both arms using an automated oscillometric device equipped with 2 cuffs for simultaneous double-arm measurements.
Systolic and diastolic blood pressures (SBP and DBP) were measured 3 times, and the average value was used in the analysis. Overall hypertension was defined as elevated blood pressure (SBP/DBP ≥140/90 mmHg) at the arm with higher value, while right-arm or left- arm hypertension was defined as elevated BP at each arm. Sensitivity was calculated as the number of each-arm hypertension divided by the number of overall hypertension.
Results: Overall 8.6% of the population had hypertension at either arm, while 7.8% had right- arm hypertension, 7.2% had left-arm hypertension, and 6.4% had both arms hypertension.
The sensitivity for the detection of hypertension was 90.6% when BP was measured only at right arm, and 83.4% when measured only at left arm. Corresponding sensitivity were 87.9%
and 87.1% in men, and 95.4% and 76.9% in women.
Conclusions: Single-arm measurements, compared to double-arm measurements, may underestimate the prevalence of hypertension. However, if double-arm measurements are unavailable, right arm is preferred for measurement of BP, especially in women.
Keywords: Blood pressure; Koreans; Population
INTRODUCTION
Hypertension is associated with increased mortality and morbidity from cardiovascular, cerebrovascular, and renal disease.
1)Since hypertension is a modifiable risk factor, the accurate assessment of blood pressure (BP) is essential for early detection of hypertension and prevention of complications related to hypertension. According to the 2017 American College of Cardiology/American Heart Association Guideline and the seventh report of Joint National Committee,
2)3)BP should be measured in both arms at the initial assessment and
Original Article
Received: May 2, 2018 Revised: Aug 9, 2018 Accepted: Oct 2, 2018 Correspondence to
Dae Ryong Kang, PhD
Center of Biomedical Data Science, Yonsei University Wonju College of Medicine, 20, Ilsan-ro, Wonju 26426, Korea.
E-mail: [email protected]
Copyright © 2019. The Korean Society of Cardiology
This is an Open Access article distributed under the terms of the Creative Commons Attribution Non-Commercial License (https://
creativecommons.org/licenses/by-nc/4.0) which permits unrestricted noncommercial use, distribution, and reproduction in any medium, provided the original work is properly cited.
ORCID iDs
Bo Mi Song
https://orcid.org/0000-0003-3181-5803 Hyeon Chang Kim
https://orcid.org/0000-0001-7867-1240 Jee-Seon Shim
https://orcid.org/0000-0002-8671-3153 Dae Ryong Kang
https://orcid.org/0000-0002-8792-9730
FundingThe work was supported by grants from the Korean Health Technology R&D Project, Ministry of Health & Welfare (HI13C0715).
Conflict of Interest
The authors have no financial conflicts of interest.
Bo Mi Song , PhD
1, Hyeon Chang Kim , MD, PhD
1,2, Jee-Seon Shim , PhD
1, and Dae Ryong Kang , PhD
31
Cardiovascular and Metabolic Disease Etiology Research Center, Yonsei University College of Medicine, Seoul, Korea
2
Department of Preventive Medicine, Yonsei University College of Medicine, Seoul, Korea
3
Center of Biomedical Data Science, Yonsei University Wonju College of Medicine, Wonju, Korea
Comparison between Right and
Left Upper Arms in Detection of
Hypertension
Author Contributions
Supervision: Shim JS; Writing - original draft:
Song BM; Writing - review & editing: Kang DR, Kim HC.
that if there is a difference, the arm with the higher BP should be used again to diagnose hypertension. Then the BP of the arm is monitored. However, in many situations, it is difficult to measure BP of both arms due to practical problems such as lack of time, cost, equipment, and manpower. Thus, the BP of 1 arm (usually the right arm) is measured as defining hypertension in most studies. However, there is a lack of epidemiological data on which arm should be measured when double-arm measurements are unavailable. Thus, this study aimed to investigate the right-left arm difference in detection of hypertension in the general Korean population.
MATERIALS AND METHODS
Study population
This study analyzed data from the Cardiovascular and Metabolic Disease Etiology Research Center (CMERC) cohort, which began in 2013. The CMERC study enrolled 2,465 participants residing in 4 districts throughout South Korea (Seoul, Goyang, Gimpo, and Incheon) between December 2013 and April 2016. Eligibility criteria for participant inclusion comprised; 1) age of 30–64 years, 2) having lived more than 8 months of the year at current residence with no migration plans over the next 2 years, and 3) ability to provide verbal or written consent to participate in the study. Participants were excluded if they; 1) were diagnosed with cancer within the last 2 years or were currently being treated for cancer, 2) had a history of myocardial infarction, stroke, or heart failure, 3) were currently involved in pharmaceutical trials, and 4) were currently pregnant or reported the possibility of being pregnant on the day of registration. All participants completed health questionnaires and health examinations following an identical protocol. After excluding 1 person with missing BP measurements and 361 people receiving treatment by oral antihypertensive agents, we conducted a cross-sectional analysis for 2,103 participants (729 men and 1,374 women).
This study was approved by the Institutional Review Board of Severance Hospital at Yonsei University College of Medicine (approval number: 4-2013-0661), and all participants provided written informed consent.
Questionnaire data
All study participants were interviewed using standardized questionnaires to acquire information about their demographics, medical history, and health behaviors. Trained interviewers individually carried out the questionnaire surveys according to a predefined protocol. The designated field director double-checked whether responses were inappropriate or missing. Smoking status was divided into 2 groups: current smoking or current nonsmoking (past smoking or never smoking). Alcohol intake was also divided into 2 groups: current alcohol drinking or current nondrinking (past alcohol drinking or never drinking). Physical activity was measured by the International Physical Activity Questionnaire-Short Form: moderate activity refers to activity that causes individuals to breathe somewhat harder than normal, and high activity refers to activity that causes individuals to breathe much harder than normal. Regular exercise was defined as physical activity of moderate-to-high intensity for at least 3 times per week.
Physical examination
All participants were clothed in lightweight hospital gowns for reliable examinations.
Standing height was measured to the nearest 0.1 cm using a stadiometer (DS-102; JENIX,
Seoul, Korea), and body weight was measured to the nearest 0.1 kg on a digital scale (DB-150;
CAS, Seoul, Korea) according to the pre-developed protocol. Body mass index (BMI) was calculated as body weight in kilograms divided by standing height in meters squared (kg/m
2).
Waist circumference was measured to the nearest 0.1 cm at the midpoint between the lower borders of the rib cage and the iliac crest with an ergonomic circumference measuring tape (SECA 201; SECA, Hamburg, Germany). Arm circumference was measured to the nearest 0.1 cm at the midpoint between the acromion and the olecranon with the right arm hanging relaxed using an ergonomic circumference measuring tape (SECA 201; SECA).
Laboratory assays
Overnight fasting blood samples from all participants were collected from the antecubital vein. Enzymatic methods were applied to measure total cholesterol, high-density lipoprotein cholesterol, and triglycerides levels (ADVIA 1800 Auto Analyzer; Siemens Medical
Solutions, Malvern, PA, USA). Fasting blood glucose concentrations were measured using a colorimetry method (ADVIA 1800 Auto Analyzer; Siemens Medical Solutions). Serum insulin concentrations were measured in accordance with a radioimmunoassay (SR-300; Stratec, Birkenfeld, Germany). Hemoglobin A1c concentrations were measured by high performance liquid chromatography (Variant II TURBO, Bio-Rad, Hercules, CA, USA) according
to the National Glycohemoglobin Standardization Program. C-reactive protein (CRP) concentrations were determined in accordance with a turbidimetric immunoassay (ADVIA 1800 Auto Analyzer; Siemens Medical Solutions).
Blood pressure measurements
Brachial BP was measured for both arms using an automated oscillometric device (WatchBP office; Microlife, Widnau, Switzerland) equipped with 2 cuffs for simultaneous both arm measurements. Cuff size was chosen for each individual's arm according to his/her mid-arm circumference, and the appropriate cuff size was used for each arm. Systolic blood pressure (SBP) and diastolic blood pressure (DBP) were repeatedly measured after at least 5 minutes of rest in the seated position, and the average of the 3 measurements was used in the analysis.
Differences in BP were calculated by subtracting the left-arm BP (L) from the right-arm BP (R).
We also calculated the absolute BP difference as the absolute value of R–L (|R–L|) to investigate differences in BP between the right and left arms regardless of which arm showed the higher BP value. A large inter-arm BP difference was defined as an absolute inter-arm BP difference greater than 10 mmHg.
4)Hypertension was defined as SBP ≥140 mmHg or DBP ≥90 mmHg.
Among others, prehypertension was defined as SBP ≥120 mmHg or DBP ≥80 mmHg. Overall hypertension was defined as elevated BP at the arm with higher value, while right-arm or left- arm hypertension was defined as hypertension at each arm.
Statistical analysis
We evaluated differences in general characteristics and distribution of BP between men and women. Continuous variables were described as means and standard deviation (for normally distributed variables) or as a median and interquartile range (for skewed variables), and tested by independent t-test and Wilcoxon rank sum test, respectively. Categorical variables were described as numbers (percentages) and tested by χ
2tests. Inter-arm BP difference was evaluated using paired t-test after dividing into subgroups by sex, age (<50 years or
≥50 years), and BMI (<23 kg/m
2or ≥23 kg/m
2). Agreement between R and L evaluated using
an intraclass correlation coefficient. Agreement between the right-left arm in detection of
hypertension evaluated using Κ statistic. We also calculated predictive values of R and L
for screening for hypertension according to the subgroups. False negative case is a case in
which the measured arm is non-hypertension but hypertensive at the opposite arm. False
negative rate was calculated as the false negative case divided by the number of hypertension at each arm. Sensitivity was calculated as the number of each-arm hypertension divided by the number of overall hypertension. Negative predictive value was calculated as the number of non-hypertension at each arm divided by the number of non-hypertension at both arms.
Additionally, to identify factors independently associated with an inter-arm BP difference, we calculated adjusted odds ratios (ORs) and 95% confidence intervals (CIs) using multivariate logistic regression models, which included age, sex, BMI, CRP, and mean SBP. All statistical analyses were performed using SAS version 9.4 (SAS Institute Inc., Cary, NC, USA), and statistical significance was defined as a 2-sided p value of less than 0.05.
RESULTS
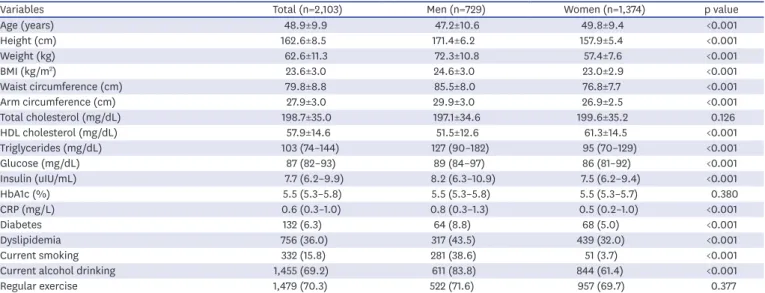
The general characteristics and variables of interest of the study participants are presented in Table 1. This study comprised 729 men with a mean age of 47.2 years and 1,374 women with a mean age of 49.8 years.
Table 2 presents the distribution of BP of study participants. For the entire population, right SBP/DBP and left SBP/DBP were 114.3/73.2 mmHg and 114.0/72.8 mmHg, respectively.
The median absolute inter-arm differences in SBP and DBP were 3 mmHg and 2 mmHg, respectively (both SBP and DBP; p<0.001). The proportion of overall hypertension and prehypertension were 8.6% and 29.8%, respectively.
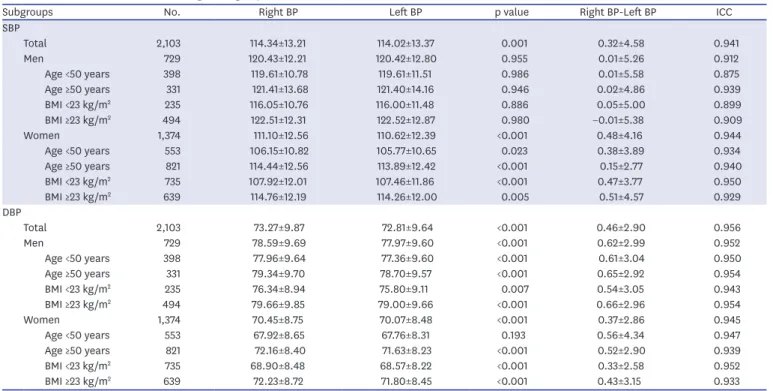
To assess the impact of sex, age, and BMI on the inter-arm BP differences, we presented the right-left arm difference according to subgroups in Table 3. In men, there were not significant differences between right and left SBPs and the right DBPs were significantly higher than the left DBPs across all subgroups. However, in women, the right SBPs and DBPs were significantly higher than the left SBPs and DBPs across all subgroups except DBP for women under 50 years of age.
Table 1. General characteristics of study participants
Variables Total (n=2,103) Men (n=729) Women (n=1,374) p value
Age (years) 48.9±9.9 47.2±10.6 49.8±9.4 <0.001
Height (cm) 162.6±8.5 171.4±6.2 157.9±5.4 <0.001
Weight (kg) 62.6±11.3 72.3±10.8 57.4±7.6 <0.001
BMI (kg/m
2) 23.6±3.0 24.6±3.0 23.0±2.9 <0.001
Waist circumference (cm) 79.8±8.8 85.5±8.0 76.8±7.7 <0.001
Arm circumference (cm) 27.9±3.0 29.9±3.0 26.9±2.5 <0.001
Total cholesterol (mg/dL) 198.7±35.0 197.1±34.6 199.6±35.2 0.126
HDL cholesterol (mg/dL) 57.9±14.6 51.5±12.6 61.3±14.5 <0.001
Triglycerides (mg/dL) 103 (74–144) 127 (90–182) 95 (70–129) <0.001
Glucose (mg/dL) 87 (82–93) 89 (84–97) 86 (81–92) <0.001
Insulin (uIU/mL) 7.7 (6.2–9.9) 8.2 (6.3–10.9) 7.5 (6.2–9.4) <0.001
HbA1c (%) 5.5 (5.3–5.8) 5.5 (5.3–5.8) 5.5 (5.3–5.7) 0.380
CRP (mg/L) 0.6 (0.3–1.0) 0.8 (0.3–1.3) 0.5 (0.2–1.0) <0.001
Diabetes 132 (6.3) 64 (8.8) 68 (5.0) <0.001
Dyslipidemia 756 (36.0) 317 (43.5) 439 (32.0) <0.001
Current smoking 332 (15.8) 281 (38.6) 51 (3.7) <0.001
Current alcohol drinking 1,455 (69.2) 611 (83.8) 844 (61.4) <0.001
Regular exercise 1,479 (70.3) 522 (71.6) 957 (69.7) 0.377
Data are expressed as mean±standard deviation, or numbers (%). The p value was derived from independent t-test, Willcoxon rank sum test, or χ
2test.
BMI = body mass index; CRP = C-reactive protein; Hb = hemoglobin; HDL = high-density lipoprotein.
Table 4 presents the false negative rate, sensitivity, and negative predictive values for screening for hypertension according to subgroups. The false negative rate was 10.4% when BP was
Table 2. Distribution of BPs of study participantsVariables Total (n=2,103) Men (n=729) Women (n=1,374) p value
Right SBP (mmHg) 114.3±13.2 120.4±12.2 111.1±12.6 <0.001
Right DBP (mmHg) 73.3±9.9 78.6±9.7 70.4±8.7 <0.001
Left SBP (mmHg) 114.0±13.4 120.4±12.8 110.6±12.4 <0.001
Left DBP (mmHg) 72.8±9.6 78.0±9.6 70.1±8.5 <0.001
Overall <0.001
Normal
*1,296 (61.6) 289 (39.6) 1,007 (73.3)
Prehypertension
†626 (29.8) 324 (44.4) 302 (22.0)
Hypertension
‡181 (8.6) 116 (15.9) 65 (4.7)
Right arm <0.001
Normal
*1,363 (64.8) 321 (44.0) 1,042 (75.8)
Prehypertension
†576 (27.4) 306 (42.0) 270 (19.7)
Hypertension
‡164 (7.8) 102 (14.0) 62 (4.5)
Left arm <0.001
Normal
*1,405 (66.8) 342 (46.9) 1,063 (77.4)
Prehypertension
†547 (26.0) 286 (39.2) 261 (19.0)
Hypertension
‡151 (7.2) 101 (13.9) 50 (3.6)
SBP (R–L) (mmHg) 0.3±4.6 0.0±5.3 0.5±4.2 0.035
DBP (R–L) (mmHg) 0.5±2.9 0.6±3.0 0.4±2.9 0.061
SBP |R–L| (mmHg) 3 (1–5) 3 (2–6) 3 (1–5) <0.001
DBP |R–L| (mmHg) 2 (1–3) 2 (1–3) 2 (1–3) 0.174
SBP |R–L|≥10 (mmHg) 88 (4.2) 53 (7.3) 35 (2.6) <0.001
DBP |R–L|≥10 (mmHg) 16 (0.8) 5 (0.7) 11 (0.8) 0.981
Data are expressed as mean±standard deviation or numbers (%).
The p value was derived from independent t-test or χ
2test.
BP = blood pressure; DBP = diastolic blood pressure; L = left-arm BP; R = right-arm BP; SBP = systolic blood pressure.
*
Normal was defined as SBP <120 mmHg and DBP <80 mmHg;
†Prehypertension was defined as 120 mmHg≤ SBP <140 mmHg or 80 mmHg≤ DBP <90 mmHg among non-hypertensive people;
‡Hypertension was defined as SBP ≥140 mmHg or DBP ≥90 mmHg.
Table 3. Inter-arm BP difference according to subgroups
Subgroups No. Right BP Left BP p value Right BP-Left BP ICC
SBP
Total 2,103 114.34±13.21 114.02±13.37 0.001 0.32±4.58 0.941
Men 729 120.43±12.21 120.42±12.80 0.955 0.01±5.26 0.912
Age <50 years 398 119.61±10.78 119.61±11.51 0.986 0.01±5.58 0.875
Age ≥50 years 331 121.41±13.68 121.40±14.16 0.946 0.02±4.86 0.939
BMI <23 kg/m
2235 116.05±10.76 116.00±11.48 0.886 0.05±5.00 0.899
BMI ≥23 kg/m
2494 122.51±12.31 122.52±12.87 0.980 −0.01±5.38 0.909
Women 1,374 111.10±12.56 110.62±12.39 <0.001 0.48±4.16 0.944
Age <50 years 553 106.15±10.82 105.77±10.65 0.023 0.38±3.89 0.934
Age ≥50 years 821 114.44±12.56 113.89±12.42 <0.001 0.15±2.77 0.940
BMI <23 kg/m
2735 107.92±12.01 107.46±11.86 <0.001 0.47±3.77 0.950
BMI ≥23 kg/m
2639 114.76±12.19 114.26±12.00 0.005 0.51±4.57 0.929
DBP
Total 2,103 73.27±9.87 72.81±9.64 <0.001 0.46±2.90 0.956
Men 729 78.59±9.69 77.97±9.60 <0.001 0.62±2.99 0.952
Age <50 years 398 77.96±9.64 77.36±9.60 <0.001 0.61±3.04 0.950
Age ≥50 years 331 79.34±9.70 78.70±9.57 <0.001 0.65±2.92 0.954
BMI <23 kg/m
2235 76.34±8.94 75.80±9.11 0.007 0.54±3.05 0.943
BMI ≥23 kg/m
2494 79.66±9.85 79.00±9.66 <0.001 0.66±2.96 0.954
Women 1,374 70.45±8.75 70.07±8.48 <0.001 0.37±2.86 0.945
Age <50 years 553 67.92±8.65 67.76±8.31 0.193 0.56±4.34 0.947
Age ≥50 years 821 72.16±8.40 71.63±8.23 <0.001 0.52±2.90 0.939
BMI <23 kg/m
2735 68.90±8.48 68.57±8.22 <0.001 0.33±2.58 0.952
BMI ≥23 kg/m
2639 72.23±8.72 71.80±8.45 <0.001 0.43±3.15 0.933
Data are expressed as mean±standard deviation or numbers (%). The p value was derived from paired t-test.
BMI = body mass index; BP = blood pressure; DBP = diastolic blood pressure; ICC = intraclass correlation coefficient; SBP = systolic blood pressure.
measured only at right arm, and 19.9% when measured only at left arm. Corresponding false negative rates were 13.7% and 14.9% in men, and 4.8% and 30.0% in women, respectively. The sensitivity for the detection of hypertension was 90.6% when BP was measured only at right arm, and 83.4% when measured only at left arm. Corresponding sensitivity were 87.9% and 87.1% in men, and 95.4% and 76.9% in women, respectively. In all subgroups except men older than 50 years or men with BMI greater than 23 kg/m
2, the sensitivity for the detection of hypertension was higher when BP was measured only at right arm than when measured only at left arm. We conducted additional analyses after including 361 participants with antihypertensive medication (Supplementary Table 1). Results before and after including these people were similar.
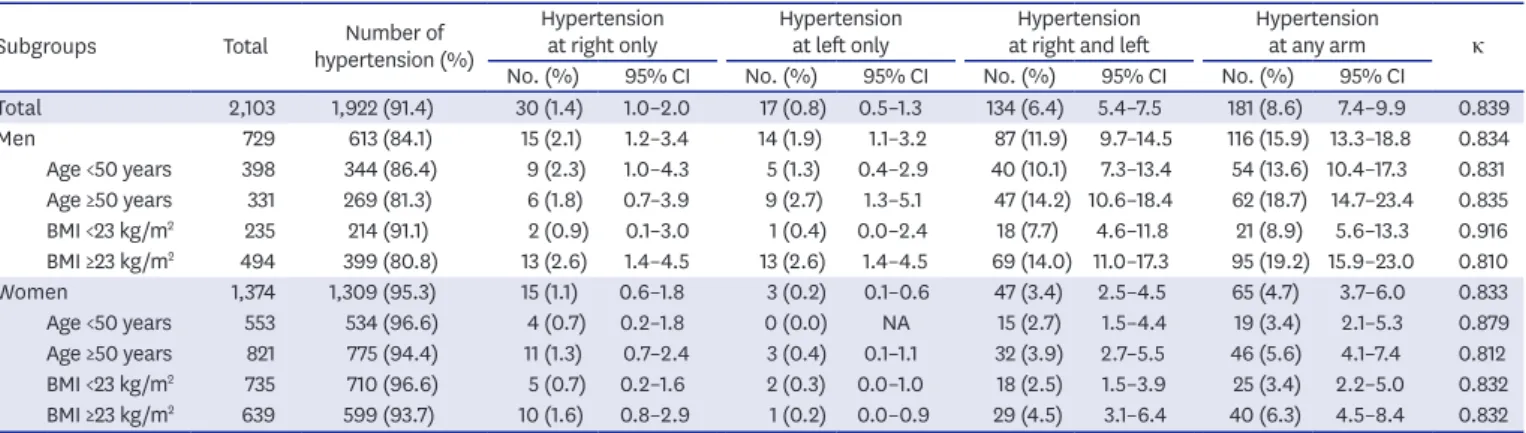
Table 5 presents prevalences of right and left hypertension according to subgroups. For the entire population, the prevalence of right hypertension was higher than that that of
Table 4. Predictive values for screening for hypertension according to subgroups
Subgroups Total Hypertension False negative case (% total) False negative rate Sensitivity (95% CI) Negative predictive value (95% CI) Right BP
Total 2,103 164 17 (0.8) 10.4 90.6 (85.4–94.4) 99.1 (98.6–99.5)
Men 729 102 14 (1.9) 13.7 87.9 (80.6–93.2) 97.8 (96.3–98.8)
Age <50 years 398 49 5 (1.3) 10.2 90.7 (79.7–96.9) 98.6 (96.7–99.5)
Age ≥50 years 331 53 9 (2.7) 17.0 85.5 (74.2–93.1) 96.8 (93.9–98.5)
BMI <23 kg/m
2235 20 1 (0.4) 5.0 95.2 (76.2–99.9) 99.5 (97.4–100.0)
BMI ≥23 kg/m
2494 82 13 (2.6) 15.9 86.3 (77.7–92.5) 96.8 (94.7–98.3)
Women 1,374 62 3 (0.2) 4.8 95.4 (87.1–99.0) 99.8 (99.3–100.0)
Age <50 years 553 19 0 (0.0) 0.0 100.0 (82.4–100.0) 100.0 (99.3–100.0)
Age ≥50 years 821 43 3 (0.4) 7.0 93.5 (82.1–98.6) 99.6 (98.9–99.9)
BMI <23 kg/m
2735 23 2 (0.3) 8.7 92.0 (74.0–99.0) 99.7 (99.0–100.0)
BMI ≥23 kg/m
2639 39 1 (0.2) 2.6 97.5 (86.8–99.9) 99.8 (99.1–100.0)
Left BP
Total 2,103 151 30 (1.4) 19.9 83.4 (77.2–88.5) 98.5 (97.8–99.0)
Men 729 101 15 (2.1) 14.9 87.1 (79.6–92.6) 97.6 (96.1–98.7)
Age <50 years 398 45 9 (2.3) 20.0 83.3 (70.7–92.1) 97.5 (95.2–98.8)
Age ≥50 years 331 56 6 (1.8) 10.7 90.3 (80.1–96.4) 97.8 (95.3–99.2)
BMI <23 kg/m
2235 19 2 (0.9) 10.5 90.5 (69.6–98.8) 99.1 (96.7–99.9)
BMI ≥23 kg/m
2494 82 13 (2.6) 15.9 86.3 (77.7–92.5) 96.8 (94.7–98.3)
Women 1,374 50 15 (1.1) 30.0 76.9 (64.8–86.5) 98.9 (98.1–99.4)
Age <50 years 553 15 4 (0.7) 26.7 79.0 (54.4–94.0) 99.3 (98.1–99.8)
Age ≥50 years 821 35 11 (1.3) 31.4 76.1 (61.2–87.4) 98.6 (97.5–99.3)
BMI <23 kg/m
2735 20 5 (0.7) 25.0 80.0 (59.3–93.2) 99.3 (98.4–99.8)
BMI ≥23 kg/m
2639 30 10 (1.6) 33.3 75.0 (58.8–87.3) 98.4 (97.0–99.2)
BMI = body mass index; BP = blood pressure; CI = confidence interval.
Table 5. Prevalences of hypertension according to right and left
Subgroups Total Number of
hypertension (%)
Hypertension
at right only Hypertension
at left only Hypertension
at right and left Hypertension
at any arm κ
No. (%) 95% CI No. (%) 95% CI No. (%) 95% CI No. (%) 95% CI
Total 2,103 1,922 (91.4) 30 (1.4) 1.0–2.0 17 (0.8) 0.5–1.3 134 (6.4) 5.4–7.5 181 (8.6) 7.4–9.9 0.839
Men 729 613 (84.1) 15 (2.1) 1.2–3.4 14 (1.9) 1.1–3.2 87 (11.9) 9.7–14.5 116 (15.9) 13.3–18.8 0.834
Age <50 years 398 344 (86.4) 9 (2.3) 1.0–4.3 5 (1.3) 0.4–2.9 40 (10.1) 7.3–13.4 54 (13.6) 10.4–17.3 0.831 Age ≥50 years 331 269 (81.3) 6 (1.8) 0.7–3.9 9 (2.7) 1.3–5.1 47 (14.2) 10.6–18.4 62 (18.7) 14.7–23.4 0.835 BMI <23 kg/m
2235 214 (91.1) 2 (0.9) 0.1–3.0 1 (0.4) 0.0–2.4 18 (7.7) 4.6–11.8 21 (8.9) 5.6–13.3 0.916 BMI ≥23 kg/m
2494 399 (80.8) 13 (2.6) 1.4–4.5 13 (2.6) 1.4–4.5 69 (14.0) 11.0–17.3 95 (19.2) 15.9–23.0 0.810
Women 1,374 1,309 (95.3) 15 (1.1) 0.6–1.8 3 (0.2) 0.1–0.6 47 (3.4) 2.5–4.5 65 (4.7) 3.7–6.0 0.833
Age <50 years 553 534 (96.6) 4 (0.7) 0.2–1.8 0 (0.0) NA 15 (2.7) 1.5–4.4 19 (3.4) 2.1–5.3 0.879
Age ≥50 years 821 775 (94.4) 11 (1.3) 0.7–2.4 3 (0.4) 0.1–1.1 32 (3.9) 2.7–5.5 46 (5.6) 4.1–7.4 0.812 BMI <23 kg/m
2735 710 (96.6) 5 (0.7) 0.2–1.6 2 (0.3) 0.0–1.0 18 (2.5) 1.5–3.9 25 (3.4) 2.2–5.0 0.832 BMI ≥23 kg/m
2639 599 (93.7) 10 (1.6) 0.8–2.9 1 (0.2) 0.0–0.9 29 (4.5) 3.1–6.4 40 (6.3) 4.5–8.4 0.832 Κ means the agreement between the right-left arms in detection of hypertension.
BMI = body mass index; CI = confidence interval.
left hypertension. In men over 50 years old, the prevalence of right hypertension was lower than that of left hypertension. In men over the BMI of 23 kg/m
2, the prevalence of right hypertension and left hypertension were the same. In men under 50 years old and men under the BMI of 23 kg/m
2, the prevalence of right hypertension was higher than that of left hypertension. Meanwhile, in women, the prevalence of right hypertension was higher than that of left hypertension in all subgroups.
Figure 1 presents the distribution of right, left, and both arm hypertension according to subgroups. Among the overall hypertension, the proportions of only the right hypertension and only the left hypertension were similar (12.1% vs. 12.9%) in men. However, in
women, the proportion of only the right hypertension was higher than that of only the left hypertension (4.6% vs. 23.1%). In all subgroups according to age and BMI, the difference in prevalences of left and right hypertension was greater in women than in men.
Factors associated with an inter-arm BP difference ≥10 mmHg were assessed by
multivariate logistic regression models, which included age, sex, BMI, CRP, and mean SBP (Supplementary Table 2). An inter-arm difference in SBP ≥10 mmHg was independently associated with BMI (OR, 1.12 per kg/m
2; 95% CI, 1.05–1.20), CRP (1.03 per mg/L; 1.00–1.07), and mean SBP (1.04 per mmHg; 1.02–1.06). An inter-arm difference in DBP ≥10 mmHg was independently associated with only BMI (1.23 per kg/m
2; 1.06–1.43).
DISCUSSION
The present study investigated the right-left arm difference in detection of hypertension in the general Korean population. Herein, measuring BP at right arm performed better than measuring BP at left arm in detection of hypertension, especially in women.
Total Men, subtotal Men, age <50 years Men, age ≥50 years Men, BMI <23 kg/m
2Men, BMI ≥23 kg/m
2Women, age <50 years Women, age ≥50 years Women, BMI <23 kg/m
2Women, BMI ≥23 kg/m
20 20 40 60 80 100
Women, subtotal
%
16.6 74.0
9.4
12.9 75.0
12.1
16.7 74.7
9.3
9.7 75.8
14.5
9.5 85.7
4.8
13.7 72.6
13.7
23.1 72.3
4.6
21.1 78.9
23.9 69.6
6.5
20.0 72.0
8.0
25.0 72.5
2.5
Hypertention at left arm Hypertention at both arms Hypertention at right arm
Figure 1. Hypertension at right and left arms according to sex, age, and obesity.
BMI = body mass index.
To our knowledge, the current study is the first to compare the predictive values of the right-left arm in detection of hypertension. A few studies have only presented the difference in BP level between both arms and the BP at right arm was higher than that at left arm.
5-7)Those findings suggest that right arm should be preferred for hypertension screening, when BP measurements at both arms are unavailable. The present study provided additional information on how much hypertension is missed and how much hypertension can be detected when the BP is measured at only 1 arm by calculating predictive values such as false negative rate, sensitivity, and negative predictive value as well as the difference in BP between the right-left arms. According to the results of this study, measuring BP at right arm decreased false negative rate by 9.5% and increased sensitivity by 7.2% compared to measuring BP at left arm. The decrement of false negative rate (women vs. men, 25.2% vs. 1.2%) and increment of sensitivity (women vs. men, 18.5% vs. 0.8%) were greater in women than in men. The reason for a greater decrease in false negative rate and increase in sensitivity in women than men is that BP itself is higher in men than in women. In general, men have higher BP than women through middle age because estrogen, a female hormone, may play a role in protecting females from developing higher BP.
In addition, even after stratification according to age or BMI, measuring BP at right arm also performed better than measuring BP at left arm in detection of hypertension.
Our results confirmed that BP at right arm was higher than BP at left arm, consistently with results of previous studies.
5)7-10)A possible explanation is that muscles in the dominant arm are more developed that it might take more pressure in the right arm cuff to overcome tissue inertia. Hence, BP in the right arm of right handed people might be measured higher than the BP in their left arm.
10)In addition, some investigators have suggested that anatomical differences in the normal vascular supply to the arms may explain bilateral differences in
BP.
11)12)It has been suggested that since the brachiocephalic artery is nearer the source of
pressure and is more in the direction of flow of blood from the ascending aorta, that BP might be higher in the right brachial artery compared to the left.
12)When compared with the Korea National Health and Nutrition Examination Survey (KNHANES) in 2015, the prevalences of hypertension in our study participants after including 361 people receiving treatment by oral antihypertensive agents were lower (men, 32.7% vs. 29.9%; women, 23.1% vs. 17.7%). There are several reasons for differences in the prevalences of hypertension between this study and KNHANES. First, our study initially recruited healthy people without a history of cardiovascular diseases such as myocardial infarction, stroke, or heart failure. Second, the participants used in this study were younger than those used in KNHANES (30–64 years vs. ≥30 years). Third, our study participants are volunteers, who are likely to be interested in health.
The current study simultaneously measured BP at both arms 3 times using an automated
device equipped with 2 cuffs. To accurately compare BPs at right-left arm, it is important to
simultaneously measure double arms because there may be an order effect with sequential
assessment of BP, with higher BP recorded in the arm in which the BP is measured first.
13)14)However, a primary care setting study in UK and Framingham Heart Study in USA sequentially
determined BP at right-left arm to investigate the inter-arm difference in BP.
5)15)The number of
BP measurements can also affect the observed inter-arm differences in BP. When an individual's
BPs are measured multiple times, later BP values tend to be lower than earlier values. It can
reduce the variation of inter-arm difference and increase the reproducibility.
16)Many of earlier
studies have measured BP only once
5)17-19)or twice.
8)In addition, a National Cardiovascular Risk
Factor Survey in Finland simultaneously measured BP at both arms using 2 BP monitors.
9)Furthermore, we identified factors associated with large inter-arm BP differences. Large inter-arm differences ≥10 mmHg in SBP and DBP were found in 4.2% and 0.8% of participants, respectively.
A large inter-arm difference in SBP was independently associated with BMI, CRP, and mean SBP, while a large inter-arm difference in DBP was independently associated with only BMI.
These findings are in consistent with results of several previous reports. A Kaohsiung Municipal Hsiao-Kang Hospital study in Taiwan,
20)a Ohasama study,
8)and a primary medical care study in Japan
21)have reported the association between BMI and inter-arm BP differences. In a USA cohort study of hypertensive patients, elevated CRP concentrations have been more frequently found in patients with large inter-arm difference in SBP (≥15 mmHg) compared with those with normal inter-arm SBP differences (53% vs. 33%).
22)Several studies have reported the association between hypertension and inter-arm BP differences, including the Framingham Heart Study,
15)the National Cardiovascular Risk Factor Survey in Finland,
9)the Kaohsiung Municipal Hsiao-Kang Hospital study in Taiwan,
20)the Ohasama study,
8)and the primary medical care study in Japan.
21)A strength of this study is that it was performed on a relatively large number of population.
Consequently, we could conduct sub-group analyses according to sex, age, and BMI groups.
However, the present study has some limitations that warrant consideration. First, even though we measured BP 3 times, all BP measurements were done in a single day in an office setting; therefore, the values may not represent BP status on a typical day. Second, we could not exclude individuals with subclavian stenosis because angiography or imaging studies were unavailable. Third, dominant arm was not examined for our participants. We could not assess the effect of handedness on the inter-arm BP differences. However, according to the report of Lane et al.
6)the mean inter-arm BP difference was not significantly different between the dominant and non-dominant hand. Fourth, this study was conducted as a cross- sectional study in which all information was collected at the same point in time; therefore, we could not investigate risk factors causing increases in inter-arm BP differences. Lastly, the study participants were recruited from 4 districts throughout South Korea (Seoul, Goyang, Gimpo, and Incheon) and it is debatable whether these results can be generalized.
In conclusion, single-arm measurements, compared to double-arm measurements, may underestimate the prevalence of hypertension. In order to accurately diagnose hypertension, BP should be measured in both arms. However, if double-arm measurements are unavailable due to practical problems, right arm measurement is preferred for detection of hypertension, especially in women. Early detection of hypertension may be useful for preventing
complications related to hypertension and reducing cardiovascular event and mortality.
SUPPLEMENTARY MATERIALS
Supplementary Table 1
Predictive values for screening for hypertension according to subgroups including 361 participants with antihypertensive medication
Click here to view
Supplementary Table 2
Factors associated with large inter-arm BP differences
Click here to view
REFERENCES
1. Stamler J, Stamler R, Neaton JD. Blood pressure, systolic and diastolic, and cardiovascular risks. US population data. Arch Intern Med 1993;153:598-615.
PUBMED | CROSSREF
2. Whelton PK, Carey RM, Aronow WS, et al. 2017 ACC/AHA/AAPA/ABC/ACPM/AGS/APhA/ASH/ASPC/
NMA/PCNA guideline for the prevention, detection, evaluation, and management of high blood pressure in adults: a report of the American College of Cardiology/American Heart Association Task Force on clinical practice guidelines. J Am Coll Cardiol 2018;71:e127-248.
3. Chobanian AV, Bakris GL, Black HR, et al. The seventh report of the joint national committee on prevention, detection, evaluation, and treatment of high blood pressure: the JNC 7 report. JAMA 2003;289:2560-72.
PUBMED | CROSSREF
4. Petrie JC, O'Brien ET, Littler WA, de Swiet M. Recommendations on blood pressure measurement. Br Med J (Clin Res Ed) 1986;293:611-5.
PUBMED | CROSSREF
5. Cassidy P, Jones K. A study of inter-arm blood pressure differences in primary care. J Hum Hypertens 2001;15:519-22.
PUBMED | CROSSREF
6. Lane D, Beevers M, Barnes N, et al. Inter-arm differences in blood pressure: when are they clinically significant? J Hypertens 2002;20:1089-95.
PUBMED | CROSSREF
7. Song BM, Kim HC, Shim JS, Lee MH, Choi DP. Inter-arm difference in brachial blood pressure in the general population of Koreans. Korean Circ J 2016;46:374-83.
PUBMED | CROSSREF
8. Kimura A, Hashimoto J, Watabe D, et al. Patient characteristics and factors associated with inter-arm difference of blood pressure measurements in a general population in Ohasama, Japan. J Hypertens 2004;22:2277-83.
PUBMED | CROSSREF
9. Johansson JK, Puukka PJ, Jula AM. Interarm blood pressure difference and target organ damage in the general population. J Hypertens 2014;32:260-6.
PUBMED | CROSSREF
10. Tak YJ, Kim YJ, Lee SY, et al. Association of inter-arm blood pressure difference with atherosclerosis in patients without cardiovascular diseases. J Korean Soc Hypertens 2013;19:71-80.
CROSSREF
11. Amsterdam B, Amsterdam AL. Disparity and blood pressure in both arms in normals and hypertensives and its clinical significance. A study of 1,000 normals and hypertensive. N Y State J Med 1943;43:2294-300.
12. Southby R. Some clinical observations on blood pressure and their practical application, with special reference to variation of blood pressure readings in the two arms. Med J Aust 1935;2:569-80.
13. Perry I, Beevers D. Measurement of blood pressure in epidemiological surveys. In: O'Brien E, O'Malley K, editors.
Handbook of Hypertension. Amsterdam: Elsevier; 1991. p.175-83.
14. Variability of blood pressure and the results of screening in the hypertension detection and follow-up program. J Chronic Dis 1978;31:651-67.
PUBMED | CROSSREF
15. Weinberg I, Gona P, O'Donnell CJ, Jaff MR, Murabito JM. The systolic blood pressure difference between arms and cardiovascular disease in the Framingham Heart Study. Am J Med 2014;127:209-15.
PUBMED | CROSSREF
16. Verberk WJ, Kessels AG, Thien T. Blood pressure measurement method and inter-arm differences: a meta-analysis. Am J Hypertens 2011;24:1201-8.
PUBMED | CROSSREF
17. Park SJ, Son JW, Park SM, Choi HH, Hong KS. Relationship between inter-arm blood pressure difference and severity of coronary atherosclerosis. Atherosclerosis 2017;263:171-6.
PUBMED | CROSSREF
18. Kim J, Song TJ, Song D, et al. Interarm blood pressure difference and mortality in patients with acute ischemic stroke. Neurology 2013;80:1457-64.
PUBMED | CROSSREF
19. Chang Y, Choi GS, Lim SM, Kim YJ, Song TJ. Interarm systolic and diastolic blood pressure difference is diversely associated with cerebral atherosclerosis in noncardioembolic stroke patients. Am J Hypertens 2017;31:35-42.
PUBMED | CROSSREF
20. Su HM, Lin TH, Hsu PC, et al. Association of interarm systolic blood pressure difference with atherosclerosis and left ventricular hypertrophy. PLoS One 2012;7:e41173.
PUBMED | CROSSREF
21. Maeda S. Blood pressure differences between arms and association of dominant hands with blood pressure differences and carotid atherosclerosis. Blood Press Monit 2013;18:133-7.
PUBMED | CROSSREF