Differences in Bone Mineral Density between the Right and Left Hips in Postmenopausal Women
Bone mineral density (BMD) using dual energy radiography absorptiometry are commonly used for the diagnosis of osteoporosis. It is usually measured at the spine and also at one hip joint. Controversy still exists regarding the use of bilateral hip scanning. We analyzed the difference of BMD at bilateral hips in 384 postmenopausal women, retrospectively. The concordance and discordance rates of the lowest T-score and BMD between both hips were evaluated. The BMDs of the femoral neck and trochanter were significantly different between both hips (P < 0.05). There were also discrepancies between the lowest T-scores of both hips (P < 0.05). The discordance rates were about 30%. Due to significant differences in BMD between both hips at the femoral neck and trochanter and high discordance rate, bilateral hip measurements using DEXA are recommended to avoid underestimating osteoporosis.
Key Words: Osteoporosis; Diagnosis; Bone Mineral Density; Hip Hyun Jung Hwang, Si Young Park,
Soon Hyuck Lee, Seung Bum Han, and Kyung Han Ro
Department of Orthopedic Surgery, Korea University College of Medicine, Korea University Hospital, Seoul, Korea
Received: 14 November 2011 Accepted: 12 March 2012 Address for Correspondence:
Si Young Park, MD
Department of Orthopaedic Surgery, Korea University College of Medicine, Anam Hospital, 73 Inchon-ro, Seongbuk-gu, Seoul 136-705, Korea
Tel: +82.2-920-6605, Fax: +82.2-924-2471 E-mail: [email protected]
This study was supported by a grant of the Korea University R&D project (K1132311).
http://dx.doi.org/10.3346/jkms.2012.27.6.686 • J Korean Med Sci 2012; 27: 686-690
INTRODUCTION
Bone densitometry measurements are conducted for many reasons, such as evaluations of fracture risk in old age. The World Health Organization (WHO) introduced three diagnostic cate- gories (normal, osteopenic and osteoporotic bone) for the in- terpretation of bone mineral density (BMD) (1). BMD measure- ments by dual energy radiography absorptiometry (DEXA) are used for the diagnosis of osteoporosis. Bone densities are usu- ally measured at the lumbar spine (L1-4) and hip joints to grade the severity of osteoporosis by the lowest T-score. Unilateral mea- surements of proximal femoral BMD are typically performed to minimize time, medical costs and radiation exposure that is as- sociated with radiography (2). Minimal differences of bilateral proximal femoral BMD are assumed (2-5). However, some au- thors have observed BMD variation in opposing femora by DEXA measurements (6, 7). Furthermore, unilateral hip disorders, such as arthritis, hemiplegia, Paget’s disease, and fractures with or without implants, may affect BMD; it remains unclear whether symmetry of BMD in the proximal femur can be assumed (8- 10). Therefore, controversies exist regarding the use of bilateral hip scanning. As the diagnostic classification of osteoporosis is based solely on the lowest T-score at the spine and hip in most cases, interpretations could be affected by significant differenc-
es in hip BMDs between the left and right hips. The purpose of this study was to ascertain differences in BMD and the lowest T-score measurements of both hips in Korean women for the evaluation of osteoporosis using DEXA.
MATERIALS AND METHODS Participants and methods
This study was a retrospective cohort study. BMD data were collected from the Anam Hospital database. Postmenopausal women over 50 yr of age were eligible for the study if the follow- ing criteria were met: 1) measurements performed between 1 January 2007 and 31 December 2010 and 2) anatomical struc- tures that were suitable for DEXA scanning. Exclusion criteria included diseases affecting calcium homeostasis (i.e., hyper- parathyroidism or hypoparathyroidism, hyperthyroidism or hy- pothyroidism, hypocalcemia, rheumatoid arthritis, Paget’s dis- ease, osteomalacia, and serum creatinine levels greater than 1.7 mg/dL) and cancer.
Measurement of bone mineral density
The BMDs of both femoral necks, intertrochanteric areas and total BMD were measured on the same day using a Hologic Dis- covery W dual-energy x-ray absorptiometry (Hologic, Inc., Bed-
ford, MA, USA). Adult whole body software (QDR V. 12.1) was used for data acquisition and analysis. Bone mineral densities were expressed as grams per square centimeter (g/cm2). The results of measurements for the femoral neck, trochanteric area, intertrochanteric area, and total hip were collected. Ward’s tri- angle data were excluded. Bone status was determined by the lowest T-score. Cases were classified as normal, osteopenic bone, osteoporotic bone, or severely osteoporotic bone according to WHO criteria.
Other variables
Additional covariates were obtained from data collected con- currently with BMD measurements and included age, height (cm), weight (kg), and BMI (kg/m2). Using BMI scores, we clas- sified women as low weight (BMI < 20), normal (20 ≤ BMI < 25) and overweight (25 ≤ BMI).
Statistical analysis
Statistical analyses were performed with the Statistical Package for the Social Sciences (SPSS) V.18 software. Results are pre- sented as means ± SDs. The Wilcoxon signed ranks test was used to compare BMD measurements between the right and left hips. Analyses of covariance (ANCOVA) were used to deter- mine the influences of age, height, weight, and BMI on differ- ences between BMD and lowest T-score measurements. For all statistical comparisons, P values < 0.05 were considered sig- nificant.
Ethics statement
This retrospective study was reviewed and approved by the in- stitutional review board of Korea University Anam Hospital (IRB No. AN11036-001). Informed consent was waived by the board due to the study design.
RESULTS
Three hundred eighty four women were enrolled in this study.
The mean age was 69.5 ± 9.0 yr, and the mean height, weight and BMI were 151.9 ± 5.6 (cm), 55.04 ± 9.1 (kg), and 23.3 ± 3.5 (kg/m2), respectively. We compared bilateral BMD (g/cm2) at different parts of the femur (Table 1). There were significant dis- cordances of the neck and trochanteric area measurements between the right and left hips according to the Wilcoxon signed ranks test (P < 0.05). Other areas of the hip and the lowest T- scores did not differ significantly.
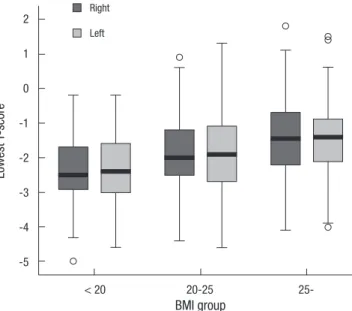
When included as a BMI covariate, ANCOVA indicated that the lowest T-scores differed significantly between the right and left hips (P = 0.018). Other covariates, age, height, and weight did not have a significant influence on T-score in ANCOVA. The values shown in Table 2 represent the means ± SDs and distri- butions of the lowest T-scores assigned to each BMI group. Fig. 1 is a box-whisker plot based on Table 2 that shows median values, interquartile range, spread, and outlying values for the lowest T-scores in the three groups. As BMI increased, the median T- score value increased.
The distribution according to WHO classification of osteopo- rosis and concordance rates between the lowest T-scores of both hips are shown in Table 3. The lowest T-scores were concordant between hips in a total of 70.9% of the women. The rest of the women (n = 112, 29.1%) would have been at risk of misdiagno- sis provisionally if only unilateral BMD measurements had been taken. Among these patients, 62 (16.3%) would have been clas- sified as having normal or only osteopenic bone mineral densi- ty if we had merely scanned them unilaterally. These groups are
Table 1. Bone mineral density of both hips Site in the femur
Right hip BMD (g/cm2)
(n = 384)
Left hip BMD (g/cm2)
(n = 384) P value
Neck 0.533 ± 0.15 0.551 ± 0.11 0.008*
Trochanter 0.519 ± 0.10 0.516 ± 0.09 < 0.001*
Intertrochanter 0.838 ± 0.17 0.843 ± 0.17 Ns
Total 0.693 ± 0.16 0.697 ± 0.17 Ns
Data are expressed as mean ± standard deviation. Statistical analysis was performed using Wilcoxon signed ranks test. *P < 0.05. Ns, not significant.
Table 2. Lowest T-score of each BMI Group
Lowest T-score BMI group
< 20 (n = 53) 20-25 (n = 209) > 25 (n = 122)
Right -2.39 ± 0.99 -0.84 ± 1.76 -1.47 ± 1.11
Left -2.38 ± 0.98 -1.90 ± 1.10 -1.50 ± 1.11
The values represent means ± SDs.
Fig. 1. Box and whisker plot. A box-whisker plot, based on Table 2, that shows medi- an values, interquartile range, spread, and outlying values for the lowest T-scores in the three groups. There are differences of interquartile range at each group. The me- dian values are increasing with the increasing of BMI.
Lowest T-score
BMI group
< 20 20-25 25-
2 1 0 -1 -2 -3 -4 -5
Right Left
important because they would have not received treatment for osteoporosis based upon just one score according to the WHO criteria. Fifteen patients (3.9%) who were diagnosed as having normal bone density actually had osteopenia; and 35 (9.1%) severely osteoporotic patients were underdiagnosed as simply having osteoporosis.
DISCUSSION
In our study, a significant bilateral difference in hip BMD (g/cm2) was identified at the neck and trochanter areas. We also con- firmed that BMI could influence the difference between bilat- eral hip BMD measurements; as BMI increased, the median T- score also tended to increase. To put the issue into a clinical per- spective, we usually use the lowest T-scores to determine pa- tients’ bone health according to the WHO classification. In our study, the lowest T-scores were discordant between hips in 30%
of participants and about 17% would have missed the chance to be treated for osteoporosis due to underestimation. Patients could be classified differently if only one normal or osteopenic hip is scanned but the osteoporotic or severely osteoporotic con- tralateral hip is not.
The reasons for the discordance of bilateral hip BMD can in- clude genetic variation, immobilization, pathology such as os- teoarthritis, stroke etc. (11, 12). Dominance of extremity can be another reason. Moreover, aerobic and strength training exer- cise can also make the skeletal system stronger. Krahl et al. (13) reported the professional tennis player could develop a stronger and bigger skeleton and a higher BMD in the dominant stroke arm.
However, a controversy exists regarding the clinical use of bilateral hip scans. Petley et al. (14) reported that only 3.3% pa- tients in whom one side was osteoporotic had other sides and/
or spine measurements that were normal or osteoporotic. Many authors agreed with this opinion. They insist that there is only a small benefit in performing bilateral femoral neck BMD mea- surements (15, 16). In contrast, Lilley et al. (7) revealed that the range of BMD differences between the femora was large; for some individuals, the BMD values differed by up to 35% in the femoral neck, 64% in Ward’s triangle and 80% in the trochanter.
They recommend routine scanning of both femora (7). We also observed a difference in bilateral BMDs at the femur neck and trochanteric area (P < 0.05).
The authors who were in opposition to bilateral scanning of BMD have mentioned that it is a time-consuming and costly procedure. Clinically, measuring BMD at the hip was made pos- sible with the introduction of dual-photon absorptiometry (DPA) in the early 1980s (17). However, the scan time for a single hip was 20 min or more, so it was not practical to consider bilateral hip scans in clinical practice. This lengthy time is the reason the practice of scanning only one hip remains the standard densi- tometry procedure in most large centers. With the advent of suc- cessive generations of scanning systems (such as DEXA), how- ever, scan times have become much shorter. A single hip scan can be easily completed in a few minutes in automated sequen- tial bilateral hip mode; the second hip adds only 60 sec, and both hips can be scanned in five minutes unless patient positioning needs to be adjusted. Therefore, the ability to perform bilateral hip scans is no longer constrained by time issues. Under the Korea National Health Service, patients pay the same price for routine scanning, which includes the L-spine and one femur, as they pay for scanning of the L-spine and both femurs. Thus, bi- lateral hip BMD scanning is no longer a time-consuming, or costly procedure.
Clinically, we gained some advantages from bilateral BMD monitoring. Bisphosphonate may induce insufficiency fractures in the subtrochanteric area. Alendronate, an inhibitor of bone resorption, is a drug widely used in osteoporosis treatment.
However, concerns have been raised recently about potential over suppression of bone turnover during long-term use. Many patients receiving bisphosphonates for the treatment of osteo- porosis have sustained atypical subtrochanteric femoral frac- tures (and sometimes simultaneous bilateral fractures) follow- ing low-energy trauma (18-21). Patients who take osteoporosis medication should have their bone mineral density checked regularly to retain approval of insurance coverage in Korea. In this situation, we can use the films for BMD measured by DEXA as a screening tool for cortical thickening at the subtrochanteric area without additional femur radiographs. As noted above, in- sufficiency fractures can develop bilaterally. BMD scanning is very beneficial, especially for patients who have taken bisphos- phonate medications for years.
Over the past several years, a series of meta-analyses has been performed to identify risk factors for osteoporotic fracture and to determine their dependence upon age, sex and BMD (22-25).
A fracture risk assessment tool (FRAXTM) was developed based upon the use of clinical risk factors both with or without BMD tests applied. This tool has been widely applied and studied in Korea (26). We can easily calculate a patient’s risk automatically by inputting patient data into the tool. The data include the fol- lowing variables: patient age, sex, height, weight, previous frac- Table 3. Concordance according to the lowest T-score
G1L G2L G3L G4L
G1R 31 (8.1%) 9 (2.3%) 0 (0%) 1 (0.3%)
G2R 6 (1.6%) 119 (31.0%) 29 (7.6%) 3 (0.8%)
G3R 0 (0%) 25 (6.5%) 43 (11%) 18 (4.7%)
G4R 0 (0%) 4 (1.0%) 17 (4.4%) 79 (21%)
Numbers represent women at each group. Numbers in parenthesis refer to each per- centage of all women. Italic & bold numbers represent ‘Concordance’ that shows patients and percentage in the same criteria according to WHO classification. G1, normal; G2, osteopenia; G3, osteoporosis; G4, severe osteoporosis; R, right side; L, left side.
ture history, parental history of hip fracture, current tobacco smoking, use of oral glucocorticoids, rheumatoid arthritis, other causes of secondary osteoporosis, and daily alcohol consump- tion. The tool has used the femoral neck site measured with DEXA as the reference standard for diagnosis of osteoporosis based upon a T-score of - 2.5 SD or lower using a standardized reference population and femoral neck BMD. FRAX algorithms give the ten-year probability of hip fracture and the ten-year prob- ability of a major osteoporotic fracture, including fractures of the spine, forearm, hip, or shoulder. Having data for the femoral neck BMD is essential when using the algorithm. Differences in neck BMD between the right and left sides could influence the results. For example, in our cohort, a 72-yr-old female patient (156 cm, 62 kg) had a 0.603 g/cm2 right femur neck BMD and a 0.512 g/cm2. The calculated results were a 2.7% ten-year proba- bility of hip fracture and an 8.3% ten-year probability of a major osteoporotic fracture based upon the right side BMD. Using the BMD of the left side, we found that a patient had a 5.8% ten-year probability of hip fracture and a 13% ten-year probability of a major osteoporotic fracture. These results would mean that we could have obtained inaccurate data from FRAX if her BMD scanning had been done unilaterally. We can go even further and derive a comparison of FRAX probabilities where the BMD input is based upon the lumbar spine T-score, minimum T- score (lumbar spine or bilateral femoral neck) and weighted mean T-score (lumbar spine or femoral neck or trochanter area).
This method will help narrow the proper choice of BMD input to the FRAX model and therefore improve estimates of risk clas- sification.
There were a few of limitation of our study. First, it looked at only one measurement. Follow up measurement would be nec- essary and could make up for a defect. Second, we limited range of investigation because most of BMD were taken in postmeno- pausal women to evaluate osteoporosis. Further evaluation in- cluding bilateral BMD check in all age group and sex should be performed to reflect precision.
Finally, as mentioned above, BMD discordance on upper ex- tremity according to side dominance is very interesting. That dominance on lower extremity may have a same influence. Un- fortunately, however in this study, side dominance of lower ex- tremity was not included. The study about effect of side domi- nance at proximal femur BMD will be necessary and may pro- vide a more accurate and interesting result.
In conclusion, we confirmed significant differences between hip BMD measurements at the femoral neck and trochanteric areas in a sample of postmenopausal women. We also observed discordance between the right and left hips in the lowest T-scores, which was more likely to occur with increasing BMI, and de- tected many cases of potential underestimation of osteoporosis if only one hip measurement had been performed. These results suggest that treatment opportunities will be missed if only one
hip is routinely scanned when evaluating postmenopausal wom- en for osteoporosis. Additionally, we can use bilateral hip BMD data in other clinical areas as well. Therefore, bilateral hip mea- surements using DEXA are recommended to avoid underesti- mating the BMD status of postmenopausal women and to ex- tend the application of BMD.
REFERENCES
1. WHO Study Group. Assessment of fracture risk and its application to screening for postmenopausal osteoporosis. Report of a WHO Study Group. World Health Organ Tech Rep Ser 1994; 843: 1-129.
2. Lessig HJ, Meltzer MS, Siegel JA. The symmetry of hip bone mineral den- sity. A dual photon absorptiometry approach. Clin Nucl Med 1987; 12:
811-2.
3. Balseiro J, Fahey FH, Ziessman HA, Le TV. Comparison of bone mineral density in both hips. Radiology 1988; 167: 151-3.
4. Yang RS, Chieng PU, Tsai KS, Liu TK. Symmetry of bone mineral density in the hips is not affected by age. Nucl Med Commun 1996; 17: 711-6.
5. Brownbill RA, Lindsey C, Crncevic-Orlic Z, Ilich JZ. Dual hip bone min- eral density in postmenopausal women: geometry and effect of physical activity. Calcif Tissue Int 2003; 73: 217-24.
6. Hall ML, Heavens J, Ell PJ. Variation between femurs as measured by dual energy X-ray absorptiometry (DEXA). Eur J Nucl Med 1991; 18: 38-40.
7. Lilley J, Walters BG, Heath DA, Drolc Z. Comparison and investigation of bone mineral density in opposing femora by dual-energy X-ray ab- sorptiometry. Osteoporos Int 1992; 2: 274-8.
8. Gotfredsen A, Riis BJ, Christiansen C, Rødbro P. Does a single local ab- sorptiometric bone measurement indicate the overall skeletal status?
Implications for osteoporosis and osteoarthritis of the hip. Clin Rheuma- tol 1990; 9: 193-203.
9. Takamoto S, Masuyama T, Nakajima M, Seikiya K, Kosaka H, Morimoto S, Ogihara T, Onishi T. Alterations of bone mineral density of the femurs in hemiplegia. Calcif Tissue Int 1995; 56: 259-62.
10. Franck H, Munz M, Scherrer M. Bone mineral density of opposing hips using dual energy X-Ray absorptiometry in single-beam and fan-beam design. Calcif Tissue Int 1997; 61: 445-7.
11. Prince RL, Price RI, Ho S. Forearm bone loss in hemiplegia: a model for the study of immobilization osteoporosis. J Bone Miner Res 1988; 3: 305-10.
12. Hamdy RC, Krishnaswamy G, Cancellaro V, Whalen K, Harvill L. Chang- es in bone mineral content and density after stroke. Am J Phys Med Re- habil 1993; 72: 188-91.
13. Krahl H, Michaelis U, Pieper HG, Quack G, Montag M. Stimulation of bone growth through sports. A radiologic investigation of the upper ex- tremities in professional tennis players. Am J Sports Med 1994; 22: 751-7.
14. Petley GW, Taylor PA, Murrills AJ, Dennison E, Pearson G, Cooper C.
An investigation of the diagnostic value of bilateral femoral neck bone mineral density measurements. Osteoporos Int 2000; 11: 675-9.
15. Mazess RB, Nord R, Hanson JA, Barden HS. Bilateral measurement of femoral bone mineral density. J Clin Densitom 2000; 3: 133-40.
16. Wong JC, McEwan L, Lee N, Griffiths MR, Pocock NA. The diagnostic role of dual femur bone density measurement in low-impact fractures.
Osteoporos Int 2003; 14: 339-44.
17. Hamdy R, Kiebzak GM, Seier E, Watts NB. The prevalence of significant
left-right differences in hip bone mineral density. Osteoporos Int 2006;
17: 1772-80.
18. Goh SK, Yang KY, Koh JS, Wong MK, Chua SY, Chua DT, Howe TS. Sub- trochanteric insufficiency fractures in patients on alendronate therapy: a caution. J Bone Joint Surg Br 2007; 89: 349-53.
19. Puhaindran ME, Farooki A, Steensma MR, Hameed M, Healey JH, Boland PJ. Atypical subtrochanteric femoral fractures in patients with skeletal malignant involvement treated with intravenous bisphospho- nates. J Bone Joint Surg Am 2011; 93: 1235-42.
20. Black DM, Cummings SR, Karpf DB, Cauley JA, Thompson DE, Nevitt MC, Bauer DC, Genant HK, Haskell WL, Marcus R, et al. Randomised trial of effect of alendronate on risk of fracture in women with existing vertebral fractures. Fracture Intervention Trial Research Group. Lancet 1996; 348: 1535-41.
21. Capeci CM, Tejwani NC. Bilateral low-energy simultaneous or sequen- tial femoral fractures in patients on long-term alendronate therapy. J
Bone Joint Surg Am 2009; 91: 2556-61.
22. Kanis JA, Johansson H, Oden A, Johnell O, De Laet C, Eisman JA, Mc- Closkey EV, Mellstrom D, Melton LJ 3rd, Pols HA, et al. A family history of fracture and fracture risk: a meta-analysis. Bone 2004; 35: 1029-37.
23. Kanis JA, Johansson H, Oden A, Johnell O, de Laet C, Melton IL III, Te- nenhouse A, Reeve J, Silman AJ, Pols HA, et al. A meta-analysis of prior corticosteroid use and fracture risk. J Bone Miner Res 2004; 19: 893-9.
24. Kanis JA, Borgstrom F, De Laet C, Johansson H, Johnell O, Jonsson B, Oden A, Zethraeus N, Pfleger B, Khaltaev N. Assessment of fracture risk.
Osteoporos Int 2005; 16: 581-9.
25. Kim SR, Ha YC, Park YG, Lee SR, Koo KH. Orthopedic surgeon’s aware- ness can improve osteoporosis treatment following hip fracture: a pro- spective cohort study. J Korean Med Sci 2011; 26: 1501-7.
26. Lee DY, Lim SJ, Moon YW, Min YK, Choi D, Yoon BK, Park YS. Determi- nation of an applicable FRAX model in Korean women. J Korean Med Sci 2010; 25: 1657-60.